
Key takeaways:
- U.S. securitized fixed income has, on average, performed better than corporate bonds through the five most recent corrections and bear markets.1 Within U.S. fixed income, only Treasuries have outperformed securitized sectors through such periods going back to 2015.
- In our view, the strong performance of securitized sectors is due to the high credit quality, low correlation to equities, and low duration within asset-backed securities (ABS), commercial mortgage-backed securities (CMBS), and collateralized loan obligations (CLOs), while agency MBS have benefitted from their perceived status as a safe-haven asset during bouts of volatility.
- We believe an appropriate allocation to securitized sectors is critical to navigating ongoing economic uncertainty and persistent volatility in equity markets. Because securitized exposure is typically not accessible through static benchmark indices, investors may need to tactically allocate to securitized sectors to increase their exposure.
1 A market correction is defined as a decline of 10% or more (but less than 20%) from the market’s most recent high. If the decline surpasses 20%, it is defined as a bear market.
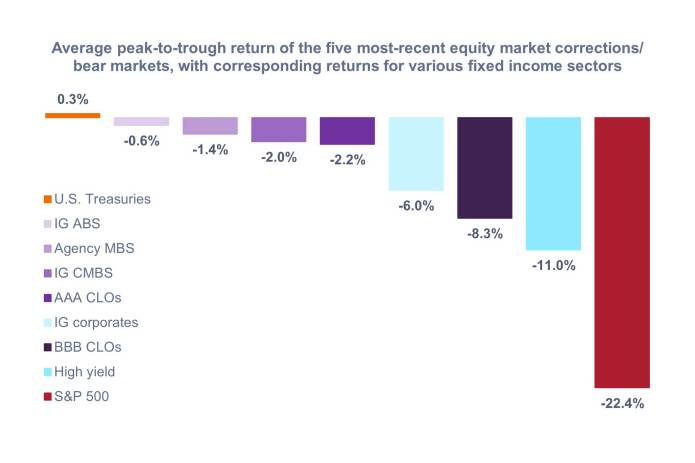
Source: Bloomberg, J.P. Morgan, as of 15 April 2025. Asset class descriptions and indices used to represent asset classes as per footnote.2 Returns represent the average peak-to-trough return for the five most recent corrections and bear markets on the S&P 500 Index, with corresponding returns for fixed income sectors over the same period. See the table below for more details. Past performance does not predict future returns.
Table 1: Peak-to-trough returns of the five most-recent equity market corrections/bear markets, with corresponding returns for various fixed income sectors over the same period
| 19 Feb 2025 – 8 Apr 2025 | 3 Jan 2022 – 12 Oct 2022 | 19 Feb 2020 – 23 Mar 2020 | 20 Sep 2018 – 24 Dec 2018 | 20 Jul 2015 – 11 Feb 2016 | Average | |
| U.S. Treasuries | 1.9% | -12.7% | 5.4% | 2.5% | 4.6% | 0.3% |
| IG ABS | 1.1% | -5.1% | -2.0% | 1.2% | 1.7% | -0.6% |
| Agency MBS | 1.1% | -13.9% | 1.2% | 1.9% | 2.9% | -1.4% |
| IG CMBS | 1.6% | -11.8% | -4.2% | 1.7% | 2.8% | -2.0% |
| AAA CLOs | -0.1% | -1.4% | -8.9% | -0.3% | -0.2% | -2.2% |
| IG corporates | -0.6% | -18.3% | -12.3% | 0.0% | 1.1% | -6.0% |
| BBB CLOs | -2.0% | -6.9% | -21.4% | -3.4% | -8.0% | -8.3% |
| High yield | -3.3% | -14.3% | -20.8% | -4.9% | -11.5% | -11.0% |
| S&P 500 | -18.9% | -25.4% | -33.9% | -19.8% | -14.1% | -22.4% |
Source: Bloomberg, J.P. Morgan, as of 15 April 2025. Past performance does not predict future returns.
Despite some sensationalized and misleading headlines regarding securitized assets, specifically CLOs, securitized sectors responded to recent events as we would have expected: Returns were mostly flat to slightly positive when equity markets were down almost 20%. The performance of securitized fixed income through the recent market correction is broadly in line with its performance during previous bouts of volatility. This further highlights our belief that an appropriate allocation to U.S. securitized fixed income is a key component of a strategic asset allocation.
2 U.S. Treasuries = Bloomberg U.S. Treasuries Index, IG ABS = Bloomberg US Aggregate Asset-Backed Securities Index, Agency MBS = Bloomberg U.S. Mortgage-Backed Securities Index, IG CMBS = Bloomberg Investment Grade Commercial Mortgage-Backed Securities Index, AAA CLOs = J.P. Morgan AAA CLO Index, IG corporates = Bloomberg U.S. Corporate Bond Index, BBB CLOs = J.P. Morgan BBB CLO Index, High yield = Bloomberg U.S. Corporate High Yield Bond Index, S&P 500 = S&P 500® Index.
Securitized products, such as mortgage- and asset-backed securities, are more sensitive to interest rate changes, have extension and prepayment risk, and are subject to more credit, valuation and liquidity risk than other fixed-income securities.
Fixed income securities are subject to interest rate, inflation, credit and default risk. The bond market is volatile. As interest rates rise, bond prices usually fall, and vice versa. The return of principal is not guaranteed, and prices may decline if an issuer fails to make timely payments or its credit strength weakens.
Related insights

These are the views of the author at the time of publication and may differ from the views of other individuals/teams at Janus Henderson Investors. References made to individual securities do not constitute a recommendation to buy, sell or hold any security, investment strategy or market sector, and should not be assumed to be profitable. Janus Henderson Investors, its affiliated advisor, or its employees, may have a position in the securities mentioned.
Past performance does not predict future returns. The value of an investment and the income from it can fall as well as rise and you may not get back the amount originally invested.
The information in this article does not qualify as an investment recommendation.
There is no guarantee that past trends will continue, or forecasts will be realised.
Marketing Communication.