

Key takeaways:
- In the calm after the storm – the widespread market instability seen in August – volatility has subsided in equities and bonds, but corporate credit spreads have lagged the retracement.
- Given increasing risk of economic slowdown, corporate credit valuations may be scrutinised. However, we show how spreads may not be optically as rich as they appear, nor do they stand out as anomalous.
- Recent volatility has highlighted the benefits of the inclusion of fixed income as a defensive diversifier in multi-asset portfolios and further pockets of volatility may present tactical opportunities for active investors.
Calm after the storm?
Market fears ignited earlier this month with concerns around the state of the US economy. This initially centred on the cooling of the US labour market, which raised alarm about the potential for economic slowdown or stagnation. Other factors were the actions at the Bank of Japan (strengthening the yen and subsequent unwinding of the carry trade in the currency) as well as lower-than-expected inflation in the US. This, combined with the jobs report, sparked fears that the Fed may have missed the boat on cutting rates. The volatility soon extended beyond the US, affecting other regions that exhibited similar economic conditions, such as Europe. As valuations have been priced for a ‘soft’ landing, market instability was widespread across equities and bonds.
Corporate credit spreads widened across the board with more pronounced weakening in US high yield (HY), perhaps given the sensitivity of US corporate spreads to the strength of the US consumer. Credit spread is the additional yield – or income – that a bond pays an investor above the risk-free rate to compensate for the additional credit, or default, risk. Recession risk is therefore a headwind for spreads and corporate and consumer health often go hand in hand. While European high yield is correlated with equities and ergo equity volatility, European investment grade (IG) spreads are sensitive to base rates given their longer duration. After the sharp valuation falls, markets and volatility have recovered somewhat. But when comparing European IG spreads versus rates volatility, there appears to be a wide differential, with spreads lagging the retracement.
Figure 1: Spreads versus rates volatility
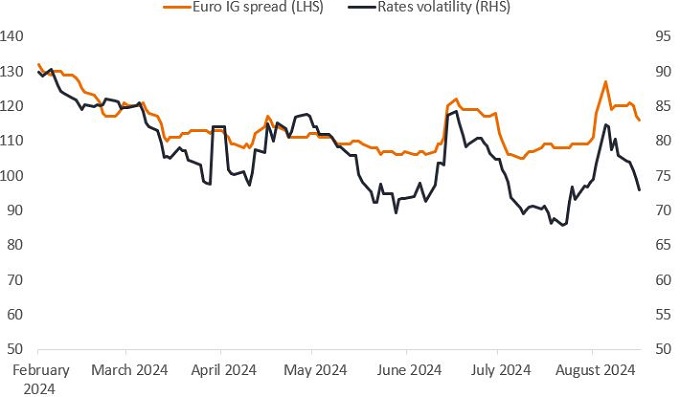
Source: Bloomberg, as at 16 August 2024. Option-adjusted spread of the ICE BofA Euro Corporate Index. Merrill Lynch Swaption Option Volatility Estimate EUR 3 Month= rate volatility.
Spread levels are important to active managers, as a barometer of cheapness and reflective of upside and downside potential. Active managers seek to maximise the overall yield – and by implication, the spread – of a portfolio in relation to the risk it takes to earn that yield. As the macro picture changes, we ask do corporate credit valuations offer a balanced risk/reward profile as recession risk increases?
A different lens to spreads
Spread levels broadly rise and fall on factors such as changes in the macroeconomic environment, strengthening or weakening in corporate fundamentals, and changes in the supply and demand dynamics of the bond market. Active managers will closely monitor these and other factors in relation to spread levels to determine how to best position their portfolios and whether a move in spreads appropriately reflects a change in risk. Typically, as credit risk increases, credit spread increases.
However, a sole focus on headline spread levels does not consider other factors that can influence spreads of an index over time, such as average bond prices, duration, industry composition and quality – or credit ratings distribution. Janus Henderson has developed a proprietary model that adjusts for these differences, which we believe allows us to compare spreads more accurately over time. When adjusting spreads for changes in index composition around quality and duration, Euro IG option-adjusted (OAS) spreads are trading at a higher percentile – cheaper or higher than they have traded in the past – than headline levels would suggest. The quality of the Bloomberg Euro Aggregate Corporate Total Return Index is weaker than in the past with the rise in Baa credits as a proportion of the index, while the duration of the index is also slightly longer due to a number of factors and fluctuates over time, as shown in Figures 2 and 3 respectively.
Figure 2: Rise in Baa exposure in the index over time
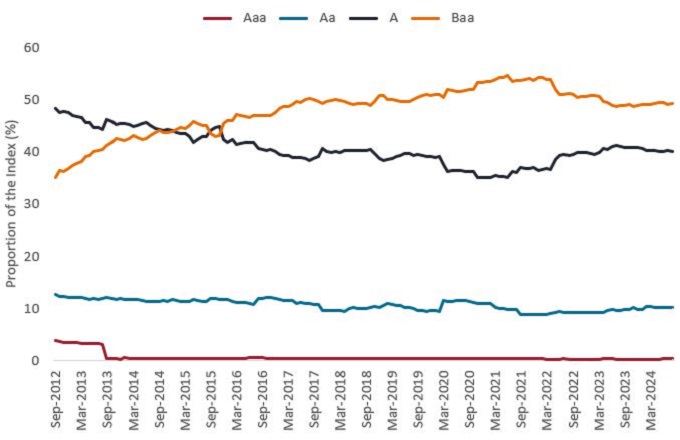
Source: Barclays, Bloomberg, Bloomberg Euro Aggregate Corporate Total Return Index, 22 August 2024.
Figure 3: Option-adjusted duration of the Euro IG index has fluctuated over time
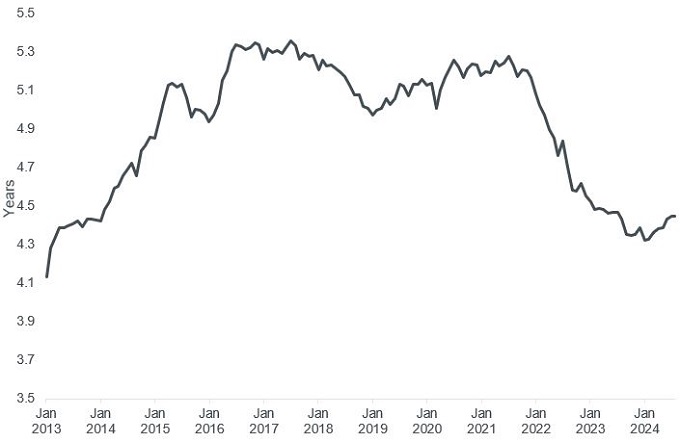
Source: Bloomberg, Bloomberg Euro Aggregate Corporate Total Return Index, 22nd August 2024.
Over a long history, credit spreads may narrow or widen due to changes in the maturity profile of the index. Without adjusting for these duration changes, it may optically appear that these spread movements are due to changing expectations around where we are in the market cycle. When adjusting for such changes in the index as well as quality composition over time, by keeping duration constant, Euro IG1 spreads are trading at the 64th percentile going back to 2013 (when our model began), compared to the headline spread being in the 49th percentile – a 14% valuation differential. Spread valuations are therefore not as rich as optically they would suggest when you adjust them for such changes (Figure 4).
Figure 4: Adjusted versus unadjusted option-adjusted spread
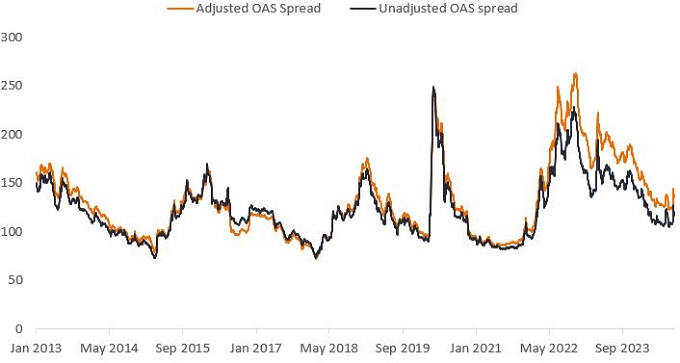
Source: Bloomberg, Janus Henderson Investors, as at 15 August 2024. Adjusted spreads represent the Bloomberg Euro Aggregate Corporate Total Return Index and the adjusted spreads are computed from the euro-denominated corporate subset of the Bloomberg Global Aggregate Index. Past performance does not predict future returns.
Assessing relative value
Another comparison that active managers take account of is relative value on a global basis. Across global, European, US, Lat Am and EM credit indices, the biggest move wider in spreads over the month to 12 August 2024 (inclusive and just after the period of significant market volatility) was in Euro IG and Euro HY2 , which both traded 16% wider on an unadjusted basis. On an adjusted basis, relative to the other US and Sterling IG markets, Euro IG offers significantly better relative value (Figure 5). Better valuations make sense in the context of the recent French elections, higher public deficits and geopolitical risk, as there is more perceived fragmentation risk in the currency bloc. By investing globally, active managers can capture relative value opportunities by tilting a portfolio in different directions between and across markets to take advantage of geographic or currency dislocations and other mispriced opportunities. For example, selective opportunities that emerged amid the volatility after President Macron called a snap election in France.
Figure 5: Corporate credit percentiles for adjusted spreads
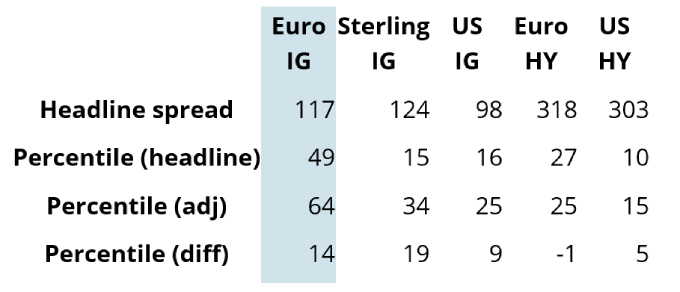
Source: Bloomberg, based on the Bloomberg Global Aggregate Index and filtered for the individual asset classes, as at 15 August 2024.
Potential spread drivers?
When considering the supporting factors and risks for corporate credit valuations, active managers consider a number of factors, including the macroeconomic environment, technicals (or supply and demand dynamics) and company health or corporate fundamentals. So, what are the drivers for spreads going forward?
- Soft finesse (macro) – Whether economies manage to orchestrate a soft landing or not in cutting rates quickly enough to circumvent recession while keeping inflation in check. Spreads are currently pricing in a soft landing. A ‘hard’ landing or a recession is a risk to the valuation outlook.
- Demand for credit (technicals) – Demand for IG credit remains strong with trading volumes through the recent volatility absorbed. Despite some rallying, the yields available in Euro IG still look attractive. We believe that positioning in credit is not overextended, so positive inflows in the asset class should support valuations.
Figure 6: Demand for IG remains strong
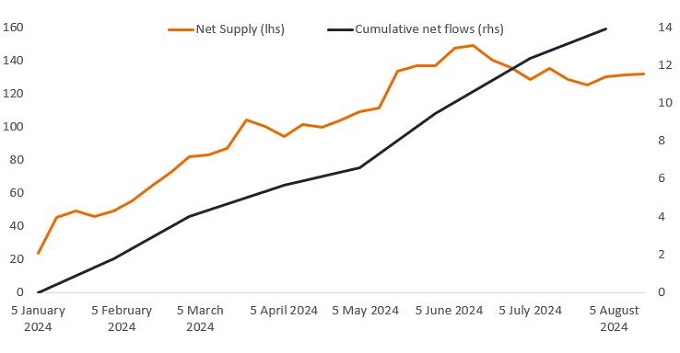
Source: Deutsche Bank for net supply. Morningstar flows from Broadbridge, as at 16 August 2024.
- Corporate health (fundamentals) – As nominal growth – inflation plus real growth – slows, earnings will likely slow, which is a challenge for credit quality. On average corporate leverage and interest coverage ratios are close to historical norms, but after some deterioration over the last 12 months, we are seeing signs of stabilisation in both these metrics. We expect defaults to stay lower in higher quality credit. Our quarterly credit risk monitor tracks corporate credit fundamentals over time and our debt loads traffic light is amber, reflecting company revenues and cash holdings have grown into elevated debt loads. Second-quarter earnings have been positive thus far, but we expect earnings growth will slow down and dispersion in markets – between industry, region and credit quality – to rise.
Dispersion is the ‘name of the game’
On dispersion, it is useful to look at the historical distribution of all spreads to assess how normal today’s valuations are. As Figure 7 shows, spread levels are more normalised than it may appear, with the current level of spreads on the fat part of the distribution and, therefore, are not that abnormal.
Figure 7: Spread ranges are around normal levels when looking historically
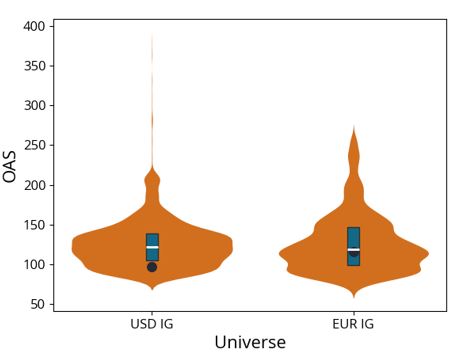
Source: Janus Henderson Investors, Bloomberg. Bloomberg Euro Aggregate Corporate Total Return Index and Bloomberg US Corporate Index. Historical distribution of spreads between 17 April 2012 to 20 August 2024. Dark circle is the latest data point. Blue box shows the region between the historical 25-75 percentiles. White line is the historical median. OAS = option-adjusted spread.
Nevertheless, spreads are far off from pricing in recession risks and are still reflecting expectations of a soft landing. Pockets of volatility – where liquidity continues to be squeezed and real interest rates remain restrictive – could present tactical investment opportunities going forward. It could reset spread ranges higher and instead of having a large middle in a distribution – many companies trading at average levels – it may push some valuations more to the tails, the extremes at each end. It appears that there is more balanced upside and downside in spreads now in our view and dispersion should leave opportunities for active managers to take advantage of.
Carry is king
Recent volatility serves as a reminder of the value of bonds providing an income buffer for portfolio returns, as well as participation in upside when yields fall. As we look ahead to the rate-cutting cycle progressing, investors are expected to continue to take advantage of locking in higher yields. Carry is back for fixed income as it has reclaimed its traditional role of providing an income and acts as a defensive diversifier in investment portfolios. As there is a clear fragility in markets, we believe there will continue to be volatile times ahead that will leave active investors able to capture mispriced opportunities.
1 Source: Janus Henderson Investors, Bloomberg Euro Aggregate Corporate Total Return Index, as at 15 August 2024.
2 As represented by the ICE BofA indices.
IMPORTANT INFORMATION
These are the views of the author at the time of publication and may differ from the views of other individuals/teams at Janus Henderson Investors. References made to individual securities do not constitute a recommendation to buy, sell or hold any security, investment strategy or market sector, and should not be assumed to be profitable. Janus Henderson Investors, its affiliated advisor, or its employees, may have a position in the securities mentioned.
There is no guarantee that past trends will continue, or forecasts will be realised.
Past performance does not predict future returns.
The information in this article does not qualify as an investment recommendation.
Marketing Communication.
Queste sono le opinioni dell'autore al momento della pubblicazione e possono differire da quelle di altri individui/team di Janus Henderson Investors. I riferimenti a singoli titoli non costituiscono una raccomandazione all'acquisto, alla vendita o alla detenzione di un titolo, di una strategia d'investimento o di un settore di mercato e non devono essere considerati redditizi. Janus Henderson Investors, le sue affiliate o i suoi dipendenti possono avere un’esposizione nei titoli citati.
Le performance passate non sono indicative dei rendimenti futuri. Tutti i dati dei rendimenti includono sia il reddito che le plusvalenze o le eventuali perdite ma sono al lordo dei costi delle commissioni dovuti al momento dell'emissione.
Le informazioni contenute in questo articolo non devono essere intese come una guida all'investimento.
Non vi è alcuna garanzia che le tendenze passate continuino o che le previsioni si realizzino.
Comunicazione di Marketing.
Important information
Please read the following important information regarding funds related to this article.
- Gli emittenti di obbligazioni (o di strumenti del mercato monetario) potrebbero non essere più in grado di pagare gli interessi o rimborsare il capitale, ovvero potrebbero non intendere più farlo. In tal caso, o qualora il mercato ritenga che ciò sia possibile, il valore dell'obbligazione scenderebbe.
- L’aumento (o la diminuzione) dei tassi d’interesse può influire in modo diverso su titoli diversi. Nello specifico, i valori delle obbligazioni si riducono di norma con l'aumentare dei tassi d'interesse. Questo rischio risulta di norma più significativo quando la scadenza di un investimento obbligazionario è a più lungo termine.
- Il Fondo investe in obbligazioni ad alto rendimento (non investment grade) che, sebbene offrano di norma un interesse superiore a quelle investment grade, sono più speculative e più sensibili a variazioni sfavorevoli delle condizioni di mercato.
- Alcune obbligazioni (obbligazioni callable) consentono ai loro emittenti il diritto di rimborsare anticipatamente il capitale o di estendere la scadenza. Gli emittenti possono esercitare tali diritti laddove li ritengano vantaggiosi e, di conseguenza, il valore del Fondo può esserne influenzato.
- Un Fondo che presenta un’esposizione elevata a un determinato paese o regione geografica comporta un livello maggiore di rischio rispetto a un Fondo più diversificato.
- Il Fondo potrebbe usare derivati al fine di conseguire il suo obiettivo d'investimento. Ciò potrebbe determinare una "leva", che potrebbe amplificare i risultati dell'investimento, e le perdite o i guadagni per il Fondo potrebbero superare il costo del derivato. I derivati comportano rischi aggiuntivi, in particolare il rischio che la controparte del derivato non adempia ai suoi obblighi contrattuali.
- Qualora il Fondo detenga attività in valute diverse da quella di base del Fondo o l'investitore detenga azioni o quote in un'altra valuta (a meno che non siano "coperte"), il valore dell'investimento potrebbe subire le oscillazioni del tasso di cambio.
- Se il Fondo, o una sua classe di azioni con copertura, intende attenuare le fluttuazioni del tasso di cambio tra una valuta e la valuta di base, la stessa strategia di copertura potrebbe generare un effetto positivo o negativo sul valore del Fondo, a causa delle differenze di tasso d’interesse a breve termine tra le due valute.
- I titoli del Fondo potrebbero diventare difficili da valutare o da vendere al prezzo e con le tempistiche desiderati, specie in condizioni di mercato estreme con il prezzo delle attività in calo, aumentando il rischio di perdite sull'investimento.
- Le spese correnti possono essere prelevate, in tutto o in parte, dal capitale, il che potrebbe erodere il capitale o ridurne il potenziale di crescita.
- I CoCo (Obbligazioni contingent convertible) possono subire brusche riduzioni di valore in caso d’indebolimento della solidità finanziaria di un emittente e qualora un evento trigger prefissato comporti la conversione delle obbligazioni in azioni dell’emittente o il loro storno parziale o totale.
- Il Fondo potrebbe perdere denaro se una controparte con la quale il Fondo effettua scambi non fosse più intenzionata ad adempiere ai propri obblighi, o a causa di un errore o di un ritardo nei processi operativi o di una negligenza di un fornitore terzo.
Specific risks
- Gli emittenti di obbligazioni (o di strumenti del mercato monetario) potrebbero non essere più in grado di pagare gli interessi o rimborsare il capitale, ovvero potrebbero non intendere più farlo. In tal caso, o qualora il mercato ritenga che ciò sia possibile, il valore dell'obbligazione scenderebbe.
- L’aumento (o la diminuzione) dei tassi d’interesse può influire in modo diverso su titoli diversi. Nello specifico, i valori delle obbligazioni si riducono di norma con l'aumentare dei tassi d'interesse. Questo rischio risulta di norma più significativo quando la scadenza di un investimento obbligazionario è a più lungo termine.
- Il Fondo potrebbe usare derivati al fine di conseguire il suo obiettivo d'investimento. Ciò potrebbe determinare una "leva", che potrebbe amplificare i risultati dell'investimento, e le perdite o i guadagni per il Fondo potrebbero superare il costo del derivato. I derivati comportano rischi aggiuntivi, in particolare il rischio che la controparte del derivato non adempia ai suoi obblighi contrattuali.
- Qualora il Fondo detenga attività in valute diverse da quella di base del Fondo o l'investitore detenga azioni o quote in un'altra valuta (a meno che non siano "coperte"), il valore dell'investimento potrebbe subire le oscillazioni del tasso di cambio.
- Se il Fondo, o una sua classe di azioni con copertura, intende attenuare le fluttuazioni del tasso di cambio tra una valuta e la valuta di base, la stessa strategia di copertura potrebbe generare un effetto positivo o negativo sul valore del Fondo, a causa delle differenze di tasso d’interesse a breve termine tra le due valute.
- I titoli del Fondo potrebbero diventare difficili da valutare o da vendere al prezzo e con le tempistiche desiderati, specie in condizioni di mercato estreme con il prezzo delle attività in calo, aumentando il rischio di perdite sull'investimento.
- Le spese correnti possono essere prelevate, in tutto o in parte, dal capitale, il che potrebbe erodere il capitale o ridurne il potenziale di crescita.
- Il Fondo potrebbe perdere denaro se una controparte con la quale il Fondo effettua scambi non fosse più intenzionata ad adempiere ai propri obblighi, o a causa di un errore o di un ritardo nei processi operativi o di una negligenza di un fornitore terzo.