
Key takeaways:
- Echoes of the past: Movements in US 10-year Treasury yields since the last rate hike (in July 2023) have followed a strikingly similar path to the 1970s following the last rate hikes, despite a much more benign inflation backdrop.
- A rally’s foundation: History shows that a necessary pre-condition for a sustained bond market rally is a sustained decline in realised bond volatility.
- Signs of change: A regime shift may be underway, with recent data showing US bond market volatility moving below a critical threshold, following European bond markets with a two-month lag.
Readers of our insights in recent months will be familiar with Figure 1 below. This plots the change in US 10-year Treasury yield in the months after the US Federal Reserve (Fed) stops hiking interest rates. We observed that yields eventually fell in every case study since the 1960s, regardless of whether the environment was characterised by high inflation (1969-81 period) or low inflation (1984-2018 period). Crucially though, the path to lower yields varied considerably.
Figure 1: Change in US 10-year Treasury yield after last rate hike
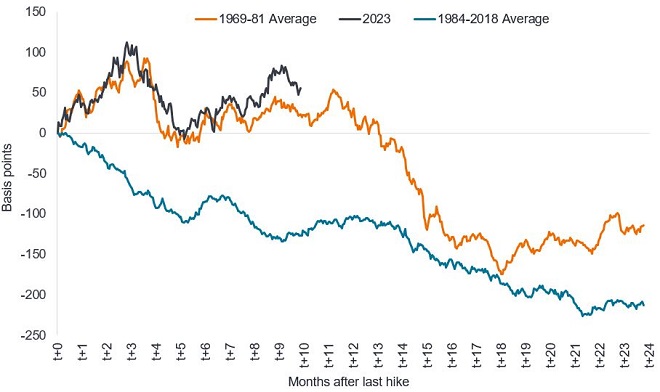
Source: Bloomberg, Janus Henderson calculations, as at 17 May 2024. Basis point (bp) equals 1/100 of a percentage point, 1bp = 0.01%. Past performance does not predict future returns. There is no guarantee that past trends will continue, or forecasts will be realised.
Since the Fed last raised rates in July 2023 the path of the US 10-year Treasury yield has tended to track the average of the 1970s (orange line) in an uncanny manner. Looking closely at the bond market in this period we observed that a necessary condition for a sustained bond market rally was a sustained fall in realised bond market volatility, something which appears to be beginning in the US and has already been achieved on a sustained basis in other markets.
Volatility threshold crossed
Stepping back, a hallmark of the recent three-year bear market in bonds is that it has seen a return to a previous volatility regime whereby higher bond volatility was correlated to rising bond yields, similar to the behaviour of bonds from 1960-2000. In contrast, from 2000 to 2020, higher bond volatility often coincided with a fall in yields (e.g. 2008, March 2020). Volatility regimes tend to persist, either because they are associated with a change in the economic risk or policy backdrop or because of adaptive expectations (where markets tend to form expectations about the future based on what happened in the near past).
Studying the history of the US bond market (1960-2000) in this previous volatility regime, a break back below a given level of volatility was a necessary condition to get a sustainable rally in bonds. That key threshold was a 3-month realised volatility of 7.5% which equates to a daily yield change of 4.7 basis points (bps). We studied realised volatility for the simple reason that implied volatility data for bond markets only stretches back to the late 1980s.
Since early May (coinciding with Fed Chairman Jerome Powell reiterating no more rate hikes, weaker employment data and the first below expectation inflation print this year), the US bond market is beginning to follow the European bond market below this volatility threshold, an encouraging sign. Although this move is nascent and needs to be sustained, it is notable as it suggests that the scars of the recent bond bear market are beginning to heal.
Figure 2: Realised volatility on US 10-year Treasuries
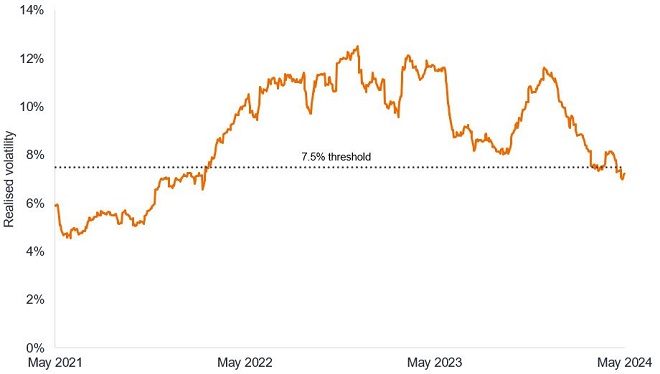
Source: Bloomberg, 3-month realised volatility on US 10-year Treasury, 17 May 2021 to 17 May 2024.
Realised versus implied volatility – the essentials
Volatility measures the movement in price of a security over a specific period. Realised volatility measures actual historical volatility of a security. Mathematically, it compares how far a price deviates from its average value, up or down, in a specified period. The higher the value, the higher the volatility. Implied volatility is calculated from option prices to provide an expectation about future volatility. It is forward-looking and can be thought of as reflecting traders’ best estimates of what future realised volatility will be. Implied volatility rises when markets are more uncertain.
Path of bond yields
So what happens to bond yields when we cross into this lower volatility regime? In Figure 3 we have plotted the average path yields have taken historically once the 7.5% volatility threshold is crossed.
Figure 3: Average historical path of US 10-year Treasury yields after realised volatility crosses below 7.5%
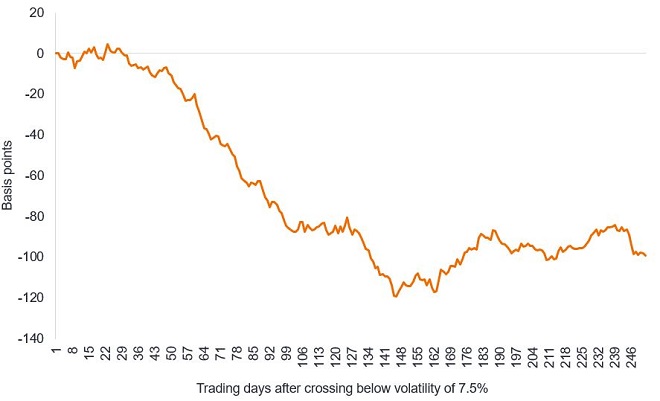
Source: Bloomberg, US 10-year Treasury yield. Average path of seven periods starting in 1970, 1975, 1989, 1990, 1994, 1997 and 2000 where volatility had initially been above 7.5% (and coincident with rising yields) and subsequently moved below 7.5%. Past performance does not predict future returns.
Looking at previous cycles back to the 1960s, there are two key implications for bond yields:
- Yields do not move lower immediately; they typically range trade modestly for the first one to two months. During this time, it is crucial that realised volatility does not pick up again as there was one such false signal (in 1984) where realised volatility and yields began to rise after 24 trading days.
- Thereafter you enter the heart of the bond rally. Three months after the initial cross, yields are 20 basis points (bps) lower on average, six months after yields are lower by 90bps on average, seven months after yields are lower by 120bps on average, and one year out they are 100bps lower.
Individual cases
In five of the seven examples, yields begin to fall within two months of the condition being met. However, in 1997 it took 3.5 months and in 1990 it took 4.5 months and yields went higher by 50bps initially. The 1990 example is somewhat complicated by its unusual backdrop: rate cuts had already begun and hence 10-year Treasury yields were already declining substantially.
Bond market healing
We view the decline in US bond market volatility as an encouraging sign that the market is engaging in a healing process that makes bonds more investable. Lower uncertainty (growing confidence in the end of the tightening cycle) is contributing to lower volatility. As mentioned, other developed markets are further ahead in this process as rate cuts have either started (Switzerland, Sweden) or are expected in the coming months (Eurozone, UK, Canada).
We cannot rule out a surprise in economic data that causes a resurgence of volatility. This could negate current central bank guidance that it is a question of when, not if, it is time to cut interest rates. On balance, however, we believe the monetary and economic landscape is shaping up for a downward move in rates globally, which should encourage investors to lock in yields in fixed income.
Basis point. Basis point (bp) equals 1/100 of a percentage point, 1bp = 0.01%.
Bear market/Bull market: A bear market A bear market is one in which the prices of securities are falling in a prolonged or significant manner. A bull market is one in which the prices of securities are rising, especially over a long time.
Inflation: The rate at which prices of goods and services are rising in the economy.
Monetary Policy refers to the policies of a central bank, aimed at influencing the level of inflation and growth in an economy. It includes controlling interest rates and the supply of money. Monetary tightening refers to central bank activity aimed at curbing inflation and slowing down growth in the economy by raising interest rates and reducing the supply of money.
Option: A financial derivative that give buyers the right, but not the obligation, to buy or sell an underlying asset at an agreed-upon price and date.
Yield: The level of income on a security over a set period, typically expressed as a percentage rate. For a bond, at its most simple, this is calculated as the coupon payment divided by the current bond price.
U.S. Treasury securities are direct debt obligations issued by the U.S. Government. The investor is a creditor of the government. Treasury Bills and U.S. Government Bonds are guaranteed by the full faith and credit of the U.S. government, are generally considered to be free of credit risk and typically carry lower yields than other securities.
Volatility measures risk using the dispersion of returns for a given investment. The rate and extent at which the price of a portfolio, security or index moves up and down.
IMPORTANT INFORMATION
Fixed income securities are subject to interest rate, inflation, credit and default risk. The bond market is volatile. As interest rates rise, bond prices usually fall, and vice versa. The return of principal is not guaranteed, and prices may decline if an issuer fails to make timely payments or its credit strength weakens.
There is no guarantee that past trends will continue, or forecasts will be realised.
Queste sono le opinioni dell'autore al momento della pubblicazione e possono differire da quelle di altri individui/team di Janus Henderson Investors. I riferimenti a singoli titoli non costituiscono una raccomandazione all'acquisto, alla vendita o alla detenzione di un titolo, di una strategia d'investimento o di un settore di mercato e non devono essere considerati redditizi. Janus Henderson Investors, le sue affiliate o i suoi dipendenti possono avere un’esposizione nei titoli citati.
Le performance passate non sono indicative dei rendimenti futuri. Tutti i dati dei rendimenti includono sia il reddito che le plusvalenze o le eventuali perdite ma sono al lordo dei costi delle commissioni dovuti al momento dell'emissione.
Le informazioni contenute in questo articolo non devono essere intese come una guida all'investimento.
Non vi è alcuna garanzia che le tendenze passate continuino o che le previsioni si realizzino.
Comunicazione di Marketing.
Important information
Please read the following important information regarding funds related to this article.
- Gli emittenti di obbligazioni (o di strumenti del mercato monetario) potrebbero non essere più in grado di pagare gli interessi o rimborsare il capitale, ovvero potrebbero non intendere più farlo. In tal caso, o qualora il mercato ritenga che ciò sia possibile, il valore dell'obbligazione scenderebbe.
- L’aumento (o la diminuzione) dei tassi d’interesse può influire in modo diverso su titoli diversi. Nello specifico, i valori delle obbligazioni si riducono di norma con l'aumentare dei tassi d'interesse. Questo rischio risulta di norma più significativo quando la scadenza di un investimento obbligazionario è a più lungo termine.
- Il Fondo investe in obbligazioni ad alto rendimento (non investment grade) che, sebbene offrano di norma un interesse superiore a quelle investment grade, sono più speculative e più sensibili a variazioni sfavorevoli delle condizioni di mercato.
- Alcune obbligazioni (obbligazioni callable) consentono ai loro emittenti il diritto di rimborsare anticipatamente il capitale o di estendere la scadenza. Gli emittenti possono esercitare tali diritti laddove li ritengano vantaggiosi e, di conseguenza, il valore del Fondo può esserne influenzato.
- Un Fondo che presenta un’esposizione elevata a un determinato paese o regione geografica comporta un livello maggiore di rischio rispetto a un Fondo più diversificato.
- Il Fondo potrebbe usare derivati al fine di conseguire il suo obiettivo d'investimento. Ciò potrebbe determinare una "leva", che potrebbe amplificare i risultati dell'investimento, e le perdite o i guadagni per il Fondo potrebbero superare il costo del derivato. I derivati comportano rischi aggiuntivi, in particolare il rischio che la controparte del derivato non adempia ai suoi obblighi contrattuali.
- Se il Fondo, o una sua classe di azioni con copertura, intende attenuare le fluttuazioni del tasso di cambio tra una valuta e la valuta di base, la stessa strategia di copertura potrebbe generare un effetto positivo o negativo sul valore del Fondo, a causa delle differenze di tasso d’interesse a breve termine tra le due valute.
- I titoli del Fondo potrebbero diventare difficili da valutare o da vendere al prezzo e con le tempistiche desiderati, specie in condizioni di mercato estreme con il prezzo delle attività in calo, aumentando il rischio di perdite sull'investimento.
- Le spese correnti possono essere prelevate, in tutto o in parte, dal capitale, il che potrebbe erodere il capitale o ridurne il potenziale di crescita.
- I CoCo (Obbligazioni contingent convertible) possono subire brusche riduzioni di valore in caso d’indebolimento della solidità finanziaria di un emittente e qualora un evento trigger prefissato comporti la conversione delle obbligazioni in azioni dell’emittente o il loro storno parziale o totale.
- Il Fondo potrebbe perdere denaro se una controparte con la quale il Fondo effettua scambi non fosse più intenzionata ad adempiere ai propri obblighi, o a causa di un errore o di un ritardo nei processi operativi o di una negligenza di un fornitore terzo.
- L’aumento (o la diminuzione) dei tassi d’interesse può influire in modo eterogeneo sulle diverse obbligazioni. Nello specifico, di norma i prezzi delle obbligazioni si riducono all’aumentare dei tassi d’interesse. Ciò accade soprattutto alle obbligazioni maggiormente sensibili alle variazioni dei tassi d’interesse. Poiché una quota significativa del fondo potrebbe essere investita in tali obbligazioni (o in derivati obbligazionari), un rialzo dei tassi d’interesse potrebbe incidere negativamente sui rendimenti del fondo.