Please ensure Javascript is enabled for purposes of website accessibility Balanced Fund - Janus Henderson Investors

JBALX Balanced Fund

For 30 years, this dynamic allocation strategy has delivered our equity and fixed income expertise in a one-stop core solution.

NAV
$46.72
As of 22/07/2024

1-Day Change
$0.35 (0.75%)
As of 22/07/2024

YTD Return
11.32%
As of 22/07/2024

Morningstar Rating

As of 30/06/2024

Overview

Quarterly Update

Watch the investment team recap this quarter.

(Note: Filmed in January 2024).

30 YEAR HISTORY OF

Providing S&P 500®-Like Returns with Significantly Less Volatility

Fund Highlights

  • High-conviction large-cap growth equities paired with an active intermediate-term bond strategy
  • Dynamic asset allocation approach that migrates between 35%-70% equity depending on market conditions
  • Integrated research allows our equity and fixed income analysts to work side by side covering the same global sectors
Balancing Act: how will growth and inflation risks impact asset classes in the months ahead?

Equity allocation adapting to market changes

Balanced Fund equity allocation in relation to market volatility (12/31/97 – 6/30/24)

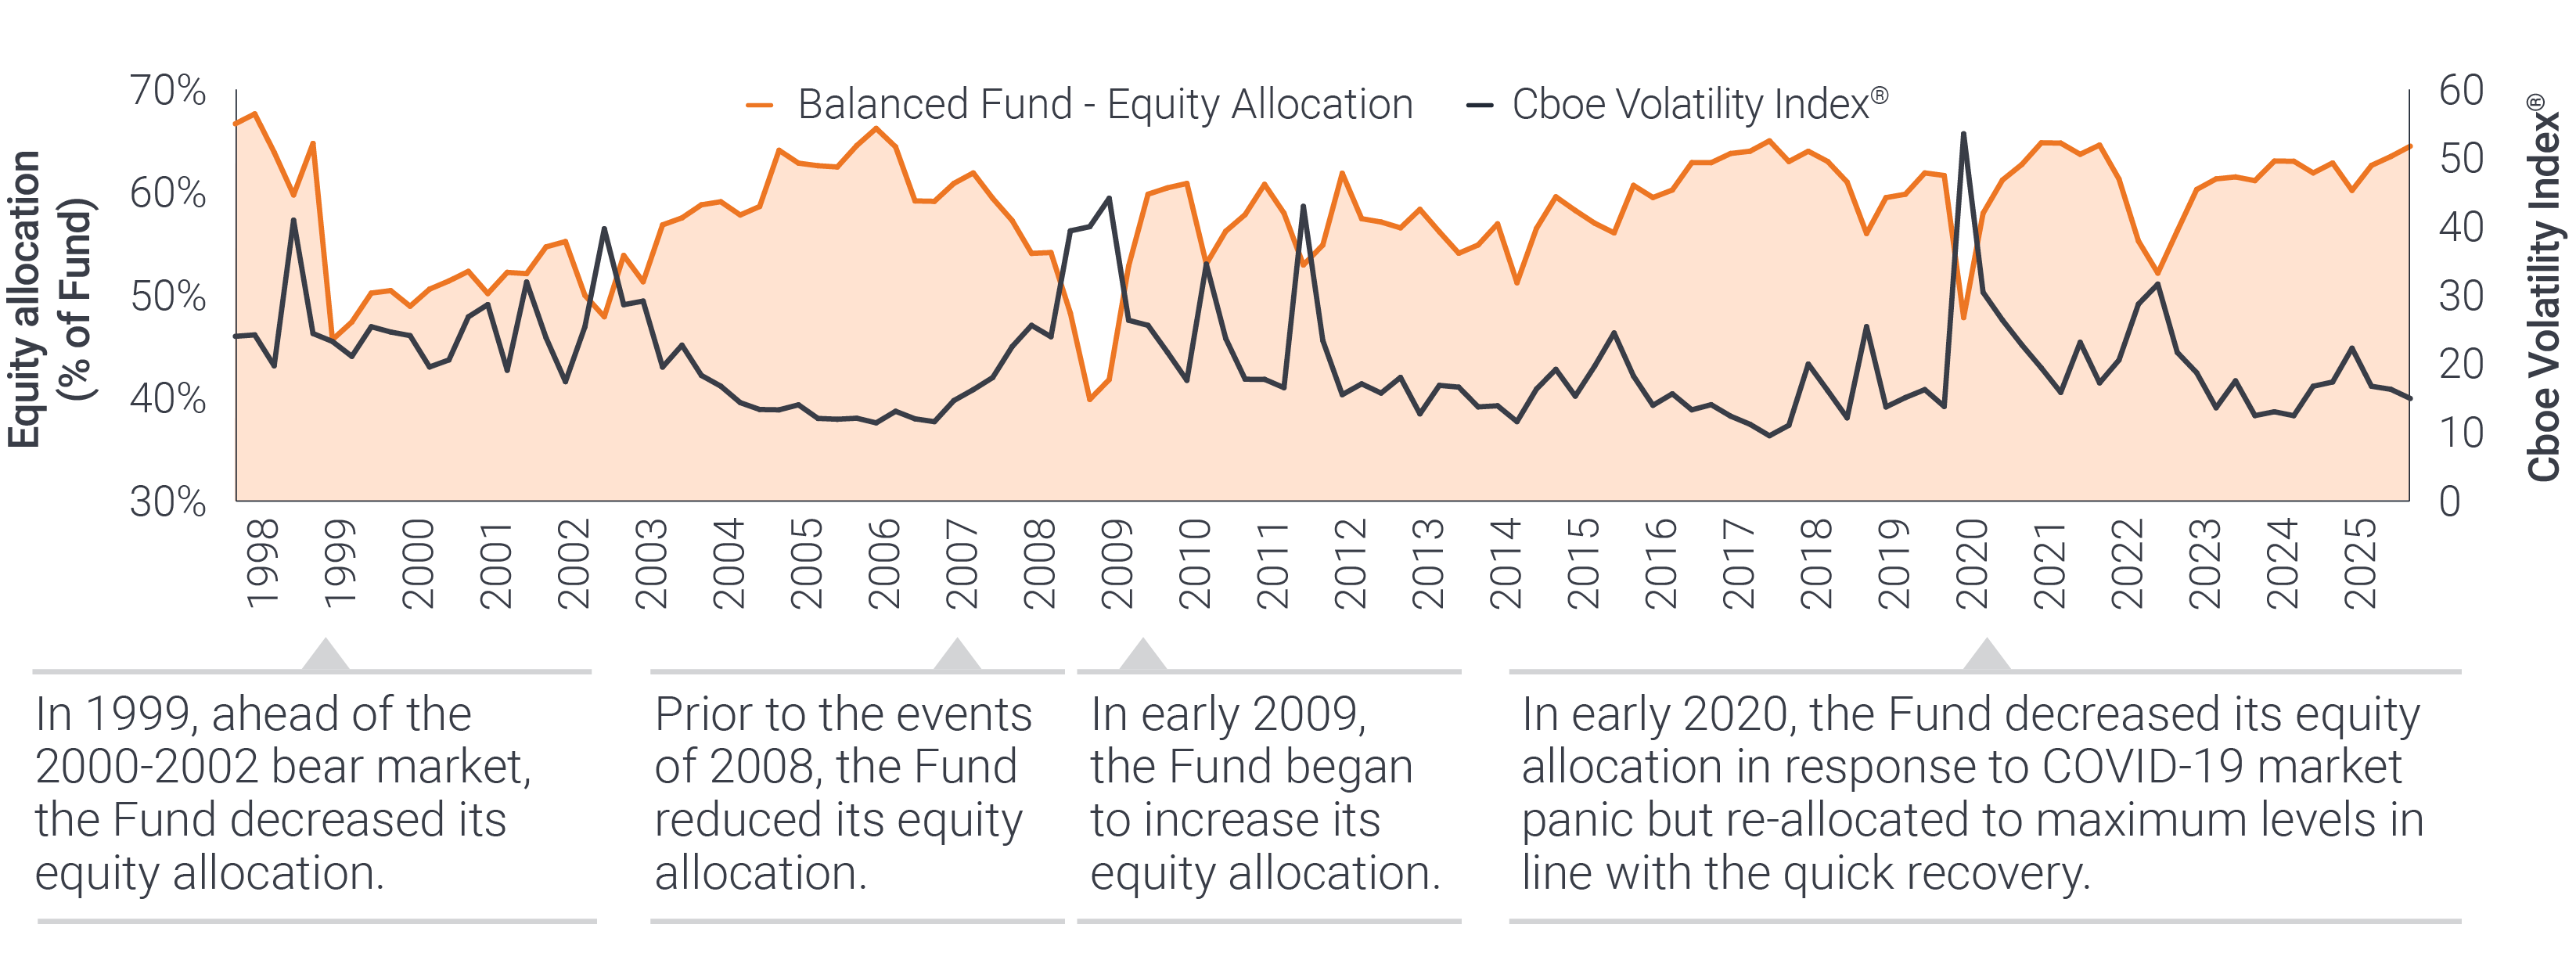
Cboe Volatility Index® or VIX® Index® shows the market’s expectation of 30-day volatility. It is constructed using the implied volatilities of a wide range of S&P 500® index options and is a widely used measure of market risk. The VIX Index volatility methodology is the property of Chicago Board of Options Exchange, which is not affiliated with Janus Henderson.

As of 6/30/24, Balanced Fund Class I Shares Morningstar Ratings in the Moderate Allocation category: 4 stars out of 689 funds, 4 stars out of 649 funds and 5 stars out of 493 funds, for the 3-, 5-, and 10-year periods, respectively.

RATINGS AND AWARDS

2023 Lipper Awards Winner United States

AN UNCOMPROMISING APPROACH

Equity markets may shift.
Our focus never does.

equity-hero-fg_custom_en

PORTFOLIO MANAGEMENT

Jeremiah Buckley, CFA

Portfolio Manager

Industry since 1998. Joined Firm in 1998.

Greg Wilensky, CFA

Head of U.S. Fixed Income | Portfolio Manager

Industry since 1993. Joined Firm in 2020.

Michael Keough

Portfolio Manager

Industry since 2006. Joined Firm in 2007.

Performance

RETURNS (%) (As of 30/06/2024)
Balanced Fund - I Shares S&P 500® Index Bloomberg U.S. Aggregate Bond Index Balanced Index
 
3M YTD 1YR 3YR 5YR 10YR Since Inception
(09/01/1992)
Balanced Fund - I Shares 3.12 10.39 16.84 4.71 9.14 8.56 9.69
S&P 500® Index 4.28 15.29 24.56 10.01 15.04 12.86 10.56
Bloomberg U.S. Aggregate Bond Index 0.07 -0.71 2.63 -3.02 -0.23 1.35 4.47
Balanced Index 2.62 8.14 14.58 4.27 8.29 7.83 8.09
Calendar Year Returns (%)
Balanced Fund - I Shares S&P 500® Index
2023 2022 2021 2020 2019 2018 2017 2016 2015 2014
Balanced Fund - I Shares 15.43 -16.55 17.24 14.39 22.59 0.70 18.58 4.61 0.64 8.53
S&P 500® Index 26.29 -18.11 28.71 18.40 31.49 -4.38 21.83 11.96 1.38 13.69

MORNINGSTAR PERCENTILE

(As Of 23/07/2024)
1 YR 3 YR 5 YR 10 YR SINCE INCEPTION
Percentile Ranking 13 17 14 8 5
Moderate Allocation | Rank/Count 81/737 98/698 76/676 35/594 11/181
(As Of 23/07/2024)
1 YR 3 YR 5 YR 10 YR SINCE INCEPTION
Percentile Ranking 13 17 14 8 5
Moderate Allocation | Rank / Count 81/737 98/698 76/676 35/594 11/181

GROWTH OF A HYPOTHETICAL INVESTMENT

Balanced Fund - I Shares Balanced Index Moderate Allocation

RETURNS-BASED STATISTICS (As of 30/06/2024 Class I Shares)

RISK / REWARD
VS. Balanced Index (60%S&P500/40%BBUSAgg)
3YR 5YR
Information Ratio 0.28 0.43
Alpha 0.42 0.54
Tracking Error 1.51 1.83
Beta 1.03 1.05
R-squared (%) 98.69 98.03
UP/DOWN MARKET CAPTURE (%)
VS. Balanced Index (60%S&P500/40%BBUSAgg)
3YR 5YR
Up Capture Ratio 105.99 110.26
Down Capture Ratio 103.03 106.47
STANDARD DEVIATION 3YR 5YR
Balanced Fund 12.88 12.40
Balanced Index (60%S&P500/40%BBUSAgg) 12.45 11.69
SHARPE RATIO 3YR 5YR
Balanced Fund 0.11 0.55
Balanced Index (60%S&P500/40%BBUSAgg) 0.08 0.51
ANNUAL FEES & EXPENSES (As of the most recent prospectus)
CLASS I SHARES
Management Fees 0.55%
Other Expenses 0.11%
Total Gross Expenses 0.66%
Waivers 0.00%
Total Net Expenses 0.66%

Portfolio

Index represents the S&P 500® Index.

Top Holdings (As of 30/06/2024)
% of Fund
Microsoft Corp 6.38
NVIDIA Corp 5.38
Apple Inc 3.51
Alphabet Inc 3.16
Amazon.com Inc 2.50
Meta Platforms Inc 2.18
Mastercard Inc 2.07
UnitedHealth Group Inc 1.70
Lam Research Corp 1.67
American Express Co 1.45
TOTAL 30.00
View full holdings
Portfolio Characteristics (As of 30/06/2024)
 
Number of Holdings
Equity Issues
65
Number of Holdings
Debt Issues
717
Market Capitalization
Weighted Average
$1,106.09B
Portfolio Turnover Rate
(1-year trailing)
71.47%
Price/Earnings Ratio
(1-year forward)
23.98
Price/Book Ratio
7.99
Earnings Growth Rate
(1-year forward)
20.30%
Weighted Average Maturity
(years)
5.54
Effective Duration
(years)
6.37
Yield to Worst
5.57%
Asset Allocation:
Equity Fixed Income Cash & Equivalents
Sector Allocation % of Fund % of Fund As of 30/06/2024
Regional Allocation % of Fund % of Fund As of 06/30/2024
Market Capitalization Range of Equity Holdings % of Fund % of Fund As of 30/06/2024
Developed vs Emerging Markets % of Fund % of Fund As of 06/30/2024
Credit Quality of Fixed Income Holdings % of Fund % of Fund As of 06/30/2024
Maturity Breakdown of Fixed Income Holdings % of Fund % of Fund As of 30/06/2024

Documents