
Key takeaways:
- The equity market readjusted aggressively in the first half of this year. Following a period of shuffling leadership and multiple compression, we remain confident that long-term, sustainable earnings growth will ultimately drive company value.
- Volatility rewarded some companies we think are secularly challenged, yet we continue to believe in the power of long-term shifts in technology use and the companies poised to benefit.
- Market turbulence has also readjusted the equity risk premium, which has reached more rational levels, with the market presenting long-term growth opportunities.
Resetting the equity market
The U.S. equity market readjusted aggressively in the first half of this year and has since recovered to some extent, but investors are still trying to assess what effects inflation – and the Federal Reserve’s (Fed) response – will have on economic growth, and likewise, corporate earnings. What we have observed is that much of the market performance has been due to price-to-earnings (P/E) multiple contraction. Earnings estimates for the S&P 500® Index have not changed dramatically this year and, in fact, have continued to grow while the index price has dropped. In other words, while earnings are still growing, investors are now willing to pay less for those earnings.
Balancing consumer and labor strength with rising rates and inflation
While earnings have continued to grow (though more modestly), coming into the year we expected double-digit growth given the strength of consumer and corporate balance sheets, which could support spending and investment to spur economic growth. At the time, personal saving rates remained elevated relative to recent history, boosted by COVID-related government stimulus and consumers’ inability to spend on services due to the pandemic. Saving rates have since come down, driving a portion of consumer spending as those stimulus dollars are spent. At the same time, a shortage of labor since the beginning of the pandemic has inflated wages, also contributing to consumer strength. As illustrated in Figure 1 below, personal consumption expenditures have continued to grow despite tightening monetary policy from central banks.
Figure 1: Personal consumption expenditures, saving rate, and hourly earnings growth (2007- 2022)
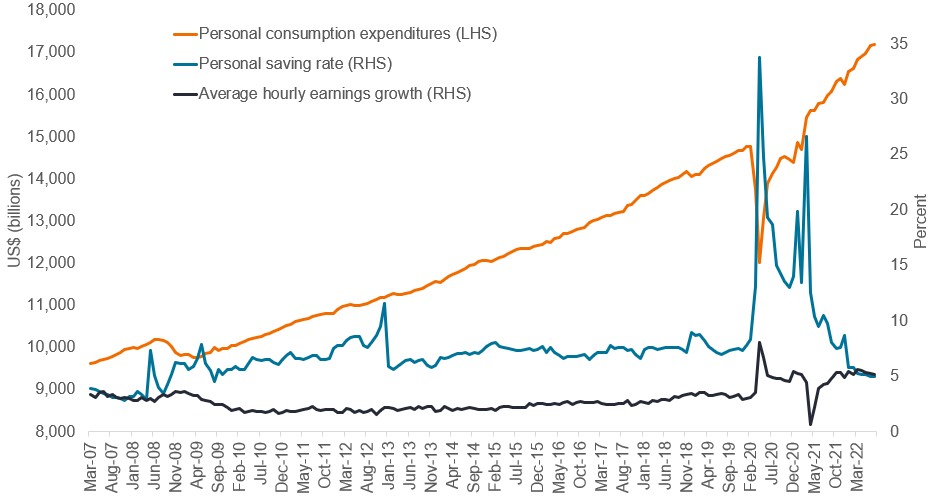
Source: Federal Reserve Economic Data (FRED).
The force of consumer strength has complicated the Fed’s task of reining in inflation. Consumers are in a stronger position than in previous rate-hiking cycles, which has made it harder to predict the economic effects of higher rates. Recent employment numbers have shown an uptick in labor force participation, as workers return to a tight market, potentially alleviating some wage inflation. Signs of improving inflation could make the Fed less inclined to continue its hawkish bent, which could bode well for future economic growth. It remains to be seen how this balancing act will evolve as stimulus dries up and the Fed continues to tighten, but for now, consumers appear to be on relatively solid footing.
A closer look at earnings
Figure 2: S&P 500 year-to-date earnings growth
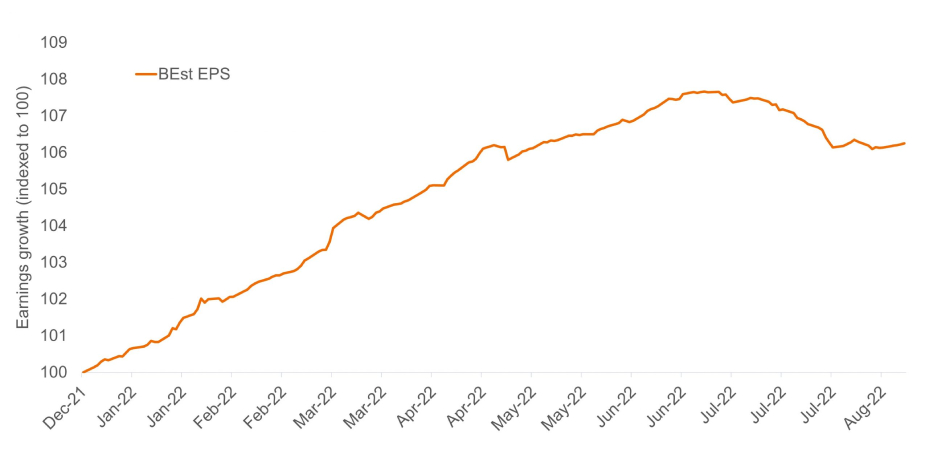
Source: Bloomberg. BEst (Bloomberg Estimates) Earnings Per Share (EPS), blended 12 months.
Earnings estimates have moderated slightly in the face of rapidly rising interest rates, higher commodity prices ‒ particularly in energy ‒ and a significantly stronger dollar, which has been a headwind specifically for multinational corporations, manufacturers, and exports. However, consensus earnings forecasts still assume strong growth for this year, following a double-digit year-over-year increase in S&P 500 earnings for the first half of the year. As a result of higher commodity prices, the composition of S&P 500 earnings has also shifted. While overall market earnings expectations have slowed, commodity-oriented and energy company earnings have seen a significant boost, driven in part by supply disruptions from the ongoing Russia-Ukraine conflict and following a period of general underinvestment in commodities by U.S. companies. On the downside, some retailers have been forced to mark down excess inventory as consumer spending ‒ which tilted heavily toward physical goods during the pandemic ‒ has shifted back to services faster than expected. While some of those retailers have reduced earnings assumptions for the year, on a whole earnings estimates have remained relatively stable.
As seen in Figure 3 below, strong performance in the energy and utilities sectors has carried the S&P 500 returns this year. While other sectors have lagged, earnings in the coming year are expected to increase significantly for the benchmark as a whole and in areas such as communication services and consumer discretionary that have been punished significantly this year.
Figure 3: S&P 500 year-to-date returns and earnings estimates by sector
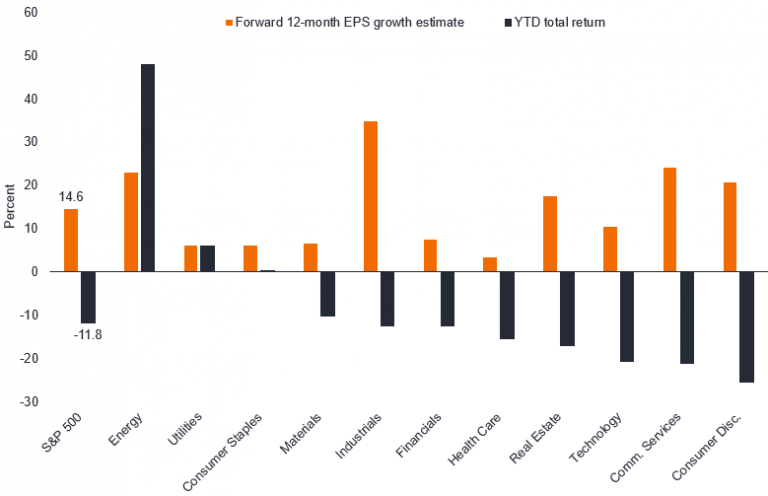
Source: Bloomberg, as of 1 September 2022.
At the same time, many companies who have faced inflation from a strong dollar or higher commodity prices have been passing along cost increases to customers for the last few quarters. These increases tend to be sticky even after cost pressures ease, and companies are now seeing the benefits through higher sales and improving margins. We believe this has the potential to contribute to earnings growth in the second half of the year and through the first half of 2023, particularly if inflation moderates. So, while this year has seen a dramatic skew in performance toward energy and commodities-related companies in the index, we think that earnings growth can begin to drive stock returns in other areas of the market going forward.
Growth themes persist
On top of multiple compression, the first half of 2022 was one of the worst periods of performance for growth stocks relative to value in the last decade. We don’t expect this disparity to continue ‒ we believe stock prices over time are driven by long-term sustainable earnings growth, and that companies able to grow earnings over time will benefit. We have written in the past about the power of long-term themes and companies poised to take advantage of secular shifts in the use of technology. While the investment backdrop has shifted meaningfully this year, we do not believe that the significance of these themes has changed. Specifically, companies using technology to improve data analytics around their customer relationships and to improve their products will continue to gain share and become more efficient over time. Companies with strong balance sheets and consistent cash flows that can invest through volatile macroeconomic periods like the current one will also position themselves for faster relative growth as we move toward a more normal investment environment.
We remain focused on growth companies within our target U.S. market. Many of the world’s most successful technology companies are based in the U.S., and its economic environment has fostered a culture of growth and innovation. The U.S. equity market is also the largest in the world, with its companies accounting for over 40% of global market capitalization.1 U.S. dividend growth showed exceptional resilience during the pandemic, and while it has lagged this year, this by no means implies weakness. Over 97% of companies increased their dividends or held them steady in the second quarter. At the same time, U.S. companies have increased share buybacks to funnel surging cash flow back to shareholders.
Figure 4: Janus Henderson Global Dividend Index – North America
Source: Janus Henderson. The Janus Henderson Global Dividend Index (JHGDI) is a long-term study into global dividend trends. It measures the progress global firms are making in paying their investors an income on their capital.
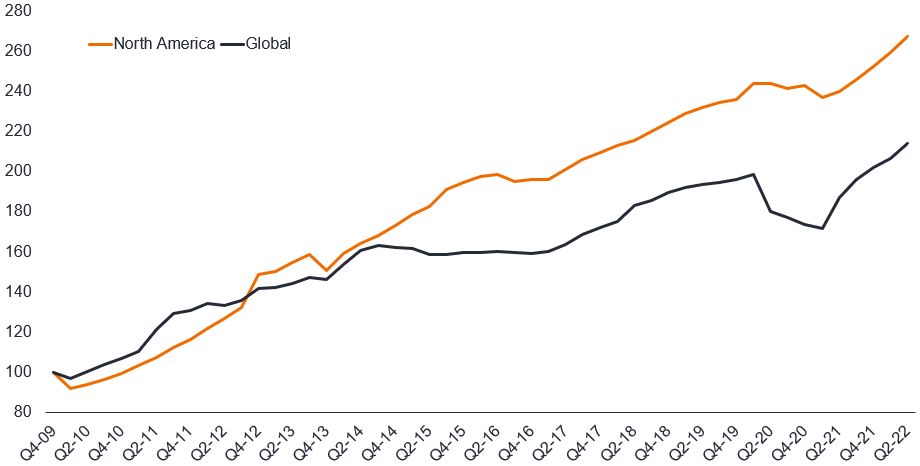
All in all, we believe in U.S. companies’ ability to adapt and create value, and have seen this rewarded, particularly in recent years, as the U.S. market has outperformed other global markets.
Figure 5: U.S. and global index performance
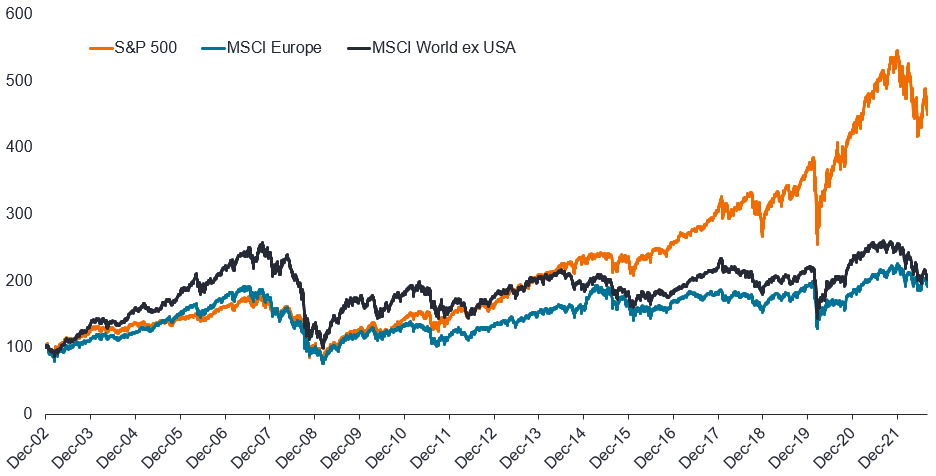
Source: Bloomberg, as of 31 August 2022. Cumulative returns rebased to 100.
Weighing opportunities as risk/reward shifts
Market turbulence this year has readjusted the equity risk premium and our view on the relative attractiveness of stocks versus bonds in the current environment. As growth has moderated, uncertainty has increased, and nominal yields have risen, the risk/reward trade-off has become more balanced compared to last year, when risk/reward strongly favored equities. That said, the equity risk premium has also reached more rational levels. Overall, we believe volatility like we have experienced this year can create dislocations between price and value. As company valuations and risk/reward continue to adjust, perceptive investors may be able to capitalize on the opportunities the market is now offering.
[jh_content_filter spoke=”apac-social, arpa, auii, aupi, axii, bepa, brpa, clpa, cnpi-en, copa, deii, dkii, dkpa, dkpi, fiii, fipa, hkpi-en, iepa, iepi, lupa, lupi, media, mxpa, nlii, noii, nopa, nopi, pepa, ptpa, seii, sepa, sepi, sgpi, social, ukii, ukpa, ukpi, uopa, usii, uspa, uspi, uypa, zapa”]

[/jh_content_filter]
MSCI Europe Index℠ reflects the equity market performance of developed markets in Europe.
The Fed, or Federal Reserve is the central banking system on the United States
Fixed income securities are subject to interest rate, inflation, credit and default risk. The bond market is volatile. As interest rates rise, bond prices usually fall, and vice versa. The return of principal is not guaranteed, and prices may decline if an issuer fails to make timely payments or its credit strength weakens.
Correlation measures the degree to which two variables move in relation to each other. A value of 1.0 implies movement in parallel, -1.0 implies movement in opposite directions, and 0.0 implies no relationship.
Growth and value investing each have their own unique risks and potential for rewards, and may not be suitable for all investors. Growth stocks are subject to increased risk of loss and price volatility and may not realize their perceived growth potential. Value stocks can continue to be undervalued by the market for long periods of time and may not appreciate to the extent expected.
Technology industries can be significantly affected by obsolescence of existing technology, short product cycles, falling prices and profits, competition from new market entrants, and general economic conditions. A concentrated investment in a single industry could be more volatile than the performance of less concentrated investments and the market as a whole.