
Key takeaways:
- As bond investors consider their expectations for the future of the economy and interest rates, corporate credit valuations may be called into question.
- While corporate credit spreads are trading tighter than their 10-year averages, after adjusting for changes to the index over time, and in light of the macroeconomic environment, we believe corporate valuations are appropriately priced.
- When constructing multi-sector portfolios that include corporate, securitized, government, and global fixed income assets, we believe investors should look to active managers with a proven record of executing a research-driven approach.
While equity investors might look to a valuation metric such as the price-to-earnings ratio to determine if stocks look cheap or expensive, bond investors typically pay attention to credit spreads. (Credit spread is the additional yield – or income – that a bond pays an investor above the risk-free U.S. Treasury rate to compensate for the additional credit, or default, risk.)
Spread levels are of particular importance to active managers because active managers seek to maximize the overall yield – and by implication, the spread – of a portfolio in relation to the risk it takes to earn that yield.
The basics of interest rate risk and return
Before diving into credit spread analysis, it is important to first understand the basic workings of the U.S. Treasury yield curve.
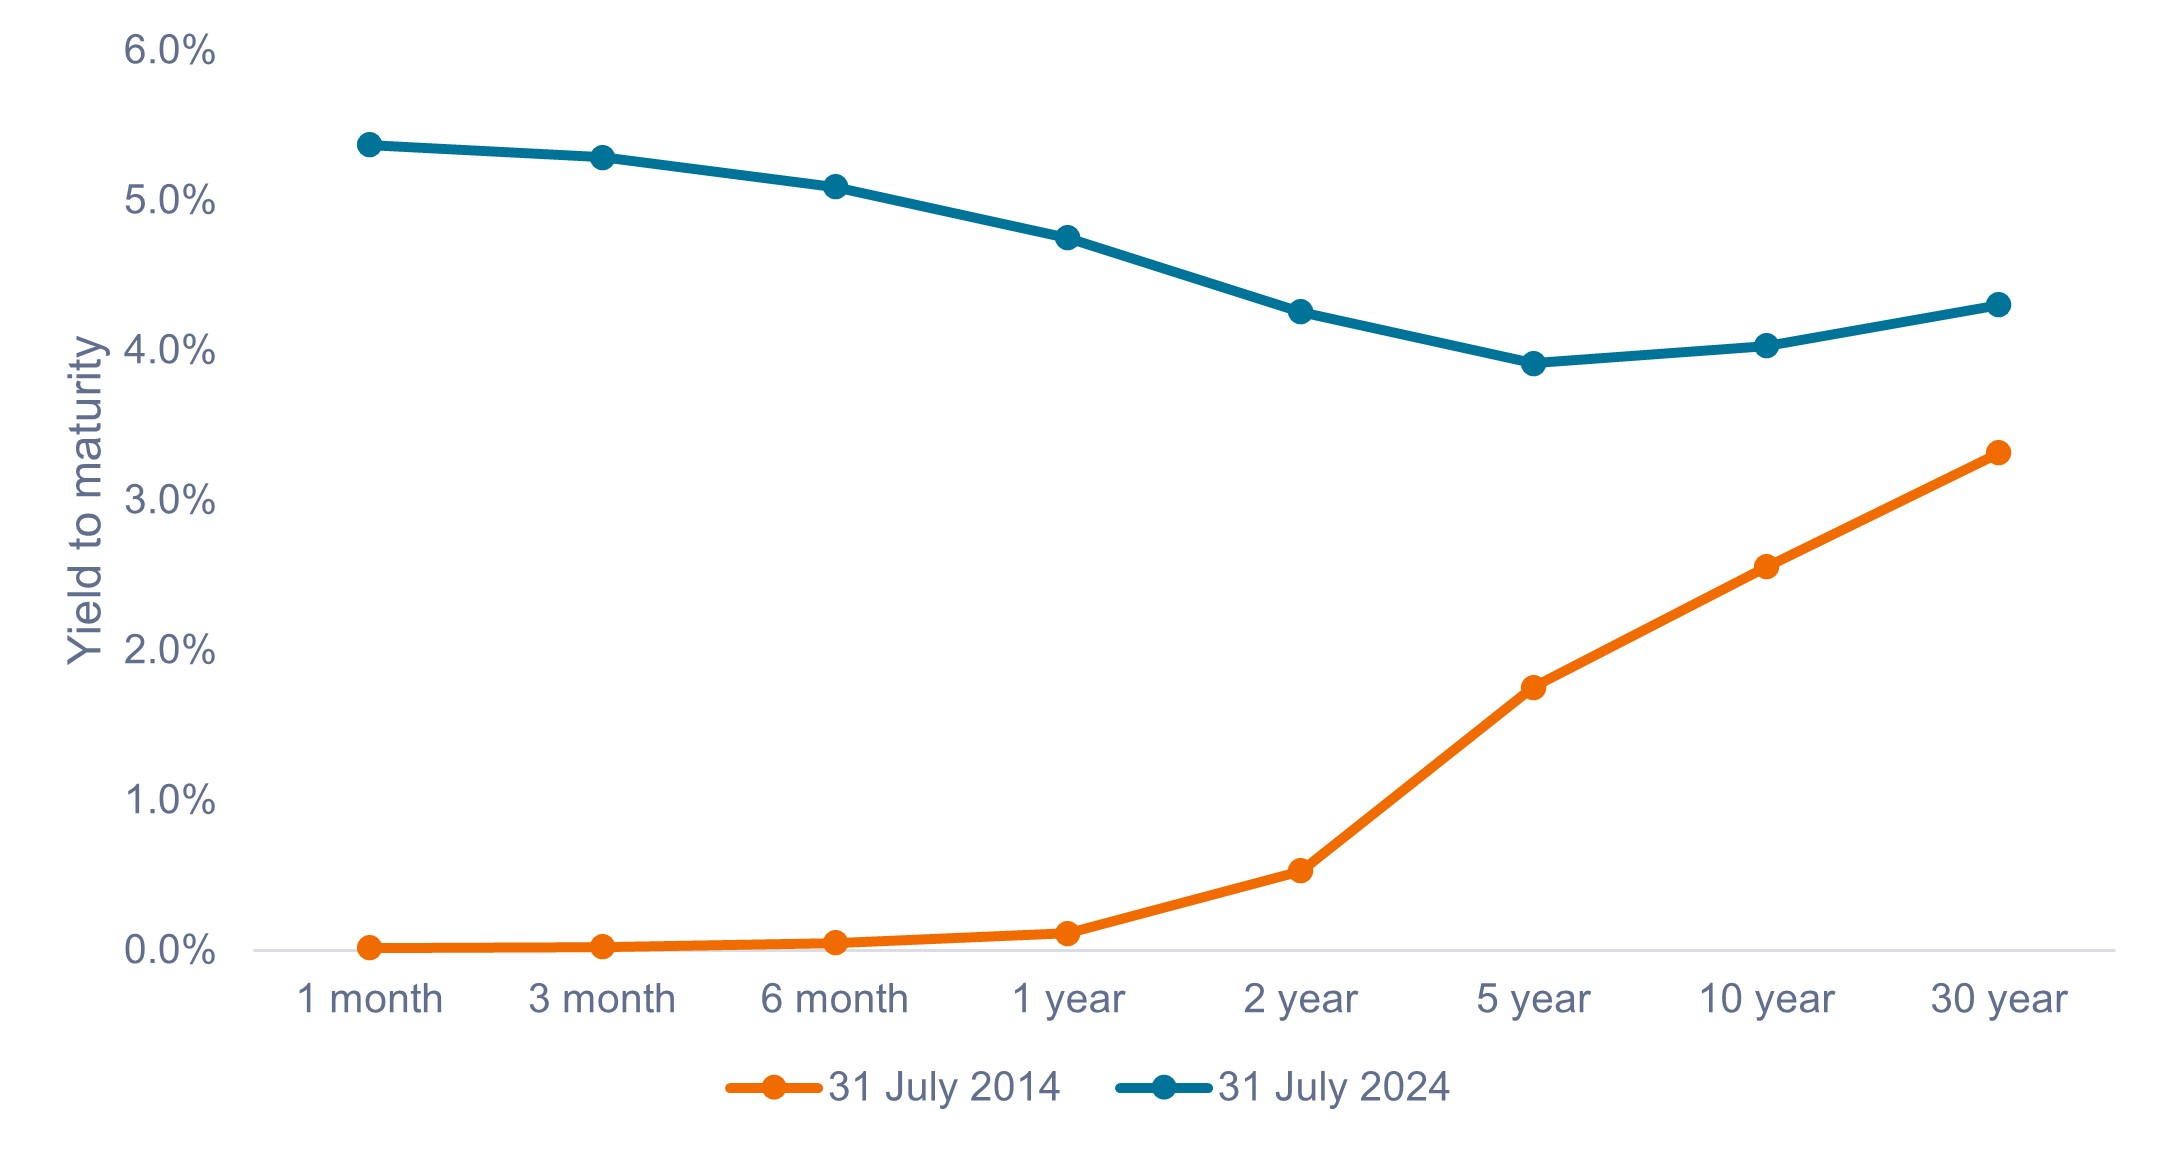
Exhibit 1 shows two Treasury yield curves at two points in time. The curve visually represents the yields an investor can earn from U.S. Treasury bonds of various maturities. The curve can either be upward sloping, meaning longer-maturity bonds pay higher yields (tangerine line), or it can be inverted, meaning shorter-maturity bonds pay higher yields (blue line).
Not only does the current shape of the yield curve matter, but anticipated changes to the curve due to changes in interest rates are a key consideration for investors.
Shifts in the curve can either be parallel or nonparallel. Parallel shifts entail the entire curve moving up or down in equal proportion. Nonparallel shifts result when bonds of differing maturities move to a greater degree than others, causing a change to both the overall position and slope of the curve.
These shifts have a meaningful impact on the prices of bonds at each maturity, both on an absolute basis and relative to one another. (Rising rates result in falling bond prices, and vice versa. Long-term bonds are more sensitive to changes in interest rates than shorter-dated bonds, all else equal.)
Active portfolio managers typically dedicate significant time and attention to managing yield curve exposure to maximize the yield earned, while also seeking to best position portfolios to profit from anticipated changes to the curve.
Exhibit 1: U.S. Treasury yield curves (31 July 2014 vs. 31 July 2024)
Fixed income returns are meaningfully impacted by changes to the overall level and shape of the yield curve.
 Source: Bloomberg, as of 31 July 2024.
Degrees of credit spread analysis
Most fixed income investors invest not only in government bonds – which are considered risk-free assets and contain a negligible amount of credit risk – but also in bonds that contain additional credit risk, such as corporate bonds. Investors are compensated for the supplementary risk by the credit spread.
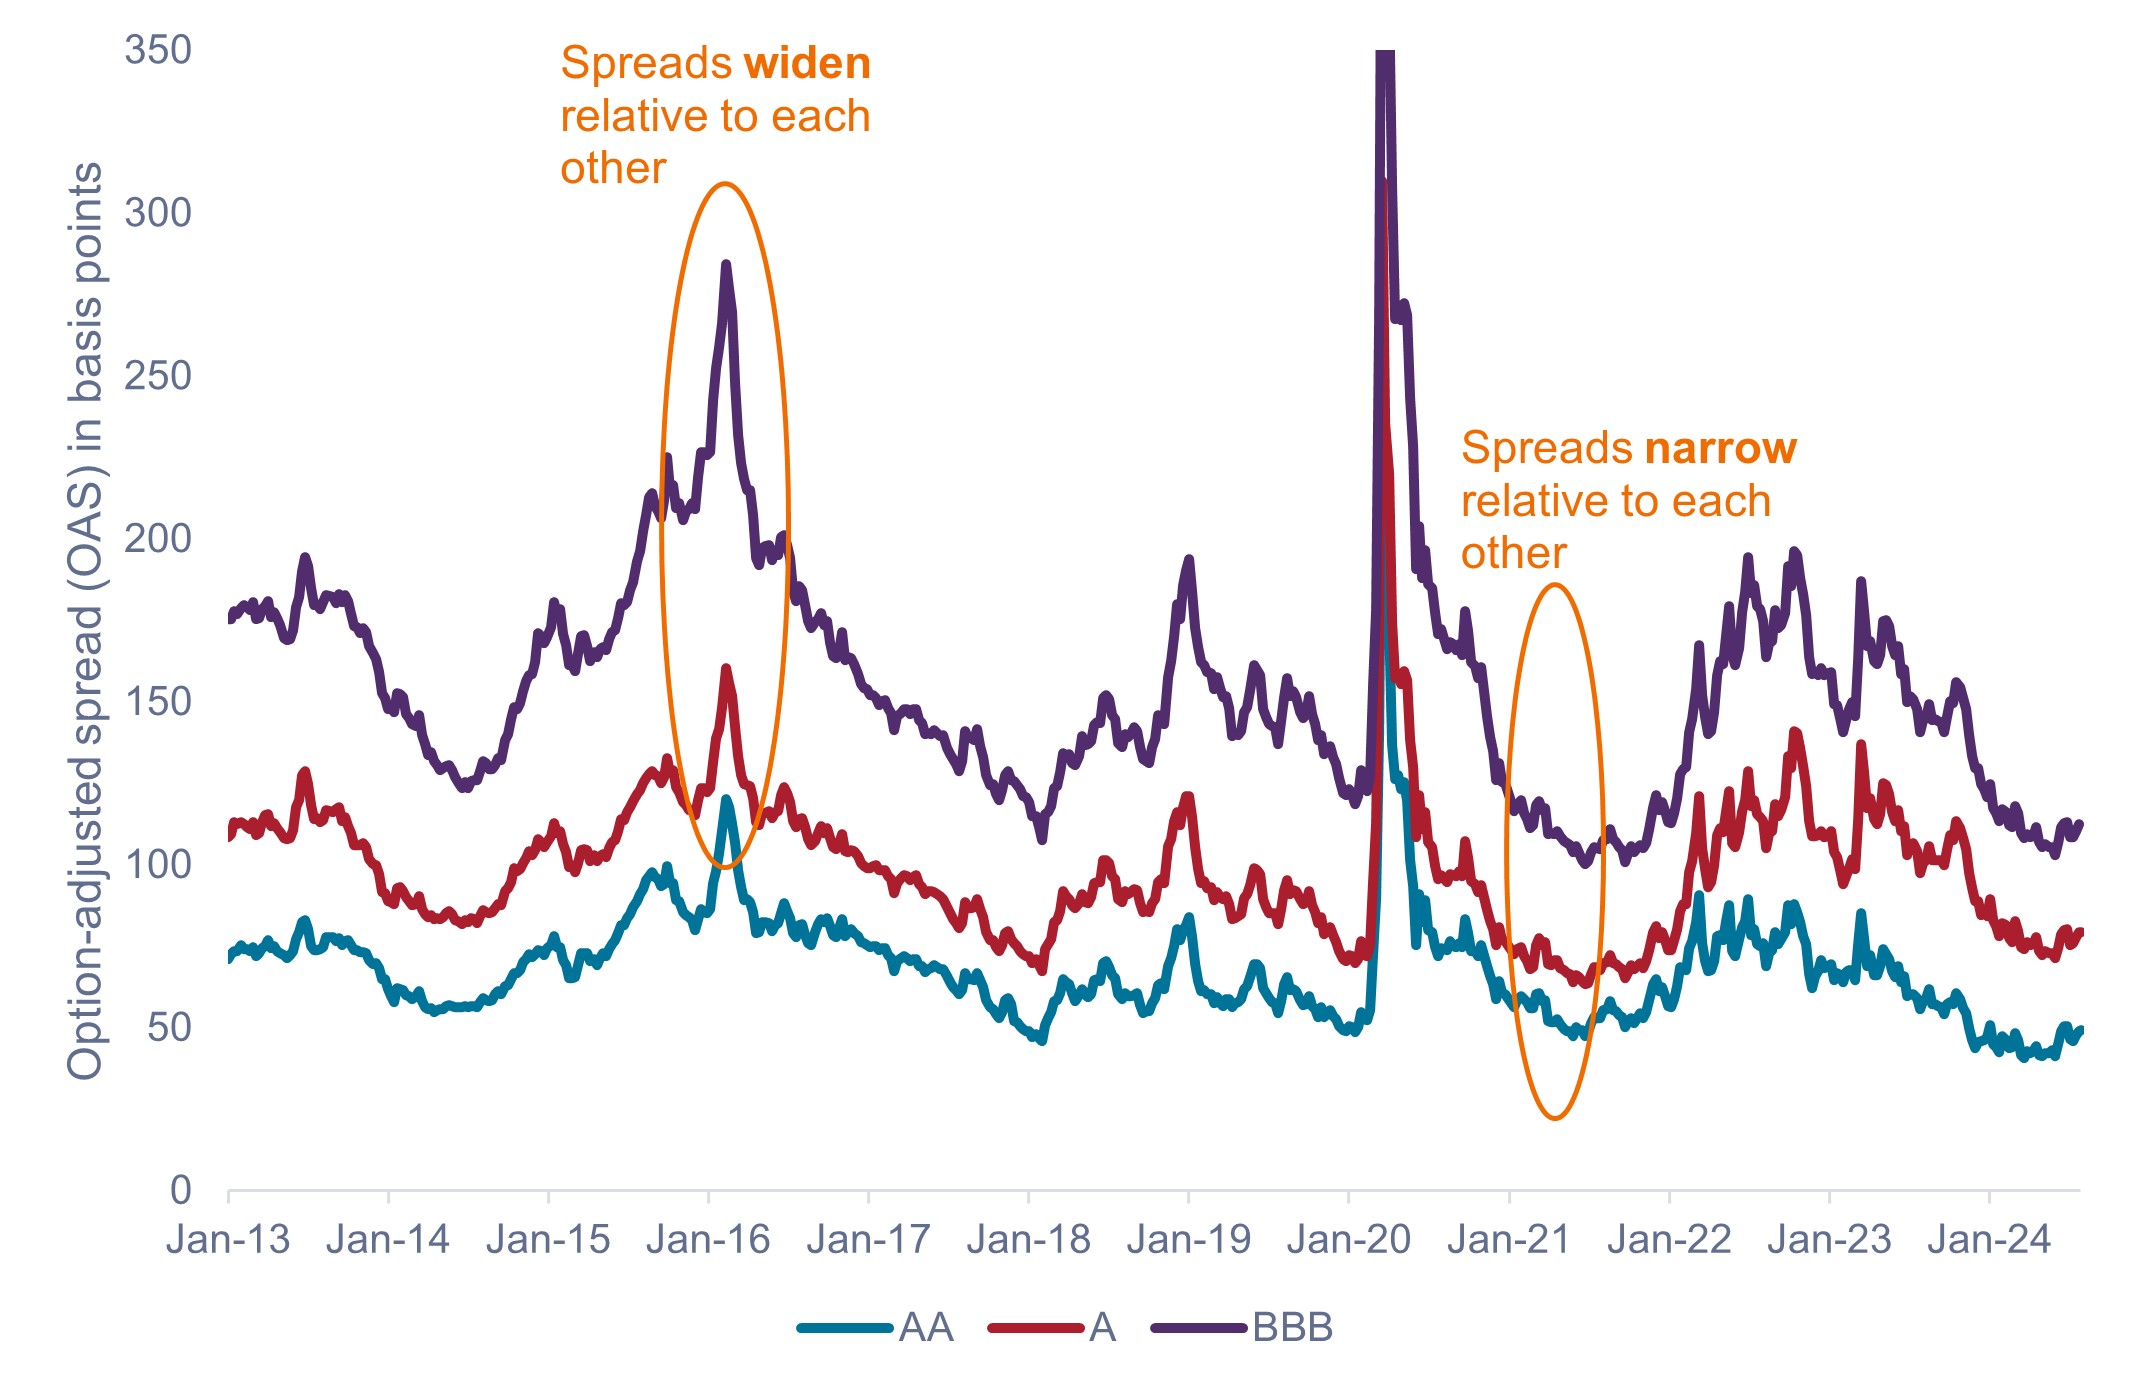
Typically, as credit risk increases, credit spread increases. As shown in Exhibit 2, BBB rated bonds yield more than A bonds, while A bonds yield more than AA bonds, and so on. Overall spread levels broadly rise and fall on factors such as changes in the macroeconomic environment, strengthening or weakening in corporate fundamentals, and changes in the supply and demand dynamics of the bond market.
Active managers will closely monitor these and other factors in relation to spread levels to determine how to best position their portfolios.
Exhibit 2: U.S. corporate credit spreads (Jan 2013 – July 2024)
Credit spreads are constantly in motion on an absolute and relative basis.
 Source: Bloomberg, as of 30 July 2024. AA, A, and BBB credit spreads represented by option-adjusted spreads (OAS) on Bloomberg AA, A, and BBB U.S. Corporate Bond Indices.
While spreads can rise and fall in aggregate, they can also fluctuate relative to one another. For example, BBB spreads widened much more than A or AA spreads in February 2016, a reflection that elevated default risk would affect lower-rated bonds to a greater degree due to a collapse in the oil price. At other times, the gap in spreads can narrow significantly on the back of strong economic growth, such as in early 2021.
It is up to the active manager to decide whether the move in spreads appropriately reflects the change in risk. Further, the difference in spreads takes place not only between different ratings buckets, but also on an industry, sector, subsector, and idiosyncratic (individual issuer) level.
Are spreads comparable over time?
While the option-adjusted spreads (OAS) in Exhibit 2 illustrate how spreads fluctuate over time, they do not consider how the nature of the Bloomberg U.S. Corporate Bond Index may have changed during that period. For example, between January 2013 and July 2024, the duration of the Bloomberg U.S. Corporate Bond Index fluctuated between a low of 6.5 years and a high of 8.8 years. Taking into account that bond spreads are impacted by duration, we believe investors should adjust for these changes.
In addition to duration, we believe variations in other factors such as credit ratings, industry composition, and average bond prices should also be accounted for. Janus Henderson has developed a proprietary model that adjusts for these differences, which we believe allows us to compare spreads more accurately over time.
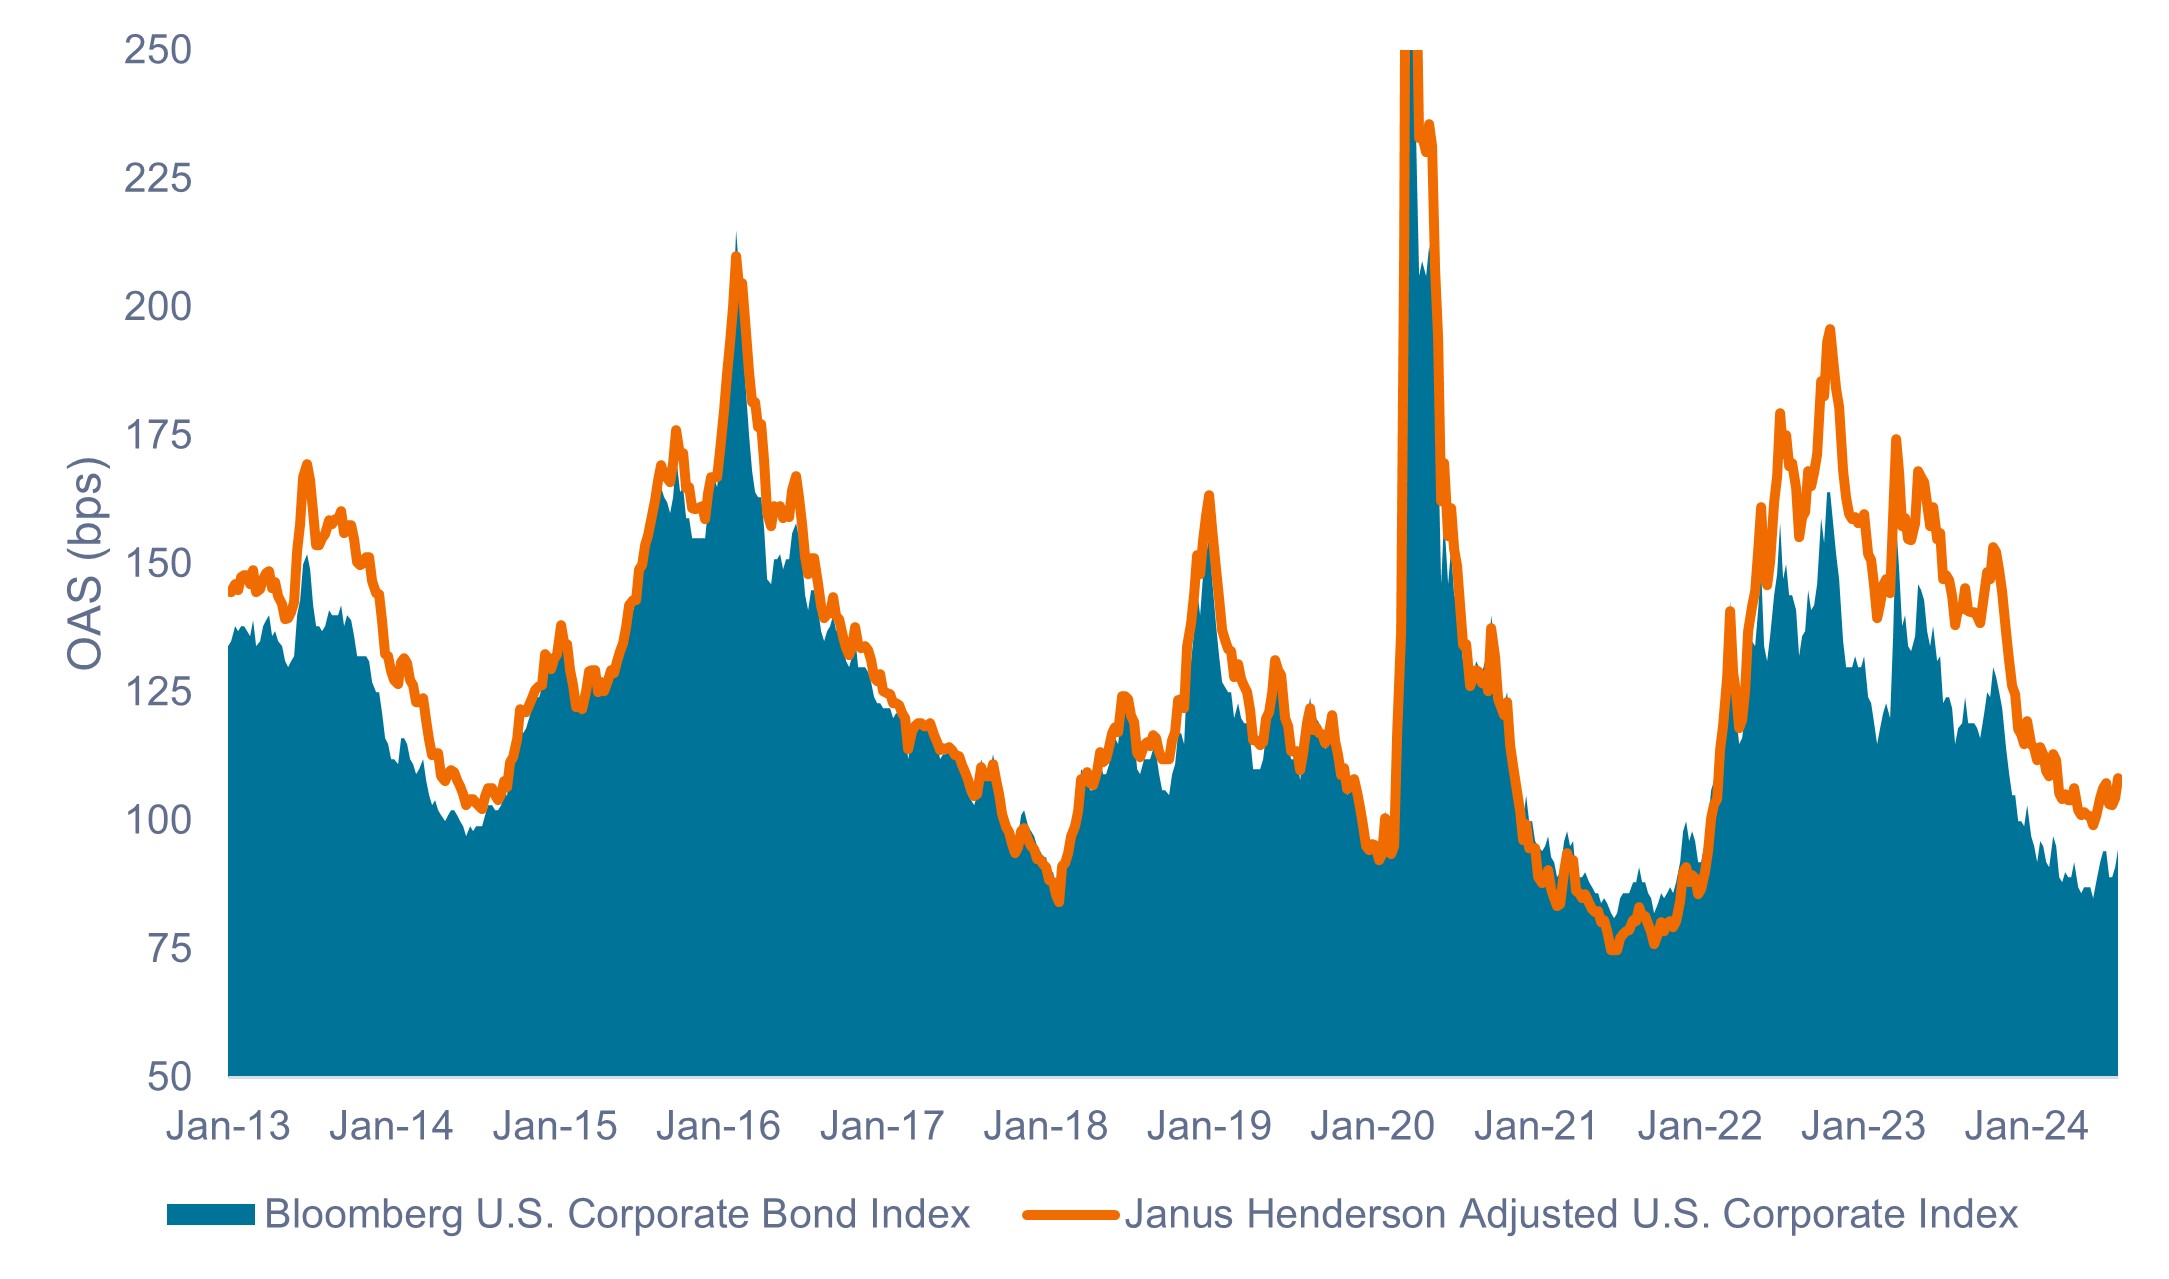
Exhibit 3 shows the Bloomberg U.S. Corporate Bond Index OAS versus the Janus Henderson Adjusted U.S. Corporate OAS. During certain periods there has been no material difference, but at other times the difference has been significant.
This is particularly important in the current environment, where adjusted spreads are over 12 basis points (bps) wider than the OAS of the index.1 This represents a 10% valuation differential and implies spreads are trading cheaper than they first appear (around the 44th percentile of their historical range versus the 33rd percentile).
Exhibit 3: Bloomberg U.S. Corporate Index OAS vs. Janus Henderson Adjusted OAS (Jan 2013 – July 2024)
Current credit spreads do not appear as tight after adjusting for changes to the index.
 Source: Bloomberg, Janus Henderson Investors, as of 26 July 2024.
Takeaways for investors
After adjusting for changes to the index, we believe corporate valuations do not look as rich as they might otherwise. And when considering the state of the economy, a dovish Federal Reserve, and strong corporate balance sheets, we think corporate spreads appear to be appropriately priced. Similarly, we believe market technicals and fundamentals support the current level of spreads.
Investors are faced with many moving variables when managing bond portfolios. While our analysis has focused solely on the U.S. corporate investment-grade bond market, we apply the same principles of deep quantitative and qualitative analysis to all sectors of the fixed income market.
When constructing multi-sector portfolios that include corporate, securitized, government, and global fixed income assets, we believe investors should look to active managers with a proven record of executing a research-driven approach.
1 As of 5 August 2024.
10-Year Treasury Yield is the interest rate on U.S. Treasury bonds that will mature 10 years from the date of purchase.
Basis point (bp) equals 1/100 of a percentage point. 1 bp = 0.01%, 100 bps = 1%.
Bloomberg U.S. Corporate Bond Index measures the investment grade, US dollar-denominated, fixed-rate, taxable corporate bond market.
Duration measures a bond price’s sensitivity to changes in interest rates. The longer a bond’s duration, the higher its sensitivity to changes in interest rates and vice versa.
Monetary tightening refers to central bank activity aimed at curbing inflation and slowing down growth in the economy by raising interest rates and reducing the supply of money.
Option-Adjusted Spread (OAS) measures the spread between a fixed-income security rate and the risk-free rate of return, which is adjusted to take into account an embedded option.
Price-to-Earnings (P/E) Ratio measures share price compared to earnings per share for a stock or stocks in a portfolio.
A yield curve plots the yields (interest rate) of bonds with equal credit quality but differing maturity dates. Typically bonds with longer maturities have higher yields.
IMPORTANT INFORMATION
Actively managed portfolios may fail to produce the intended results. No investment strategy can ensure a profit or eliminate the risk of loss.
Fixed income securities are subject to interest rate, inflation, credit and default risk. The bond market is volatile. As interest rates rise, bond prices usually fall, and vice versa. The return of principal is not guaranteed, and prices may decline if an issuer fails to make timely payments or its credit strength weakens.