
 Download White Paper
It’s been a brutal few months. With the market down some 20% of its all-time peak in mid-January, it is far from difficult to appreciate how those who question the risk/reward equation of equity investment might feel somewhat vindicated. Indices, when looked at in isolation, don’t paint a particularly accurate picture however. A purely one-dimensional analysis of this kind is fatally flawed for the simple reason that the index doesn’t deliver long-term investment returns – for that, one needs to look at the total return, of which a fundamental component is dividends.
Total return indices do exist but oddly, despite the fact that they deliver a much more reliable measure of overall investment returns, are not widely publicised. Unsurprisingly, on reviewing the performance of the FTSE 100 on a total return basis over the last 20 years, the picture looks markedly different. On 31st December 1999, the FTSE 100 Total Return Index stood at 12,447. On 9th March 2020, even after a 7.7% one-day fall, one of the largest ever, it stood at 22,144 – a 78% rise. Over 20 years, that equates to an average annual return of 3% – not overly impressive, but, unlike deposit investments, you would still have beaten inflation … and it’s certainly rather more comforting than a circa 20% loss. Clearly, it’s dividends that have come to the rescue.
Dividend yields and total returns – what are they and how do you calculate them?
A dividend is the distribution of a portion of a company’s earnings to its shareholders. A monetary amount per share, it is referred to as a dividend ‘yield’ when expressed as a percentage of the company’s share price – for example, a business with shares priced at £100 making a dividend payment of £5 is said to have a yield of 5%.
When deploying capital in order to optimise the utilisation of cashflow, a business proprietor will typically have five options:
- invest in existing operations
- acquire other businesses
- repay debt
- repurchase their own stock
- pay dividends.
They could, of course, simply leave surplus cash on the balance sheet, but a business seeking only to compound its cash is likely to see its longer-term growth prospects severely compromised. Shareholders clearly don’t invest in companies to be a deposit account over the long run, and will subject them to a return expectation somewhat higher than the prevailing savings rate. Dividend payouts are therefore a way of rewarding those long-term shareholders for the risk premium of holding a company’s equity.
Download to read on
Total return is a straightforward measure of the overall return from an investment – for shares, it comprises the combination of capital gains through increases in the share price with income gains through dividend payouts, and assumes that those dividends are reinvested. Again, a simple example may prove helpful.
You buy 100 shares at £10 per share; the initial value of your investment is therefore £1,000. If the company pays a 5% dividend, you’ll receive £50, enabling you to acquire five additional shares. 12 months later, the share price rises from £10 to £11.
Based solely on the share price, your return is 10%. However, you now own 105 shares, meaning your investment is valued at £1,155 or 15.5% more than you paid for it. That percentage represents your total return. In order to calculate your total return over any given period of time, simply take your total investment gains (in our example, £155), divide it by the original value of the investment (£1,000), and multiply by 100 to convert it to a percentage.
Reinvesting dividends to buy more shares enables you to benefit from the effects of compounding … or what Einstein called the “eighth wonder of the world“.
The appeal of dividend income
Understandably, many investors are attracted to income-paying stocks simply because they have a basic need for the yield, particularly in a period of record low interest rates – retirees would be the obvious example. Whilst not as reliable as fixed income investments such as bonds, dividend-producing stocks can be quite valuable in this regard. An obvious consequence of this, however, is that the investment power of dividend-paying stocks has been overlooked, almost to the point where they might be considered boring, despite the fact that the effect of dividends on equity portfolio returns has not diminished for decades, even centuries.
In the mid-1990s, Ronseal – a UK wood-stain and wood-dye manufacturer – became famous for its television advertising, and particularly for its slogan – “It does exactly what it says on the tin” – to the extent that it became a common idiomatic phrase, meaning that the name of something is an accurate, rather than a grandiose or overstated, description of its attributes. In that sense, dividend-paying stocks are the Ronseal of the investment world. Arguably boring they may be in the short-term but, when their contribution to long-term real returns is fully appreciated, coupled with their ability to mitigate the effects of both inflation and challenging markets, they’re bordering on the sexy!
Let’s examine the appeal of dividend payers a little more closely.
First, dividends are paid from real earnings in hard cash and, as such, are a matter of fact not conjecture. Put bluntly, companies that pay dividends are less likely to be indulging in ‘creative accounting’. Management teams can be highly adept at making earnings look good but, with a bi-annual dividend obligation to meet, sleight of hand of that kind becomes rather more challenging. Dividends are overt, very public promises. Breaking those promises is embarrassing to management, damaging to share prices and largely seen as an admission of failure.
Second, the payment of dividends is one of the most compelling ways for companies to promote their financial well-being and to send a potent message about future prospects and performance. A willingness – and ability – to maintain and grow dividends over time provides clear evidence of strong fundamentals, solid business plans, and a deep commitment to shareholder value.
Moreover, companies with a solid track record of dividend payment are likely to be run by focused management teams that are adept at optimising their deployment of free cash flow, leaving little room for vanity projects and frivolous undertakings. Dividends can therefore serve as a useful barometer when looking to identify well-run, profitable businesses that are both disciplined and efficient in their allocation of capital, and therefore likely to prosper in the future. Before corporations were required by legislation to disclose key aspects of their financial information in the 1930s, a company’s ability to pay dividends was one of the few manifest signs of its financial strength; it is unsurprising that it remains a persuasive indicator today.
Third, dividends can fulfil a critical role as a ‘bear market protector’ or cushion when, as we’ve seen, markets are in decline, or when they are stagnant because valuations are elevated and the upside potential is limited. This has been the case on many occasions, and often for protracted periods: for the first 15 years of this century, the Nasdaq Composite Index didn’t gain a single point for example.
The contribution of dividends to total returns fluctuates over time of course. The analysis below of the widely-followed US large cap barometer, the Standard & Poors 500 Index (S&P 500) from 1930 to 2019, conducted by US-based asset manager Hartford Funds, shows that for the period as a whole, the divided contribution averaged 42% which equates to 1.8% per annum on an annualised basis. Looking at the decades discretely, however, illustrates the extent to which that contribution to total return varies.
[caption id=”attachment_319212″ align=”alignnone” width=”640″]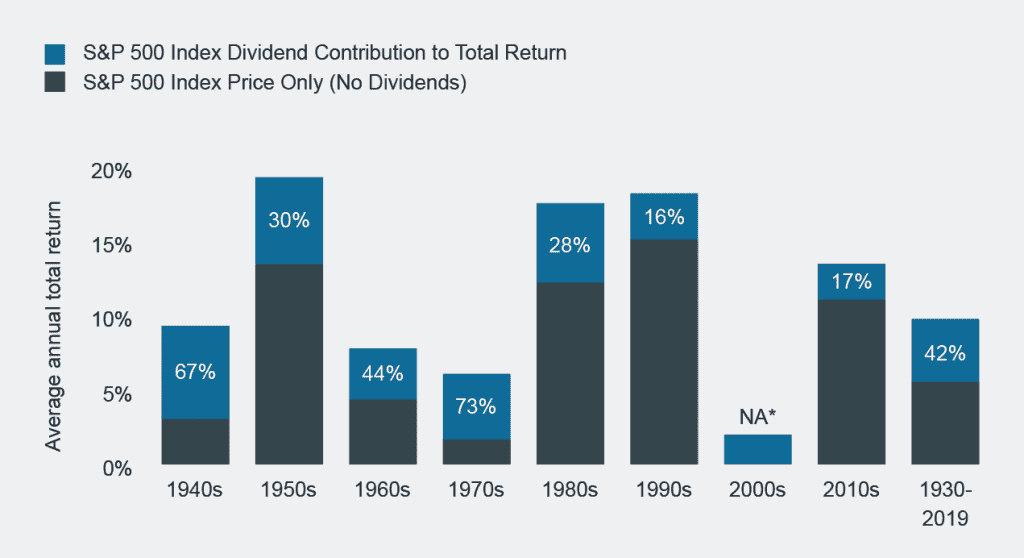 Source: Morningstar/Hartford Funds, 02/2020. S&P 500 Index is a market capitalisation weighted price index composed of 500 widely held shares. *Total return for the S&P 500 Index was negative for the 2000s. Dividends provided a 1.8% annualised return over the decade.[/caption]
During the 1940s, ’60s and ’70s – decades in which total returns were lower than 10% – dividends played a significant role in terms of their contribution, but played a smaller role during the 1950s, ’80s and ’90s when total returns were well into double figures.
During the 1990s, dividends were de-emphasised as companies chose to deploy capital by reinvesting into their businesses rather than by returning it to shareholders. From 2000 to 2009, a period commonly referred to as ‘the lost decade’[3], the S&P 500 delivered a negative return, primarily a consequence of the bursting of the dotcom bubble in March 2000.
Do dividend payers outperform?
Finally, there is a solid body of empirical evidence which confirms a linear correlation between dividend paying shares and market outperformance. Wellington Management, a substantial US-based asset management firm, recently conducted an analysis, again of the S&P 500 from 1930 to 2019. It began by dividing companies into quintiles according to their level of dividend payouts: the first quintile, ie the top 20%, comprised the highest dividend payers whilst the bottom quintile comprised the lowest payers. As the table below reveals, the study found an unambiguous correlation between those paying higher levels of dividends with the ability to beat the index overall in each of the nine decades analysed.
[caption id=”attachment_319225″ align=”alignnone” width=”640″]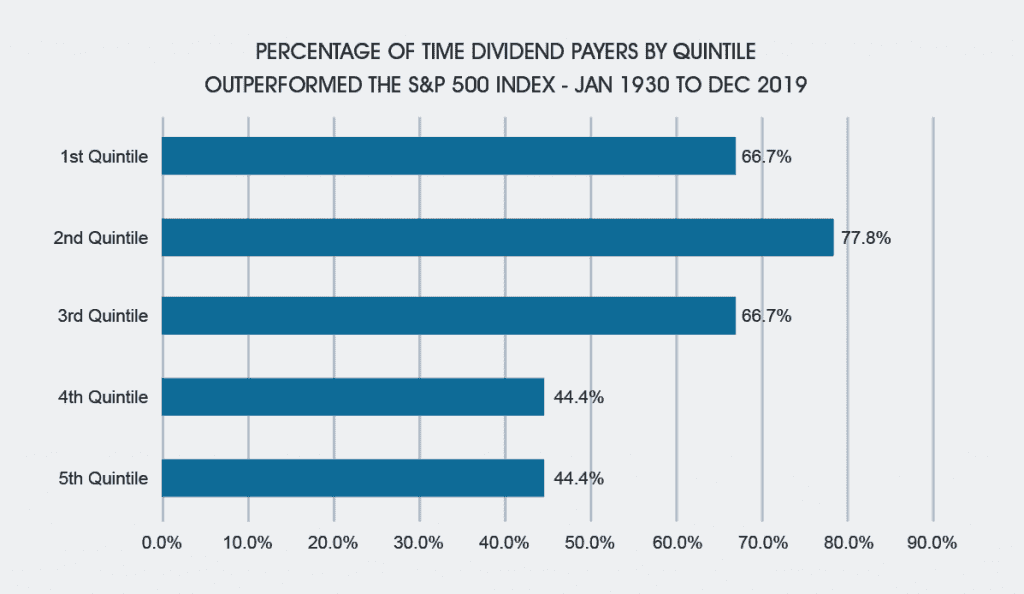 Source: Wellington Management and Hartford Funds, 02/2020. S&P 500 Index is a market capitalisation weighted price index composed of 500 widely held shares.[/caption]
There is a twist in the tale however. As is shown, the companies paying the highest levels of dividends did not outperform those paying high, but not the very highest, dividends. Whilst this may at first sight appear counter-intuitive, given that the ability to pay a generous dividend is regarded as a reliable indicator of financial health, the explanation lies in the word ‘ability’. A likely explanation for the second quintile companies topping the table is because the first quintile’s very high dividend payouts may not always have been sustainable.
Yield, if looked at in isolation, can be misleading. Some companies continue to pay yields even when their financial position is precarious while other companies pay out yields too aggressively and fail to reinvest sufficient profit to sustain their operations. A high dividend yield might simply be indicative of an ailing business with a depressed share price. Dividend coverage is therefore used as a reliable measure of a business’s ability to cover its dividend obligations, and is calculated as earnings per share divided by the dividend per share. When the ratio is above 2, investors can feel reasonably confident; below 1.5, concerns start to emerge; below 1, the company is using retained earnings from the previous year to pay this year’s dividend – the odds are good that there will be a dividend cut, which can have a dire impact on the company’s valuation.
To pay or not to pay
Not all companies pay dividends of course. Typically, mature, profitable companies do so whilst ‘growth’ businesses often do not, choosing instead to retain profits and reinvest them into the business. Microsoft represents a good example of the relationship between dividend policy and corporate lifecycle. When Bill Gates’s brainchild was in its infancy, it paid no dividends but retained cash to fund future growth. It eventually reached a point where it could no longer grow at the same meteoric rate it had achieved for so many years and began to use dividends and share buybacks as a means of rewarding shareholders.
A plan was announced in July 2004[4], some 18 years after the company’s initial public offering, to put nearly $75 billion worth of value into the pockets of investors through:
- a new 8% quarterly dividend
- a special $3 one-off dividend
- a $30 billion share buyback programme over four years.
In 2019, the company is still paying a dividend.
The acceleration effect
One phenomenon that’s often overlooked is what has become known as the ‘total return accelerator’. If a company maintains its dividend despite a fall in its share price, a subsequent reinvestment of that dividend purchases more shares than it would have done had the share price not declined. This combination of dividend distribution, and reinvestment at a more attractive valuation, represents a highly effective way to build capital, particularly when one bears in mind that investors buy dividend stocks for the income, and are less likely to flee the market during periodic market downturns, even during crashes such as we saw in 2000 and 2008. It’s essentially a ‘back to the future’ investment strategy: when share prices bounce back, you make a greater total return – hence the reference to ‘acceleration’.
To be effective, however, investors must be able to:
- hold for the long term, avoiding the temptation to sell by focusing more on the inflows of dividend income than the short-term fluctuations in share prices
- identify high quality businesses that are well-positioned to generate sustainable cash flows through a variety of market conditions, and thereby maintaining a disciplined approach to dividend policy.
The quantum of total returns
The superior performance of equities over both bonds and cash – over the long term – is well-known. The Barclays Equity Gilt Study, which was published in April 2019, shows the nominal performance of £100 invested in cash, bonds or equities (the UK All-Share Index) between 1899 and 2018: cash would be worth just over £20,000 today; if invested in gilts, the same £100 would be worth close to £42,000; however, £100 invested in equities in 1899 would now be worth around £2.7m, manifestly evidencing what excellent long-term investments shares have been.
What is less well-appreciated, however, is the degree to which that impressive outperformance has been driven by the relentless power of the dividend component. In short, income is crucial. If the contribution of the dividend component is stripped out, the Barclays study reveals that the value falls dramatically to under £20,000 – less than 1% of the amount with income reinvested. Dividend reinvestment to buy more shares enables you to benefit from the effects of compounding … or what Einstein called the “eighth wonder of the world“.
Two investment trusts within the Janus Henderson stable have been particularly successful in utilising dividend income to bolster returns for investors: The City Of London Investment Trust and The Henderson Smaller Companies Investment Trust.
The City of London inhabits even more exalted territory – those trusts which have increased their dividends for at least 50 years, an astonishing feat given the ever-present market turbulence that assert managers have been forced to confront over the years. Indeed, only four trusts – just over 1% of the investment trust universe – can lay claim to this accomplishment. Job Curtis, fund manager of City of London, is quick to emphasise that the trust could not have achieved its 54 years of continuous dividend growth without taking advantage of a unique facility available to the closed-ended structure: income reserving. Unlike their open-ended counterparts, investment trusts can retain up to 15% of any income they generate each year, enabling them to ‘stockpile’ income in good years in order to compensate for shortfalls in more challenging ones, thereby strengthening their ability to provide investors with dependable dividend growth.
In the 28 years that Curtis has managed the trust, he has made use of its revenue reserve on seven occasions – one year in four. He points out that even major global enterprises can encounter significant difficulties, BP’s suspension of its dividend in the wake of the 2010 Deepwater Horizon oil disaster being a good example.
Henderson Smaller Companies also focuses on UK-quoted companies but, as the name suggests, invests in small cap businesses – defined as those below £1.3 bn capitalisation – that are perceived to be on a growth trajectory. Neil Hermon, the trust’s manager for some 18 years, considers two factors relevant to dividend performance to be of particular importance when stock-picking: first, the strength of the balance sheet and the cashflow characteristics and, second, earnings momentum, ie the ability to grow earnings strongly into the future.
In conclusion
For those seeking long-term, inflation-beating returns, stock market investment represents one of the most accessible and compelling avenues. Dividend investing specifically is not new but, latterly, has fallen out of favour as a strategy despite the fact that dividends have historically played a significant role in total returns and that dividend-paying companies have tended to outperform their non-paying counterparts.
We believe that dividend investing – focusing on businesses with good income coverage, strong track records and solid prospects for rising payouts – will continue to move back into the investment limelight and offers the potential for excellent value.
We should perhaps leave the final word to John D Rockefeller who, as the wealthiest American of all time and the richest person in modern history, knew a thing or two about stock market investment[7]:
[caption id=”attachment_319248″ align=”alignnone” width=”979″]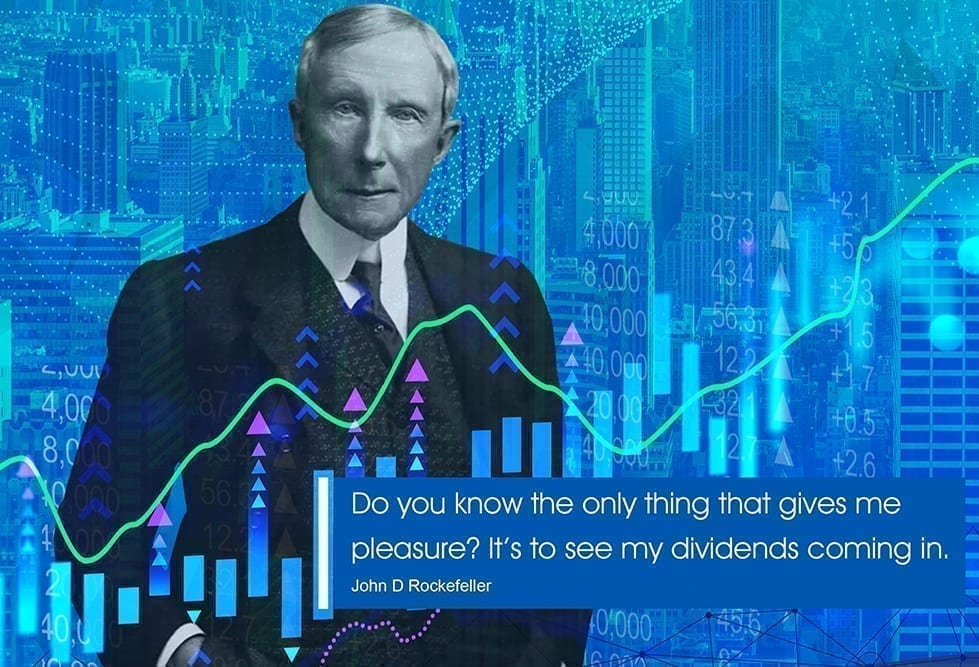 Image of ‘John D Rockefeller’ by Ddokhanian is licensed under CC BY-SA 4.0[/caption]
Glossary
Bear market
A financial market in which the prices of securities are falling. A generally accepted definition is a fall of 20% or more in an index over at least a two-month period. The opposite of a bull market.
Bottom-up
Bottom-up fund managers build portfolios by focusing on the analysis of individual securities, in order to identify the best opportunities in their industry or country/region. They may also consider economic and asset allocation issues, known as top-down factors, but these are not of primary importance.
Dividend
A payment made by a company to its shareholders. The amount is variable, and is paid as a portion of the company’s profits.
Share buybacks
The repurchase of shares by a company, thereby reducing the number of shares outstanding. This gives existing shareholders a larger percentage ownership of the company. It typically signals the company’s optimism about the future and a possible undervaluation of the company’s equity.
Total Return
Total return, when measuring performance, is the actual rate of return of an investment or a pool of investments over a given evaluation period. Total return includes interest, capital gains, dividends and distributions realised over a given period of time.
Yield
The level of income on a security, typically expressed as a percentage rate. For equities, a common measure is the dividend yield, which divides recent dividend payments for each share by the share price. For a bond, this is calculated as the coupon payment divided by the current bond price.
Sources
[1] Source: B Graham, The Intelligent Investor, 1949
[2] Source: FTSE 100 Index
[3] Source: S&P 500 Index
[5] Source: AIC/Morningstar
[6] Source: Henderson Smaller Companies Limited, Annual Report 2020
[7] Source: Forbes, Retire Rich Like Rockefeller, June 2017