Investment Outlook 2022
TEST2 migration: Fixed Income: The last hurrah
 Jim Cielinski, CFA Global Head of Fixed Income
Investment Outlook 2022
TEST2 migration: Fixed Income: The last hurrah
- Jim Cielinski, CFA Global Head of Fixed Income
The lagged impact of policy stimulus should drive elevated earnings and inflation, but as 2022 progresses a more familiar picture will likely emerge. Jim Cielinski, Global Head of Fixed Income, believes it may be too soon to discard what has gone before.
KEY TAKEAWAYS
- The debate surrounding the direction of inflation is likely to dominate markets in early 2022, stoking fears of an overheating economy.
- Yet there are plenty of factors to suggest central banks are correct to take a gradual approach to removing monetary policy accommodation.
- Ultimately, we see a manageable rise in bond yields, with some of the disinflationary forces beginning to reassert themselves as distortions in the global economy start to ease.
“Things will probably get worse before they get better.” Such is the common refrain of parents to worried children or doctors to concerned patients. It is also the likely near-term prognosis for inflation. Dealing with COVID-19 created acceptably higher norms for monetary and fiscal policy accommodation and the past stimulative action is still filtering through the economy, buoying corporate earnings and asset prices. The US Federal Reserve (Fed) announced in November it will taper (reduce) its asset purchases. Yet, tapering is not tightening. It is just being less accommodative. This might sound like semantics, but it is important because it implies that the Fed still believes support is needed for the economy to reach both its average inflation and full employment goals. Should we worry that the Fed may be making a policy mistake and its view that higher inflation is transitory (central bank jargon for temporary) is wrong?
Inflation: the power of three
For inflation to be more permanent requires three key factors. First, closing the output gap. This is the difference between what the economy is currently producing and what it has the long-term potential to produce efficiently. A negative output gap indicates spare capacity (slack) in the economy. A positive output gap occurs when the economy is growing above trend and demand is very high, contributing to inflation. On this score, we do appear to be entering an inflationary period (Figure 1). The caveat is that output gaps are difficult to predict accurately.
Figure 1: US economic growth looks set to exceed its potential
 Source: Bloomberg, Congressional Budget Office, 31 December 1971 to 31 December 2031, as of 5 November 2021. Figures beyond 2020 are estimates and are not guaranteed.
Second, we need to see higher wages. Wage pressures are evident although it is proving hard to disentangle COVID distortions from longer-term trends. Participation rates (workers willing to work as a percentage of the workforce) seem to have fallen as some older workers have opted to retire early (partly aided by buoyant asset markets on pension pots) or health concerns are discouraging them from working. Wages for lower paid workers and minimum wages have increased, and this could encourage workers in higher salary tiers to demand higher wages to maintain pay differentials. If, as we suspect, commodity prices subside, this should help to lower inflation rates next year and potentially dampen wage bargaining rounds. Where we have some concerns is the cost of housing. Tenants’ and owners’ equivalent rents constitute around 40% of US Core CPI1 and we expect inflation here to remain elevated into 2022. The composition of growth and inflation will also be an interesting dynamic in 2022 as spending is expected to move towards services and away from goods. Service sector inflation tends to be stickier than goods inflation. When was the last time your hairdresser offered you a price cut? Third, private sector credit creation needs to pick up. By this, we mean more ebullient consumers need to increase borrowing. With more money sloshing around the economy, this can lift prices through the money multiplier effect as banks re-lend deposited money. On this score, private sector credit demand does not seem elevated. In the US, consumer credit grew at an annual rate of 5.6% in the third quarter of 2021; this compares with annual growth of 4.6% in 2019, so hardly a blistering uptick.2 In China, credit growth is weak as authorities crack down on debt growth, while in Europe, credit growth is consistent with recent years (Figure 2).
Figure 2: Eurozone credit creation is far from excessive

Source: Refinitiv Datastream, European Central Bank, Eurozone bank loans to private sector (adjusted), % change from 6 months ago; ECB Bank lending Survey Credit Demand Indicator (last quarter), 31 January 2005 to 31 October 2021.
Taken together, we think inflation will subside later in 2022, not least because inflation can sow the seeds of its own demise if it acts as a tax on consumers, curtailing demand. It also hurts the less wealthy households (who have a higher marginal propensity to consume) more than the (asset) rich. Moreover, there exist some oddities of the last 18 months, which, as they wash through the system, we believe should bring inflation back down.
Imaginary numbers and rate expectations
Set the bar low and it is easy to beat it. There was a huge rebound in corporate earnings in 2021 as vaccine rollouts galvanised the economic recovery but earnings and economic growth are both set to slow in 2022, if only from harder year-on-year comparisons. Lockdown-induced supply chain imbalances (eg, container ships in the wrong ports, lack of microchips, short-staffed logistics and hospitality businesses) are still present but over 2022 we expect the pieces of the jigsaw to slowly reassemble. For now, the inflation risks look tilted to the upside, but should the inventory building by companies not reach customers swiftly enough, it may lead to product overhangs. Consumers were also boosted by the temporary wealth increase from pandemic-related forced savings and government special payments, but wealth increases are typically less effective than increases in income at altering long-term spending patterns. If so, buoyant retail sales could start to come under pressure as personal income levels revert to trend (Figure 3). Personal savings levels are also moving back to trend levels. A key test for corporate credits in 2022 will be identifying those cash flows that were temporarily buoyed by these effects.
Figure 3: Robust consumer demand could wane
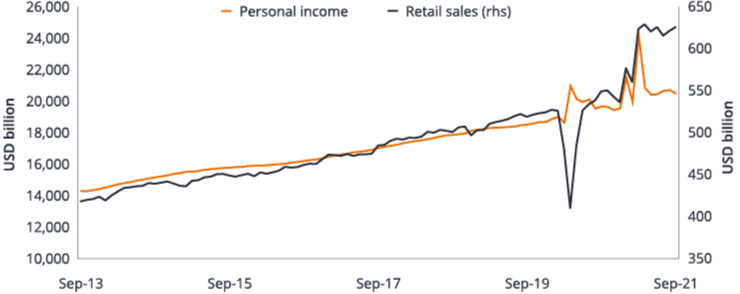
Source: Bloomberg, Bureau of Economic Analysis, US personal income, total seasonally adjusted annual rate, USD billions; US Census Bureau, US retail and food services sales, total seasonally adjusted, monthly amount, USD billions, September 2013 to September 2021.
So, the market may be exaggerating tightening fears. Remember the last time the US Fed tapered, it concluded in October 2014, but the first interest rate hike did not occur until December 2015 and rates then stayed on hold for a year (Figure 4). If inflation shows signs of subsiding by summer, we could be in for a similarly moderate tightening episode – for 2022 at least. Beyond the US, the European Central Bank’s President Christine Lagarde has already pushed back against the prospect of raising its policy interest rate in 2022. Memories of the premature hikes of 2011 enacted by then-ECB President Jean-Claude Trichet, which contributed to a stalling of recovery in Europe, may still linger.
Figure 4: Tapering need not mean imminent rate hikes
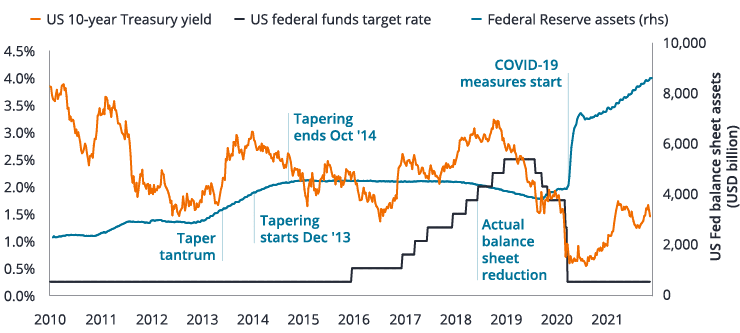 Source: Refinitiv Datastream, US Federal Funds Target Rate (current range 0.00-0.25%), US Benchmark 10-year government bond (redemption yield %), Federal Reserve Total Assets on balance sheet (USD billions), 1 January 2010 to 5 November 2021. Past performance is not a guide to future performance.
Tug of War: demand for income meets policy inflection
To disagree with the Fed and ECB’s relatively sanguine view on inflation would mean believing we are on a completely different path to that which preceded COVID. Markets have been notorious for overestimating hike paths over the last couple of decades, although we think the Fed and the ECB have become better recently at communicating the likely policy path. We believe the disinflationary and deflationary forces of technology and digitalisation remain intact while repaired trade links will reignite global competition and efficiencies. If anything, COVID disruption may have helped elongate the mid-cycle phase of the economic and credit cycles. For credit investors, this mid-cycle environment is likely to extend some of the characteristics of 2021 into 2022. We expect companies to continue to repair balance sheets and for the high yield default rate (the proportion of companies failing to meet repayments to bondholders) to remain subdued. Exceptions may lie in China where stresses in property could be ongoing as the sector adjusts to more prescriptive debt permissions. Given we are not anticipating a big adjustment higher in bond yields, investors will continue to seek out yield. This should be supportive of high yield, which is also helped by its greater sensitivity to corporate conditions. We expect improving corporate fundamentals to see more high yield issuers transition to investment grade, although 2022 is also likely to see greater performance dispersion as the inflection in policy leads investors to pay greater attention to debt levels. Relatively low spreads mean investment grade bonds are likely to find their performance dictated more by moves in interest rate markets.
Figure 5: Credit spreads are close to their historical tights
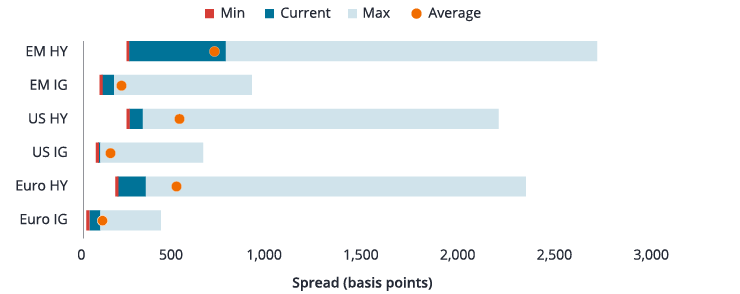
Source: Bloomberg, ICE BofA Bond indices. Credit spread is option-adjusted spread over government bond yield. Minimum, average and maximum spread, plus current spread (9 November 2021) over 20 years to 9 November 2021.
EM = emerging markets, HY = high yield, IG = investment grade. Basis point (bp) equals 1/100 of a percentage point. 1 bp = 0.01%, 100 bps = 1%.
The tightening in spreads has been ubiquitous. Mortgage- and asset-backed securities have witnessed similar fundamental improvement, offering a blend of income in conjunction with lower leverage. Many sectors of the mortgage market, having been the source of the Global Financial Crisis in 2008, have been in repair mode for more than a decade.
Higher bond yields: potentially no bad thing
The relatively high headline inflation figures anticipated in early 2022 means we are likely to hold onto the rise in bond yields seen in the late half of 2021. Somewhat higher bond yields may be no bad thing. A gentle creep higher is manageable, offering opportunities for reinvestment at higher yields. Insurers, banks and pension funds would likely benefit. In fact, the recent uptick in bond yields, together with higher equity prices, might lead to higher demand for bonds from pension funds in 2022. This is because as the funding gap between the assets of a pension fund and its liabilities (amount needed to pay out expected lifetime payments to retirees) shrinks, there is a growing incentive for pension funds to lock in the matched liabilities. Typically, this involves buying more bonds, given that they have less capital volatility. This comes at a time when the supply of bonds in some areas may diminish. Economic recovery means government revenues should remain on an improving path. As such, we expect most governments (absent another shock) to borrow less in 2022. The International Monetary Fund projects net government borrowing to fall from 10% of GDP of developed economies in 2021 to 5.4% in 2022.4 Those who are cynical about the true extent of central bank independence might note how less net government bond issuance coincides with the reduction in central bank asset purchase programmes. Regardless, less supply could stymie upward pressure on government bond yields from the absence or reduced presence of central bank net purchases. Where we do see supply rising in 2022 is among labelled bonds. By this we mean bonds linked to environmental, social and governance (ESG) factors. This is an area with momentum as consumers, clients and governments demand action to improve the environment, tackle inequalities and promote good corporate governance. ESG commitments will require a lot of financing, and fixed income has a role to play in meeting the gap. Bonds bring forward expenditure by providing immediate financing that is paid back over time, making them a useful capital-funding vehicle for transformative long-term projects.
Inflation: the early spike should fade
Where inflation levels out at is important as it can impact the desire to hold bonds not just at a return level but at a diversification level. Figure 6 demonstrates that when inflation is lower (below 3%) there is typically a positive correlation between US government bond yields and US equities. As bond prices typically move in the opposite direction to bond yields, diversification benefits are more prevalent in a low inflation environment where bond yields fall and prices rise at the same time that equities fall.
Figure 6: Low inflation era is good for asset diversification
Core CPI inflation and correlation between S&P 500® Index and US 10-year government bond yield
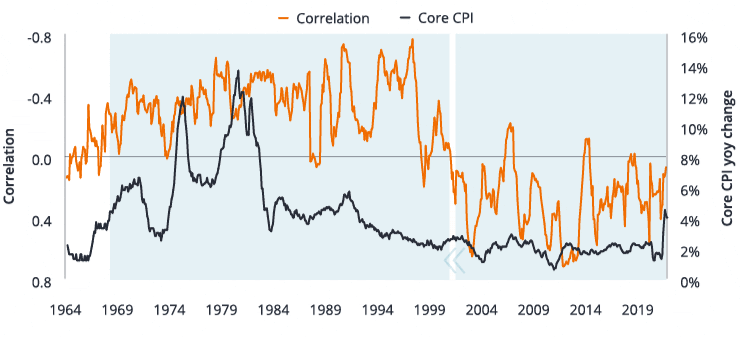
Source: Bloomberg, Deutsche Bank, Core CPI inflation (all items less food and energy), year-on-year percentage change, monthly datapoints; Correlation between S&P 500 Index and US government 10-year bond yield, weekly changes, 12-month rolling, inverted axis, 31 January 1964 to 31 September 2021.
There is therefore more than just the credibility of the Fed at stake if inflation proves not to be transitory. Higher borrowing costs and weaker diversification are just two of the unwelcome outcomes if inflation becomes unanchored. Yet it is hard to see short-term supply problems overpowering long-term structural trends. 2022 will start out looking inflationary but we anticipate the more familiar disinflationary world to reassert itself as the year draws to a close. What is certain is the appetite for greater yield and income is insatiable. Inflation is the risk that can upend the positive backdrop, primarily because it is the factor with the power to frighten both markets and policy makers. If central bankers can avoid panic and ride out impending price pressures, markets should exhibit higher volatility but emerge relatively unscathed, supported by the recovery in cash flow and earnings. Footnotes Expand 1 Source: Bureau of Labour Statistics, Table 1, Consumer Price Index for All Urban Consumers: All items Less Food and Energy (Core CPI), combined weight of rent of primary residence and owners’ equivalent rent at September 2021, October 2021 release. 2 Source: US Federal Reserve, Consumer Credit release G.19, November 2021. 3 Source: Refinitiv Datastream, National Bureau of Statistics of China, GDP growth, constant prices, Q1 2010 to Q4 2014 inclusive, Q1 2015 to Q4 2019 inclusive, Q3 2021. 4 Source: International Monetary Fund, World Economic Outlook, Statistical Appendix, Table A8, October 2021. Glossary Expand