
Real estate shares have been out of favor in recent years, and there are indications that listed property is currently undervalued. Portfolio Managers Guy Barnard, Tim Gibson and Greg Kuhl assess the indicators and explore the associated risks and opportunities.
Key Takeaways
- Listed real estate underperformance versus the wider equity market appears increasingly stretched relative to history.
- There are indications that real estate investment trust (REIT) debt investors view the risk profile of the asset class as having fully recovered from the pandemic; the same is not reflected in equity markets.
- Cheap and plentiful long-term funding is supporting the refinancing of existing debt and may drive merger and acquisition activity in real estate.
In a recent panel debate, we were asked to discuss if we had seen any signs of valuation bubbles. Our response in relation to the real estate market was a somewhat flippant “chance would be a fine thing.*” The other panel participants – investors in technology, health care and sustainable equity strategies – all agreed that there are segments in their asset classes in which caution was certainly warranted (hydrogen technologies, anyone?).
Unlike the general equity market, listed REITs have not seen high-profile examples of stocks recording exponential share price gains in recent years, with the overall performance of the sector having lagged the wider equity market by 25% since the start of 2020. In the five years to 31 December 2020, global real estate stocks returned 4.7% annualized versus 12.9% for global equities.1
As illustrated in Figure 1, this level of relative underperformance is rare and was last witnessed in the buildup to the dot-com crash. Property stocks subsequently generated returns of 16% annualized over the five years from 2000 to 2005; in contrast, global equity returns were flat.2 While we would certainly not claim that “all else is equal,” it certainly bears some consideration.
Figure 1: Listed Real Estate Has Lagged Global Equities
[caption id=”attachment_352004″ align=”alignnone” width=”1502″]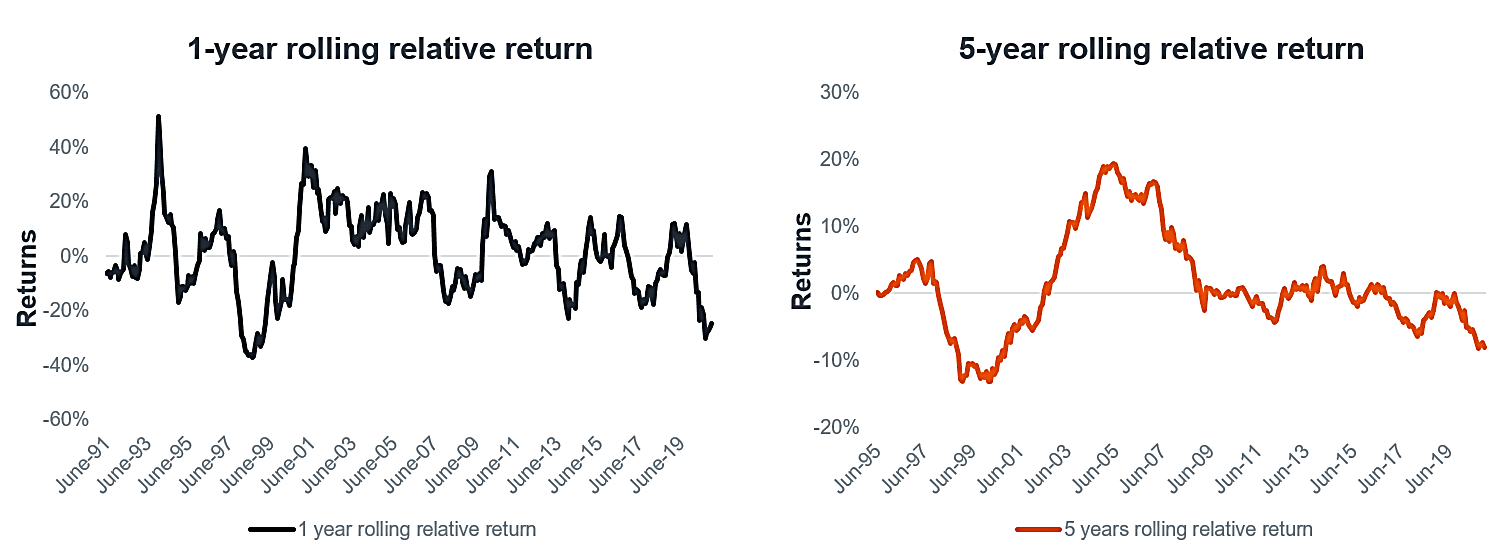 Source: Bloomberg, Janus Henderson Investors as of 31 December 2020. Listed real estate = FTSE EPRA NAREIT Developed Total Returns Market Index, global equities = MSCI World Total Returns Index. Rolling relative returns is calculated as the excess returns of listed real estate over global equities. Returns are annualized and reported in U.S. dollars. Past performance is not a guide to future performance.[/caption]
Same Assets, Different Valuations?
One observation worth highlighting in the current market is the divergence in valuations between the REIT equity and REIT debt markets (U.S. data shown in Figure 2). In the debt market, the yield spreads of REIT corporate credit and commercial mortgage-backed securities (CMBS) over Treasuries have returned to pre-pandemic levels and are also in line with their longer-term history (Figure 3). This suggests that debt investors view the risk profile of the asset class as having fully recovered from the pandemic. However, in the equity market, many valuation metrics – including REITs’ dividend yield spread versus the yield on their own debt instruments – are at or close to all-time wides.
Figure 2: REIT Equities Appear Historically Cheap vs. REIT Debt
[caption id=”attachment_352015″ align=”alignnone” width=”1057″]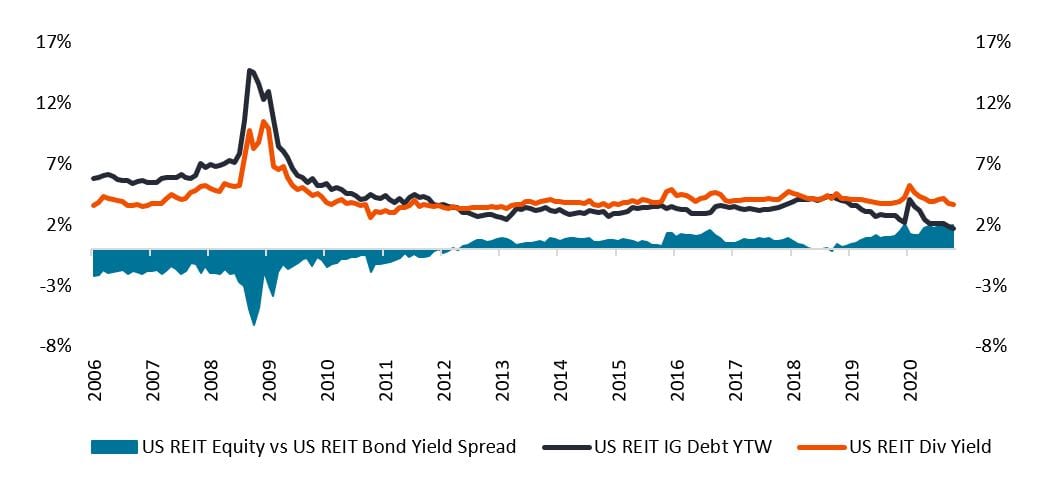 Source: Bloomberg, Janus Henderson Investors. REIT debt = Barclays Investment Grade (IG) REIT Index REIT equities = FTSE NAREIT Equity REIT Index). Spread: here refers to the difference in the yield of U.S. REITs and REIT debt over that of an equivalent government bond, e.g., U.S. Treasuries. Yields may vary and are not guaranteed.[/caption]
Given that debt financing is a key part of most REITs’ capital structure, it is also hugely beneficial that the yields on REIT investment-grade (IG) corporate credit and investment-grade CMBS are at around 20+ year lows (both 1.7% at the end of 2020) – see Figure 3. This presents REIT management teams with a significant opportunity to generate interest savings by refinancing existing debt, or to fund new acquisitions with very cheap long-term debt. Plentiful debt at low interest rates could also present private buyers with opportunities to generate outsized returns via merger and acquisition activity involving listed REITs or private real estate.
Figure 3: Real Estate Fixed Income Spreads over Treasuries
[caption id=”attachment_352026″ align=”alignnone” width=”1026″]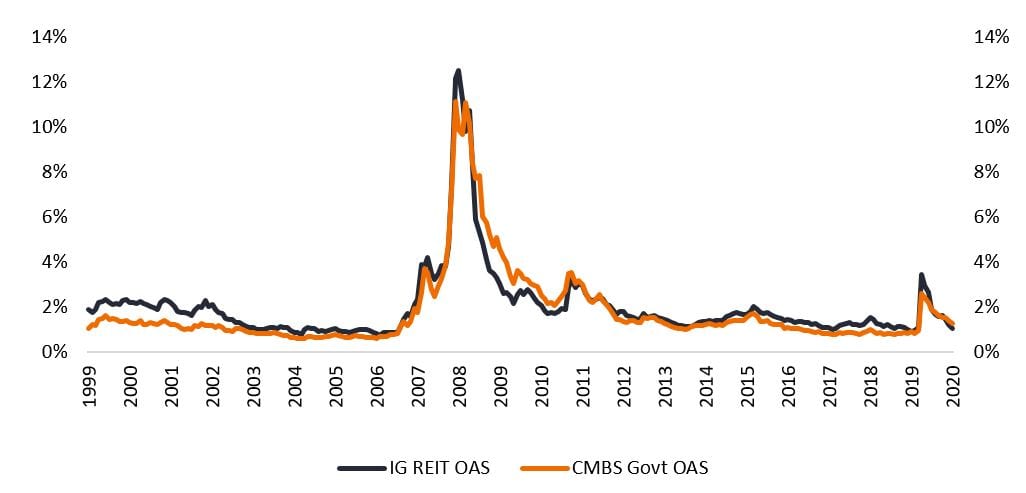 Source: Bloomberg, Janus Henderson Investors as of 31 December 2020. Real estate = Bloomberg Barclays Investment Grade REIT Index (IG REIT OAS), U.S. Treasuries= ICE BoFA US Fixed Rate CMBS Index (CMBS Govt OAS). Spread: here refers to the difference in the yield of REIT debt over that of an equivalent government bond (U.S. Treasuries).The option-adjusted spread (OAS) measures the difference in yield between a bond with an embedded option, such as a mortgage-backed security or calling back the issue.[/caption]
In conclusion, against a backdrop where return expectations across many other asset classes have declined, we believe real estate income is beginning to stand out as being attractive in both the direct and listed real estate markets. Moreover, in our view, the recent strength in real estate debt markets could be a precursor to future strength in listed real estate.
*An expression meaning you would very much like something to happen but there is no possibility that it will.
1,2 Source: Bloomberg as at 31 December 2020. Listed property = FTSE EPRA NAREIT Developed Index, general equities = MSCI World Index. Index returns in USD total return terms. Past performance is not a guide to future performance.3 Source: Deutsche Bank research, CB Richard Ellis as at 31 December 2020.
4 Source: NAREIT (National Association of Real Estate Investment Trusts) as of 26 January 2021.
Commercial mortgage-backed securities (CMBS): fixed income investment products backed by mortgages on commercial properties. CMBS provides liquidity to real estate investors and commercial lenders. In the event of default, the mortgage loans that form a single commercial mortgage-backed security act as the collateral, with principal and interest passed on to investors.