July 2022 Fixed Income Leadership
Opposing Forces- Test3

Jim Cielinski, Global Head of Fixed Income, considers potential scenarios for the economy, as central banks seek to maintain growth while stamping on inflation.
KEY TAKEAWAYS
- Inflation, Inflation, Inflation: central banks, having made a policy mistake, are now fixated on getting inflation under control.
- Growth will likely slow as weakening real disposable incomes curtail spending, but policymakers will welcome this development.
- Markets are moving to more ‘late cycle’ mentality, but low defaults should underpin credit markets.
The test of a first-rate intelligence is the ability to hold two opposed ideas in mind at the same time and still retain the ability to function. – F Scott Fitzgerald
Such is the conundrum facing central banks as they seek to rein in inflation without choking off economic growth.
Having retired the word ‘transitory,’ the US Federal Reserve (Fed) has performed a 180-degree turn and now worries about the elevated headline inflation levels becoming ingrained in people’s expectations. In the press conference following the March Fed policy meeting, Fed Chair Jerome Powell stated, “basically across the economy, we’d like to slow demand so that it’s better aligned with supply.” This is a firebrand comment from a Fed chair, and suggests he is prepared to aggressively tighten policy to defeat inflation. Supply chain problems are acknowledged but the Fed seems prepared to address the imbalance between supply and demand through the demand side of the equation.
War is inflationary
The initial expectation of markets was that the Russia-Ukraine conflict might drive investors towards the so-called ‘safe-haven’ of developed market government bonds. Instead, there seems to have been a reappraisal of what such a conflict means for inflation. Disruption to supply and diversion of materials bids up prices. What’s more, the ‘war’ against COVID which fractured traditional consumer demand patterns has echoes of the 1946-48 period when consumption revived after peace returned following the Second World War. Back then, supply was constrained because it took time for industry to reorientate away from military production back to producing normal economic goods, so the Fed sought to dampen demand by directly controlling the growth of bank credit. This time, interest rates and quantitative tightening are the preferred tools.
One way track … for now
Inflation should recede as the Fed appears determined to follow its new path. Over the coming months it is hard to see it performing yet another U-turn without losing credibility. Like a guided bus, the Fed is unable to depart from the current track until it reaches a key junction. That junction point may be when alarm bells start sounding around the strength of growth. Just as it is hard not to raise rates when headline inflation is elevated, it may become equally hard to carry on raising them when economic participants are suffering and this is showing up in data such as declining purchasing manager indices, weaker retail sales, and downward earnings revisions. We expect that to be the case later this year as businesses slow their inventory build, the inflation ‘tax’ begins to weigh on consumer spending, and corporate profit margins take a hit from higher input costs that they find increasingly hard to pass on. This is tomorrow’s story, however, and central banks are firmly fixated on inflation today. Growth will need to roll over convincingly to evoke a retreat.
So, we are presented with four potential scenarios for the global economy over the coming year, as depicted in Figure 1.
Figure 1: Growth versus central bank policy
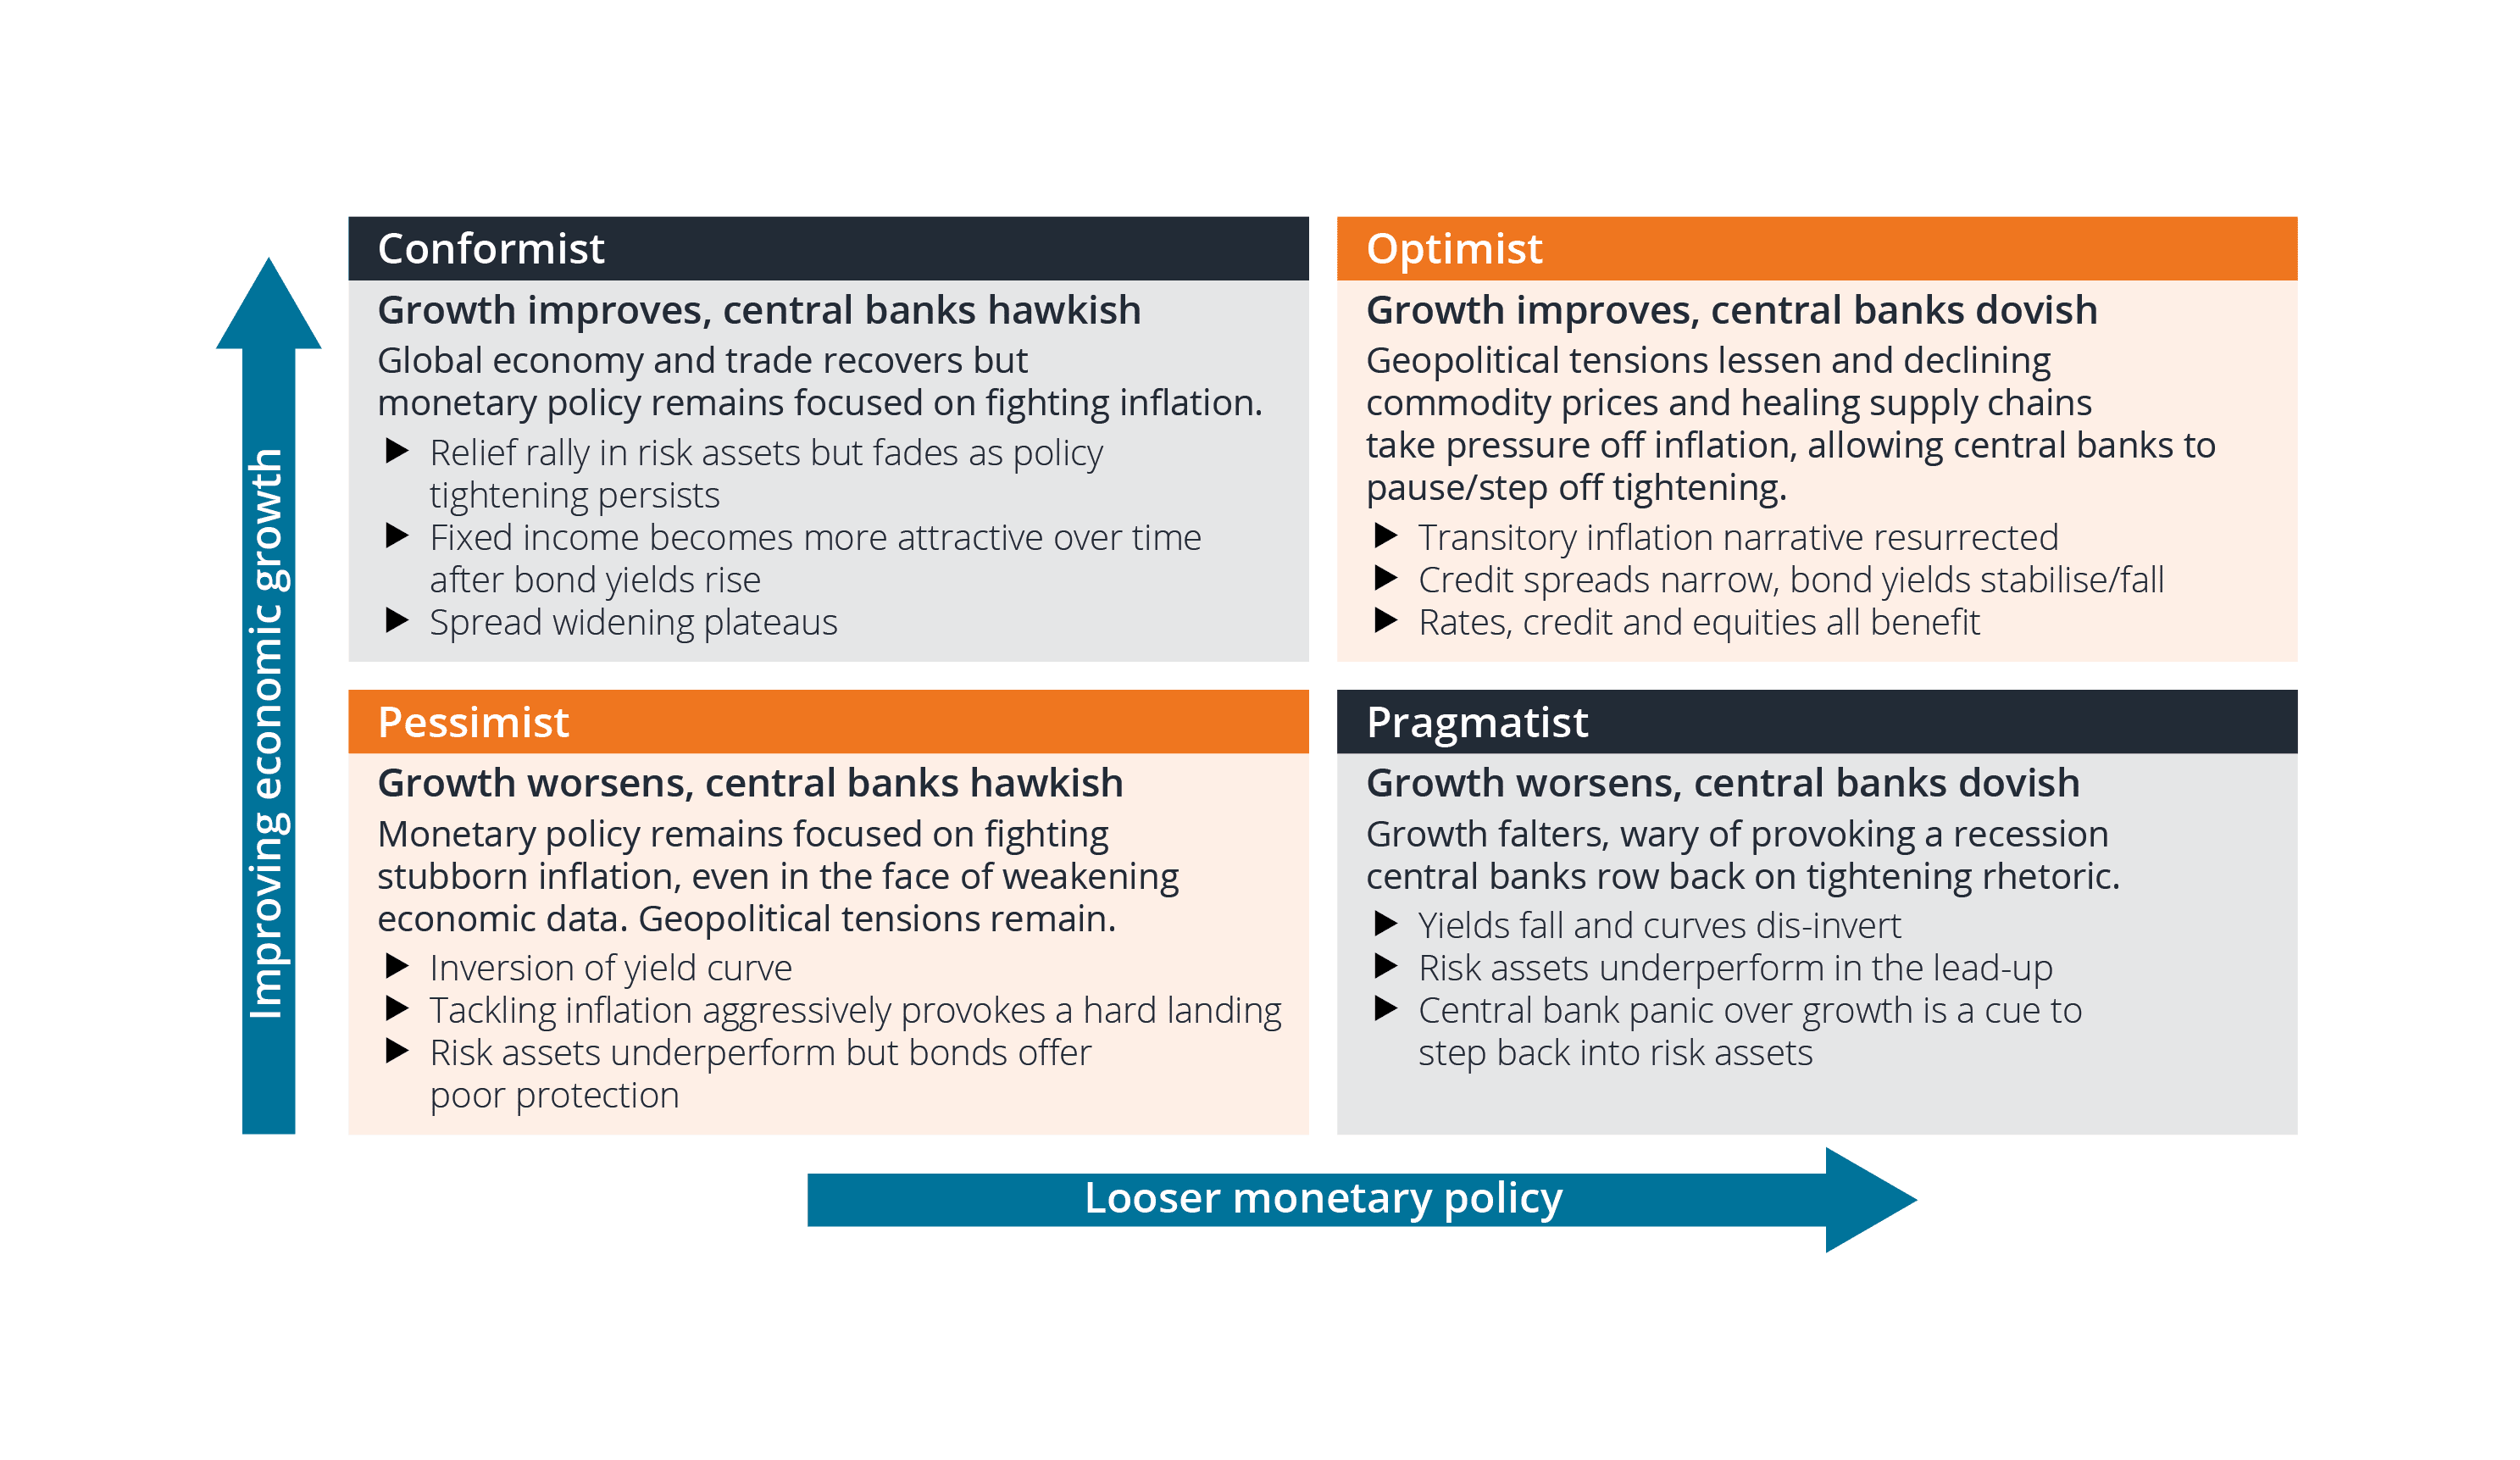 Source: Janus Henderson Investors. Hawkish describes central banks when favouring tighter monetary policy (eg, higher interest rates), dovish describes when they favour looser policy. For illustrative purposes only. Scenarios and outcomes are not guaranteed.
The danger is that having been in the Optimist quadrant as recently as six months ago, the global economy moves rapidly through the Conformist quadrant into the Pessimist quadrant, particularly if the Fed remains determined to tighten financial conditions.
Reaction function or new pain threshold
The Fed has already indicated that it wants to take the policy rate above the neutral rate (the March dot plot had rates at 2.8% in 2023, above the 2.4% long-term rate). Powell is convinced that the labour market in the US is hot and has firmly planted the Fed’s flag in one of the left-hand quadrants. It was odd that the neutral rate was moved down from 2.5% to 2.4%, perhaps a recognition of the growing weight of debt in the economy making it more sensitive to rate hikes.
Regardless, financial conditions look set to tighten further because, in Powell’s own words, “all the signs are that this is a strong economy … and one that will be able to flourish … in the face of less accommodative monetary policy.” By tighter financial conditions we mean the degree of difficulty (tightness) that the private sector experiences when trying to secure sources of finance. Tighter financial conditions can be expressed through wider credit spreads or higher real yields (more expensive to raise debt finance) weaker share prices (more expensive to raise equity capital), or higher mortgage rates (more expensive to finance real estate purchases). We have already seen some rapid market moves, as shown in Figure 2.
Figure 2: Market reflecting tighter financial conditions
Index
|
30 Jun 2021
|
31 Dec 2021
|
31 March 2022
|
| 2-year US Treasury yield (%) |
0.25 |
0.73 |
2.34 |
| 10-year US Treasury yield (%) |
1.47 |
1.51 |
2.34 |
| 30-year US mortgage interest rate (%) |
3.02 |
3.11 |
4.67 |
| Credit spread BBB rated US Corp (bps) |
107 |
121 |
149 |
| Credit spread BB rated US Corp (bps) |
234 |
262 |
315 |
Source: Bloomberg, Generic 2-year and 10-year US government bond yields; Refinitiv Datastream, Freddie Mac 30-year mortgage rate; ICE BofA US BBB Corporate Index and ICE BofA US BB High Yield Index, credit spread = option-adjusted spread over government (Govt OAS) in basis points, at 31 March 2022. Basis point (bp) equals 1/100 of a percentage point. 1 bp = 0.01%, 100 bps = 1%.
This has led to tighter financial conditions and not just in the US. More hawkish comments from the European Central Bank and market responses are seeing a similar tightening of financial conditions in Europe, although still some way off the levels reached in the Eurozone debt crisis.
Figure 3: Financial conditions set to tighten further
Bloomberg US and Eurozone financial conditions indices
 Source: Bloomberg, 31 March 1997 to 31 March 2022. Bloomberg US Financial Conditions Index and Bloomberg Eurozone Financial Conditions Index. A positive figure indicates more accommodative financial conditions and a negative figure indicates tighter conditions. The index reflects standard deviations from historical normal (pre-crisis) levels.
Don’t fight the Fed
Having laid out its tightening intentions, the prospect that we face an inverted yield curve (where shorter-dated debt yields more than debt with longer maturities), has grown substantially. In fact, inversion of yields on the widely followed 2-year and 10-year US government bonds – the so-called 2s10s – occurred at the end of March/beginning of April. When the gap turns negative it has historically heralded a recession, although there have been a few false signals where it has been overly early. It has, however, inverted in front of every post WW2 recession.
Figure 4: Inversion of 2-year and 10-year yield is reached
Differential in yield between US 10-year and 2-year government bond
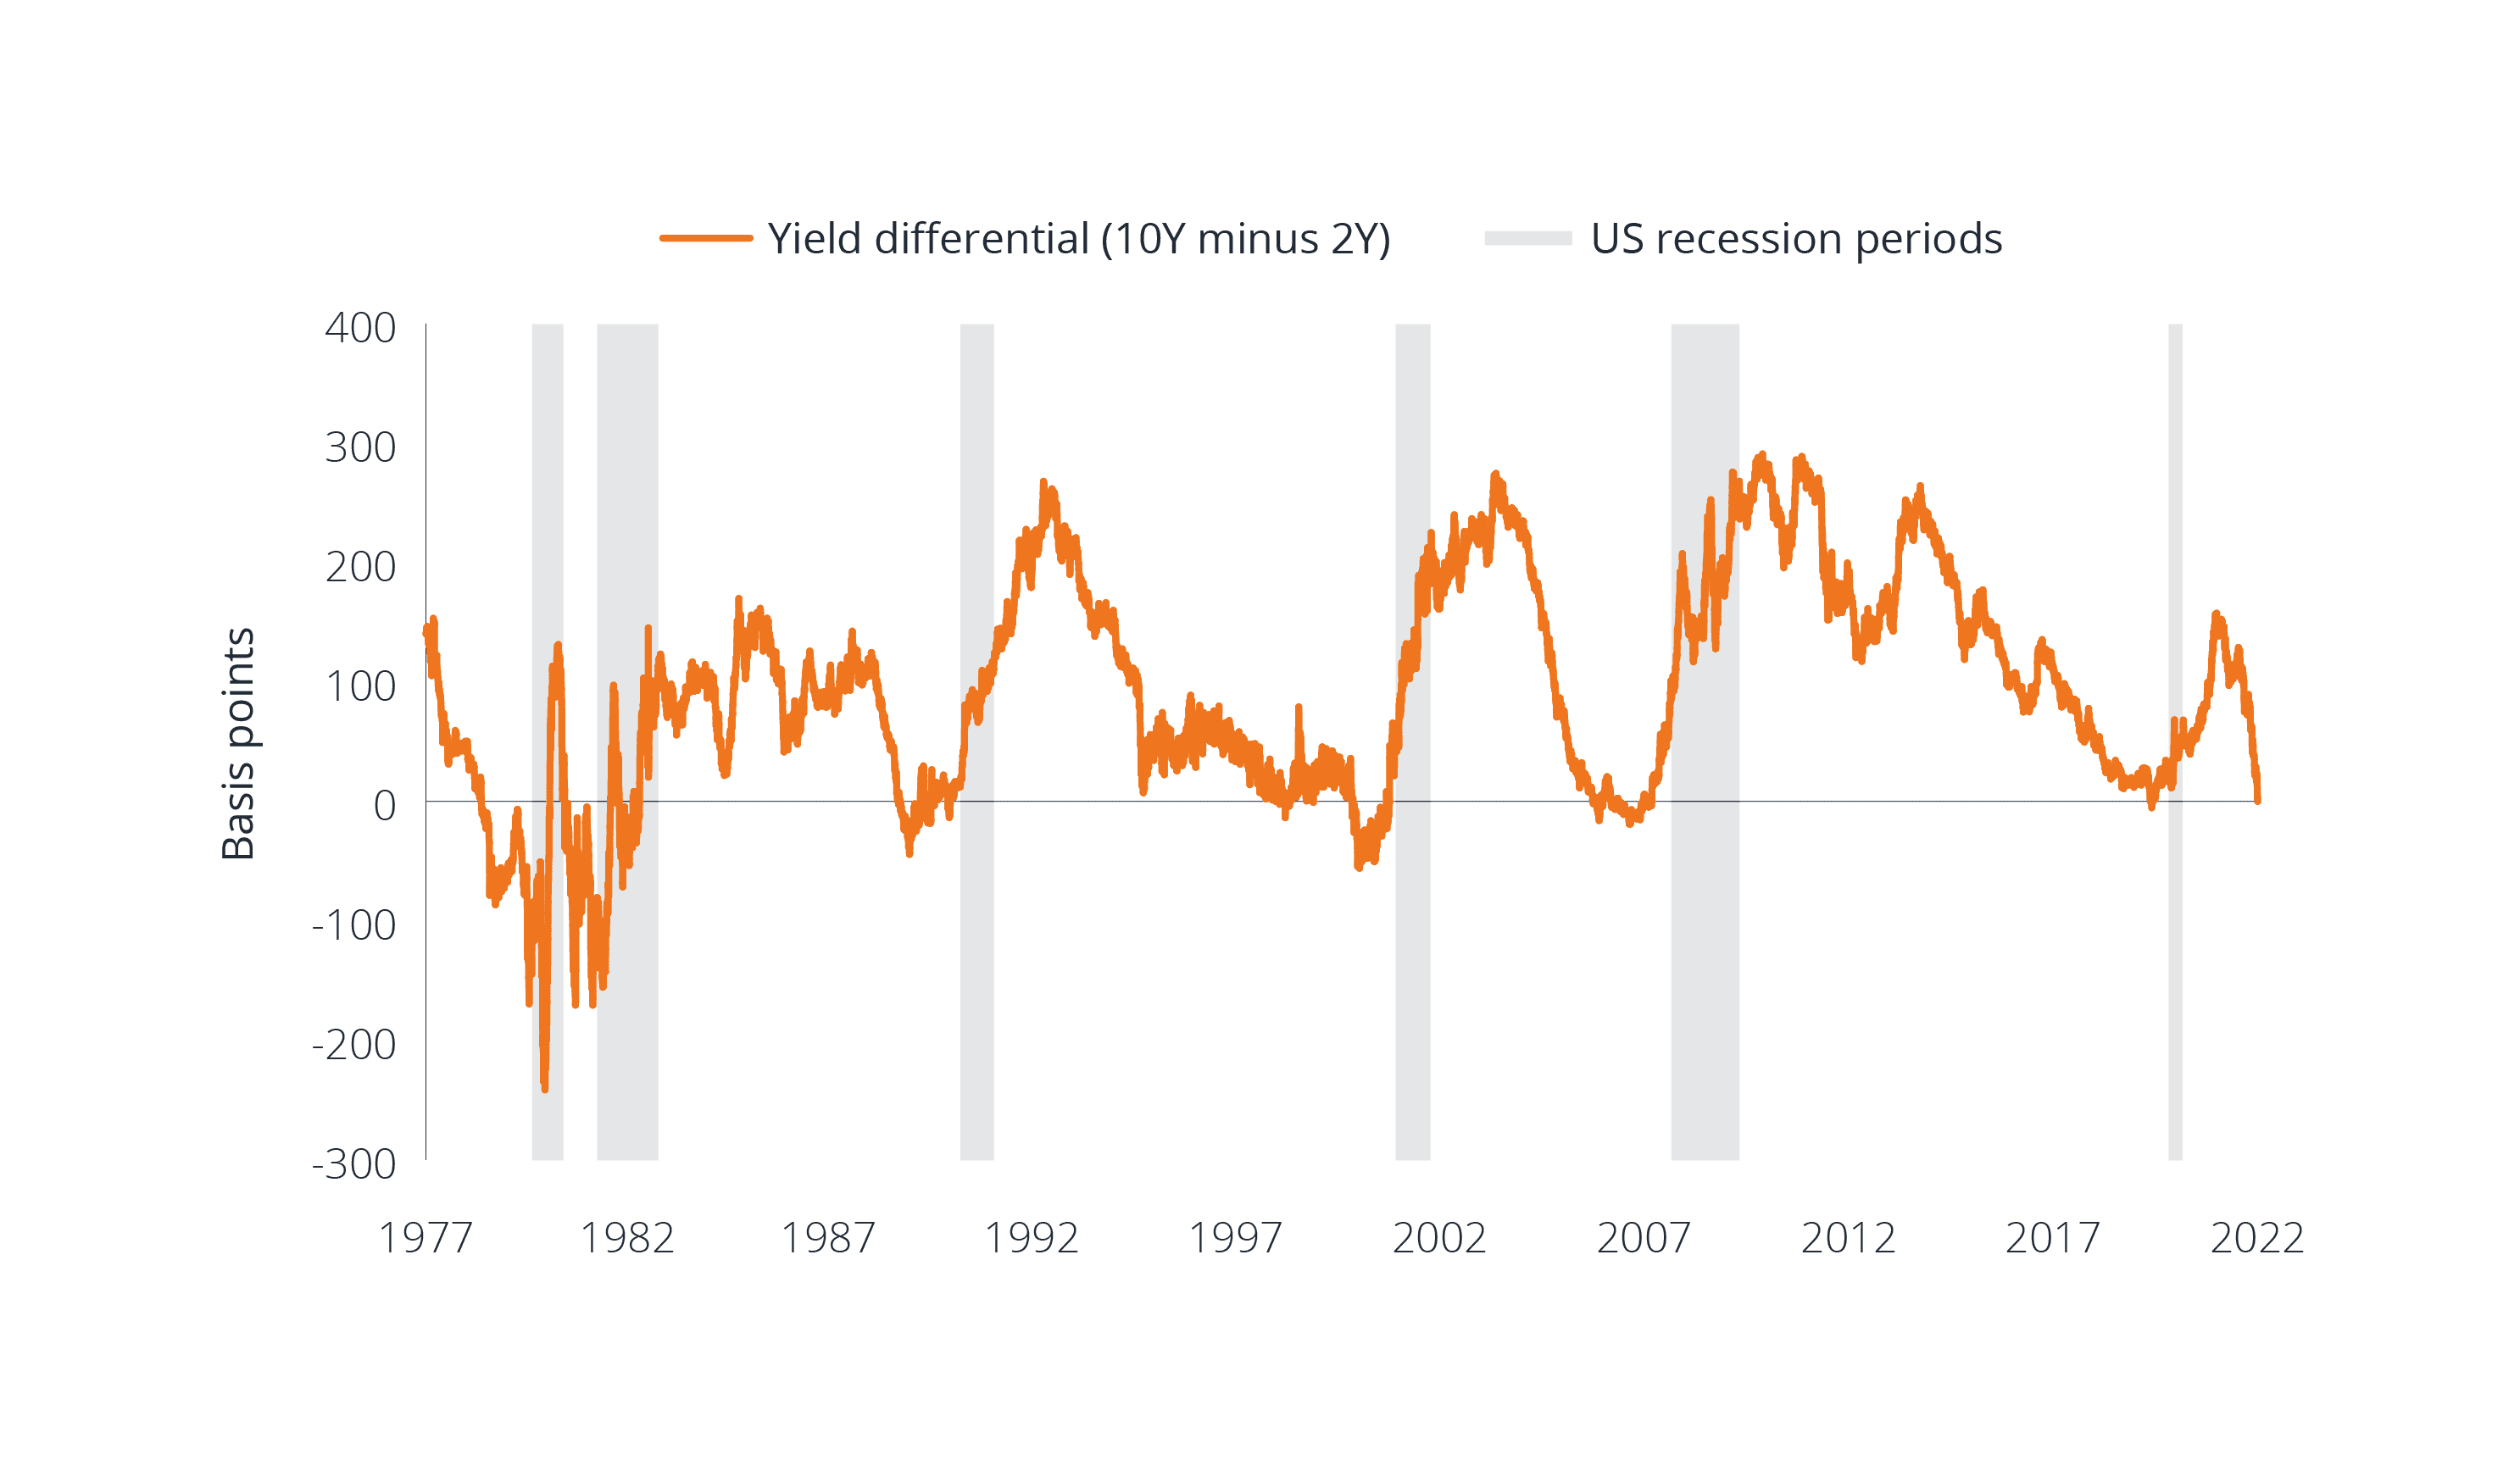 Source: Bloomberg, 31 March 1977 to 31 March 2022. The shaded area represents US recession periods from NBER.
That said, there are reasons to believe that its reliability may be less potent in an age of less conventional monetary policy. The longer end of the yield curve has likely been distorted to produce a decline in the term premium. The yield on longer-dated bonds can be thought of as being in two parts – expected average short-term rates over the duration of the bond
plus a term premium. This term premium is essentially the additional yield that an investor receives for locking away their money for the longer period.
Economists at the Federal Reserve Bank of New York did some research into estimating the term premium on US government bonds. We can see the result of their work in the chart below for the 10-year US government bond.
Figure 5: The term premium has shrunk, notably since QE
US 10-year term premium (ACM)
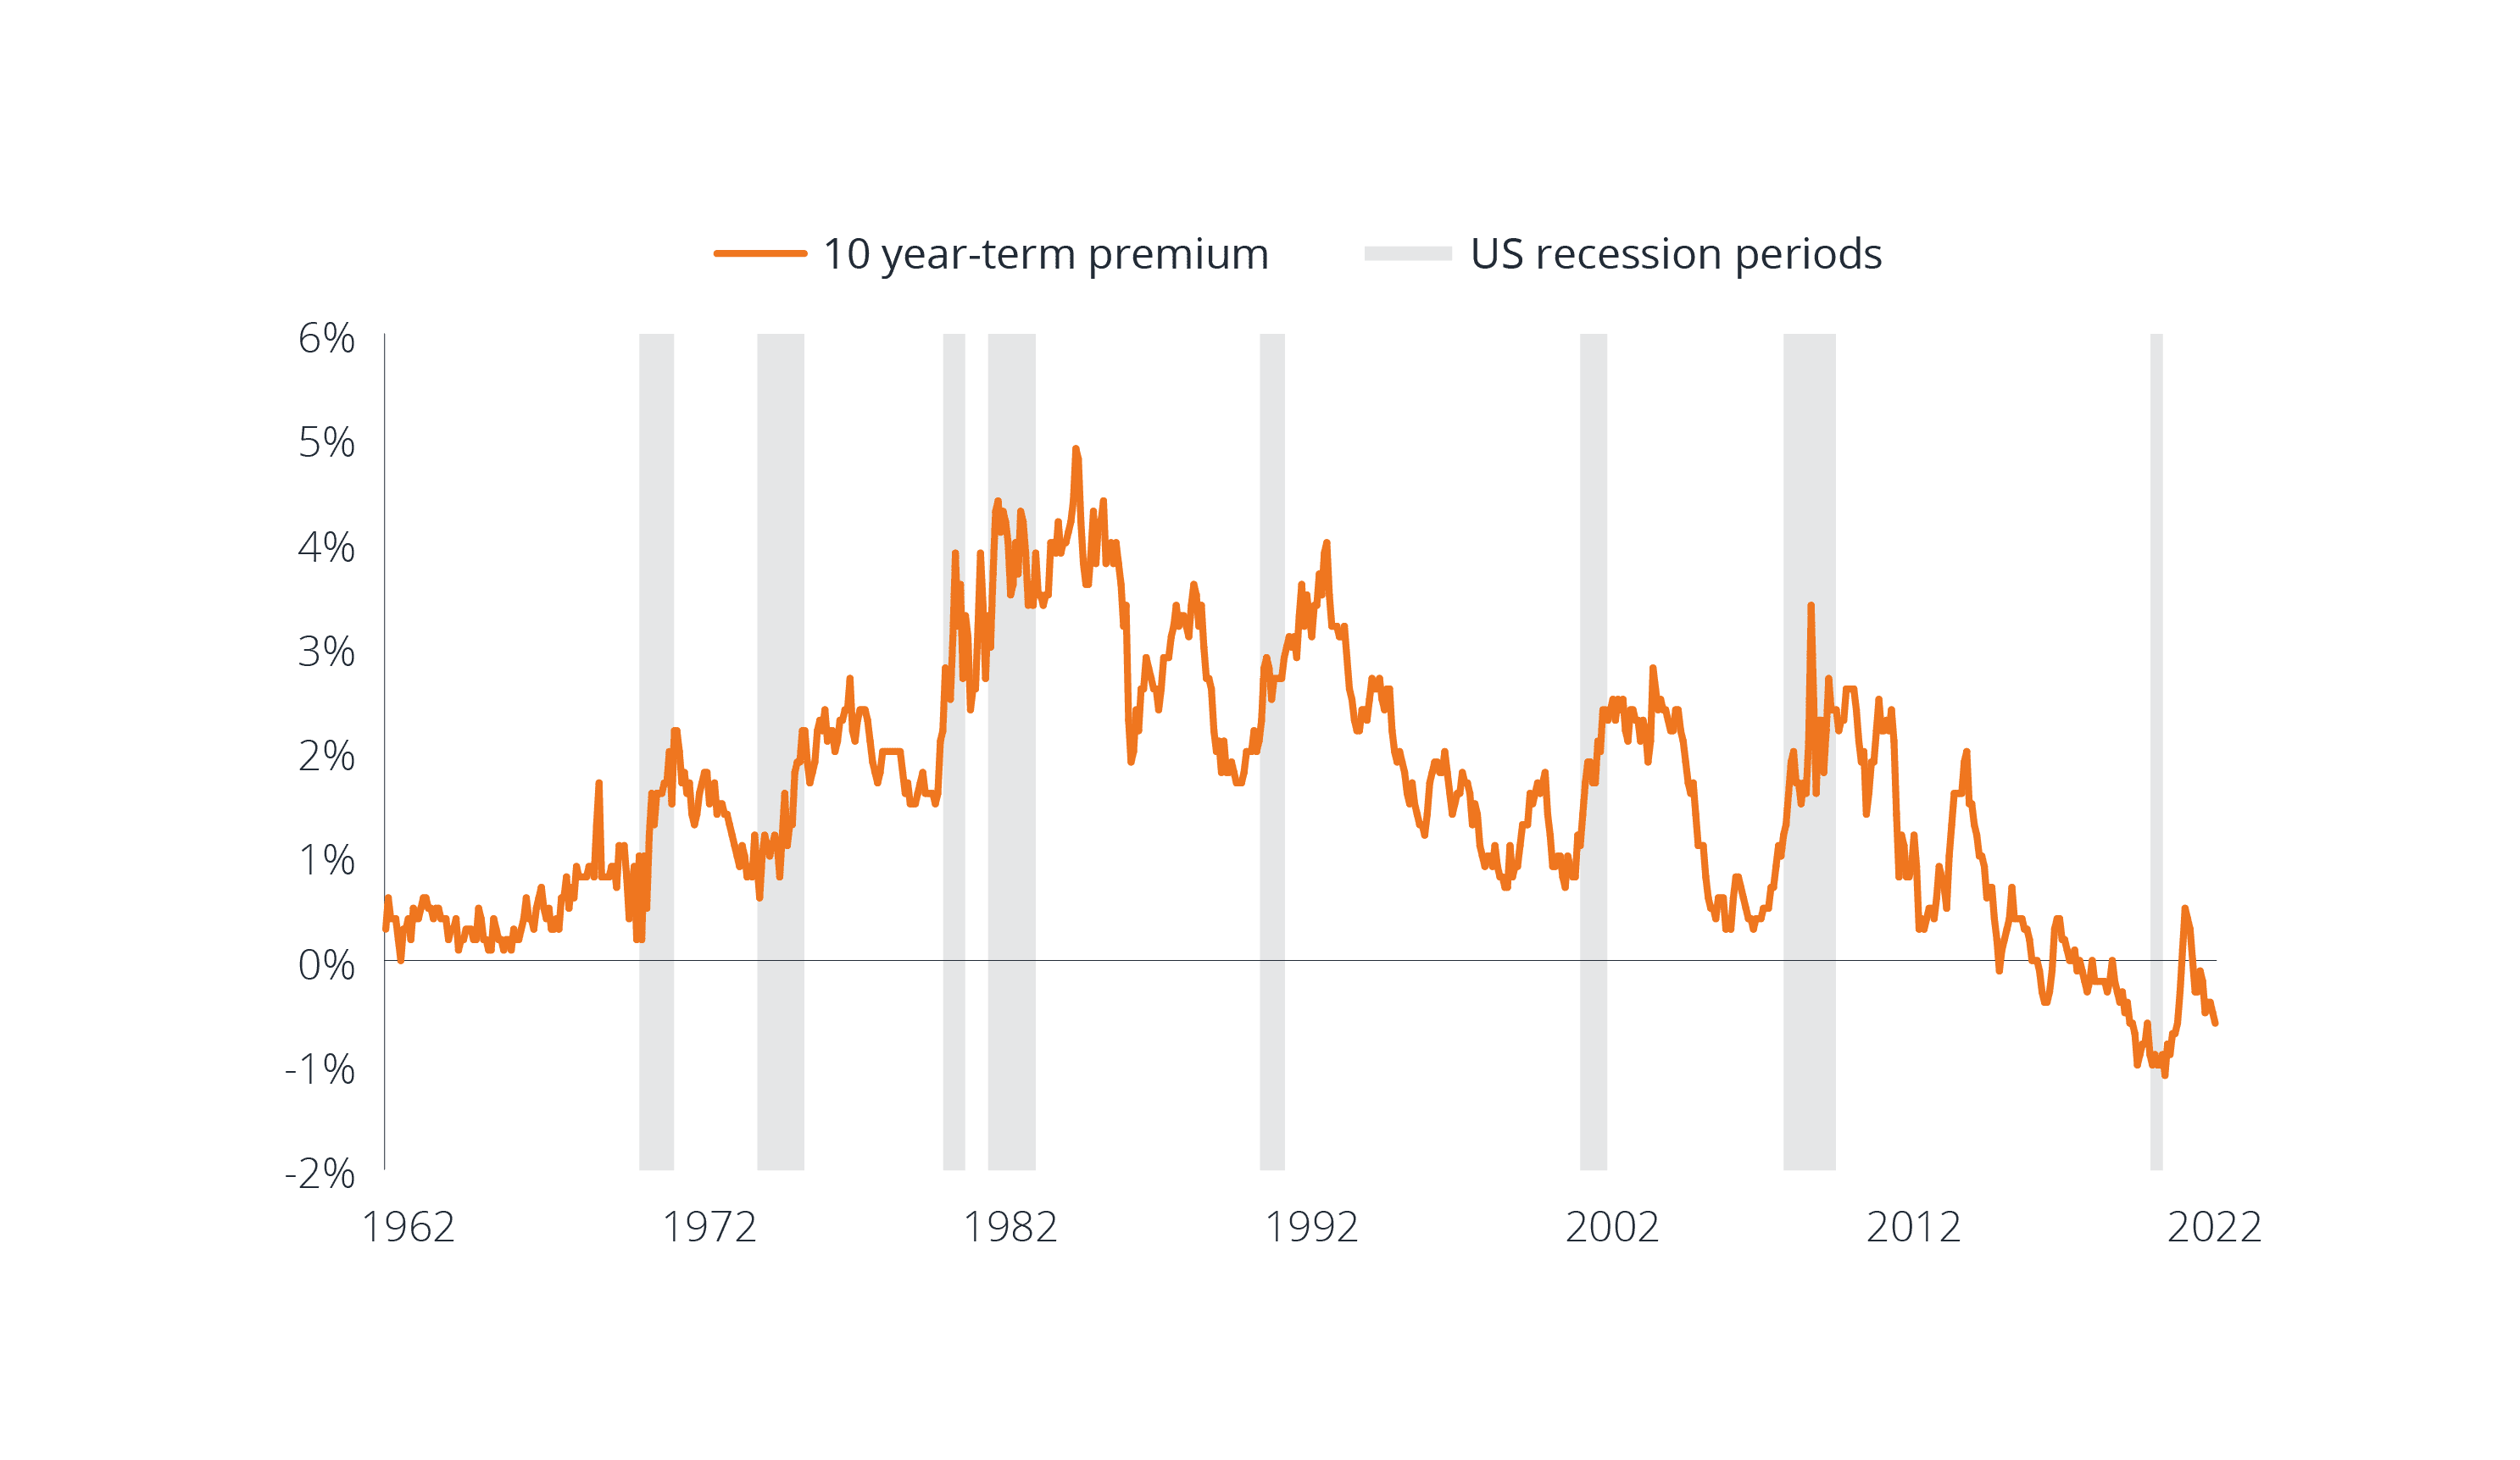 Source: Federal Reserve Bank (FRB) of New York, March 1962 to March 2022. The Treasury term premia are estimates derived by New York Fed economists Tobias Adrian, Richard Crump and Emanuel Moench (or “ACM”) and are not official estimates of the FRB of New York. The shaded area represents US recession periods from NBER.
It is possible to surmise that yield curve inversion may be less of an omen than it once was. This is particularly important for credit, which given its sensitivity to corporate conditions, has a particular interest in economic indicators.
A peculiar feature of the current rate tightening episode is that credit spreads have already widened quite significantly in recent months. This is unusual so early in a rate tightening episode (typically rising rates coincide with a strong economy and therefore amenable conditions for credit). What might be behind it?
- Declining risk appetite. Spreads widen when risk appetite declines and investors demand more compensation – the additional uncertainty surrounding the Russia-Ukraine conflict on the global economy is a factor, as are ongoing concerns around COVID in Asia.
- Policy uncertainty. The Fed pivot has been astonishing. Within a month the Fed has gone from actively expanding its balance sheet to discussing contracting it.
- Fear of policy error as the pace of hikes may stall economic growth.
- Possible proxy rates effect? The rapid jump in inflation causes investors to demand more yield, particularly at the short end where high yield is dominant, so spreads gap wider.
The credit markets seem to be acknowledging the potential for a growth slowdown, but corporate fundamentals remain robust, with cash flows strong and leverage ratios (debt as a proportion of earnings) well below their peaks. So, are we close to pricing in a recession? Bank of America points out that there are four stages to pricing a recession in credit. First, the cost of hedging rises. We have seen evidence of this as the cost of credit default swaps rises. Second, the primary market stalls. There has been no primary issuance in US CCC bonds in the last six weeks. So far, this has been viewed as a positive technical (low supply is supportive for bond prices) but if it continues it could indicate companies are reticent or finding it hard to raise capital at attractive levels. Third, dispersion widens. There has been a small amount of this but not much (bond prices typically move apart when people start selling physical bonds to de-risk rather than using hedges), nothing in the order you would expect ahead of a recession. Fourth, distress rises. As Figure 6 demonstrates, we seem to be a long way from distress on that score. Rates of default are expected to remain low given the robust fundamentals.
Figure 6: We seem to be a long way from distress
Percentage of bonds in US high yield index with OAS > 1000 basis points
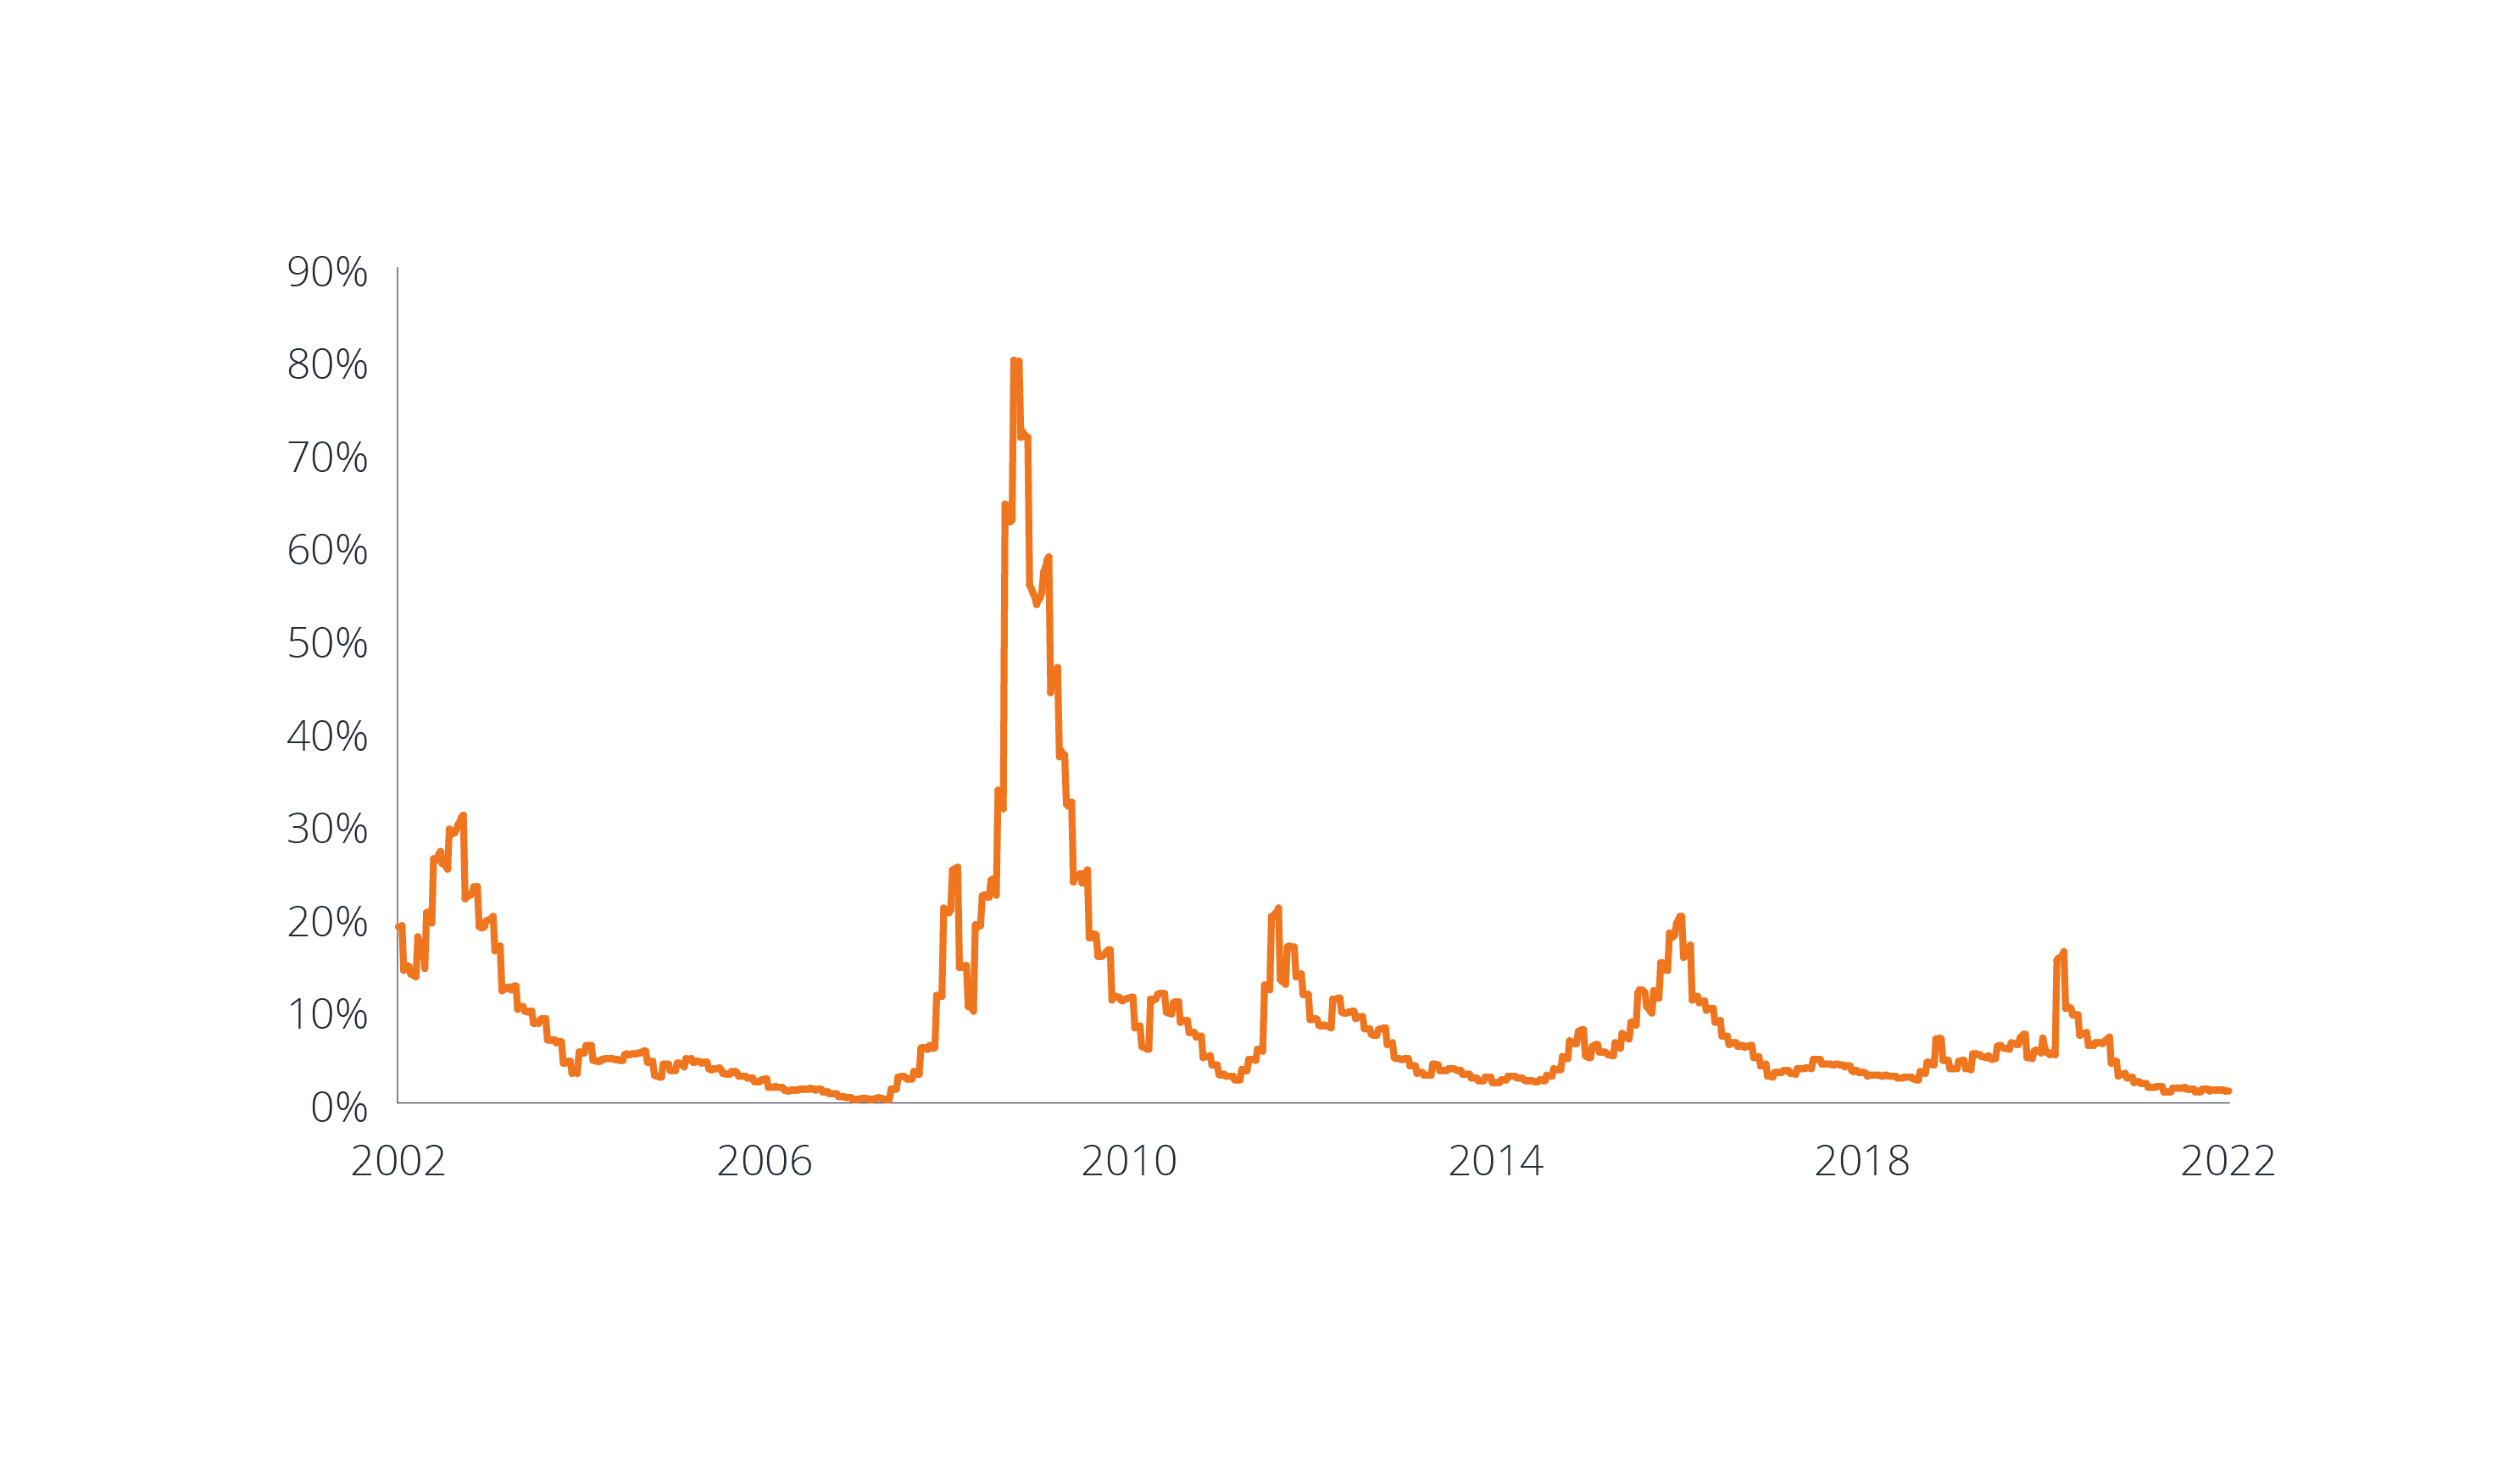 Source: Bloomberg, 31 March 2002 to 31 March 2022. ICE BofA US Distressed High Yield Index as part of BofA US High Yield Index. Option-adjusted spread over government (Govt OAS) in basis points.
Taken together, we think that investors should brace for a growth shock as the pressures of tighter monetary conditions and the inflation ‘tax’ combine to depress activity. Central bankers will be hard pressed to move off the tightening path near term given their determination to make policy more restrictive. We doubt that the terminal rates suggested by market pricing will be reached, but an inflection point is upon us, and higher volatility and increasing stress appear here to stay.
1 Bank of America, US Economic Weekly, 18 February 2022.
2 Morgan Stanley, ‘Living with yield curve inversion’, 17 March 2022.
Featured Funds
JGBIX
Global Bond Fund
JGBIX
Global Bond Fund
Glossary Expand
Read more on these topics
Macroeconomics CreditView All Perspectives
 Jim Cielinski, CFA
Global Head of Fixed Income
Jim Cielinski, CFA
Global Head of Fixed Income