
Ahead of the New Year, we published a note – The Average Outcome (Almost) Never Happens – showing strategist forecasts for 2022. Their average prediction called for an 8% gain in the S&P 500® Index, in line with its long-term growth rate. We also analyzed the historical distribution of annual returns and found a strange result – average is rare. The S&P 500 has gained between 5% and 10% in only six out of the last ninety-four years.
Instead, we found actual outcomes were volatile, with both larger positive and larger negative returns occurring more frequently than average ones. Reality is usually wilder than forecasts. And the first quarter of 2022 was indeed wild. It will forever be remembered for the Russian invasion of Ukraine, a monumental human tragedy that continues to unfold.
Although much less important, it was an unusual quarter for financial markets too. Both stocks and bonds fell together for the first time since Q1 2018. The S&P 500 finished the quarter at 4,530, down -4.9%, and is currently below most strategist forecasts for 2022.
The first quarter is done. But there are still three quarters to go. Does knowing what happened in Q1 change expectations for the rest of 2022?
We start by checking if research estimates have changed. Exhibit 1 compares S&P 500 forecasts from the original note to the latest available. They are not significantly different. The current average year-end forecast of 4,838 is about -1.4% lower than before. Perhaps strategists don’t think the outlook has meaningfully changed, or there is an anchoring bias with respect to prior market calls.
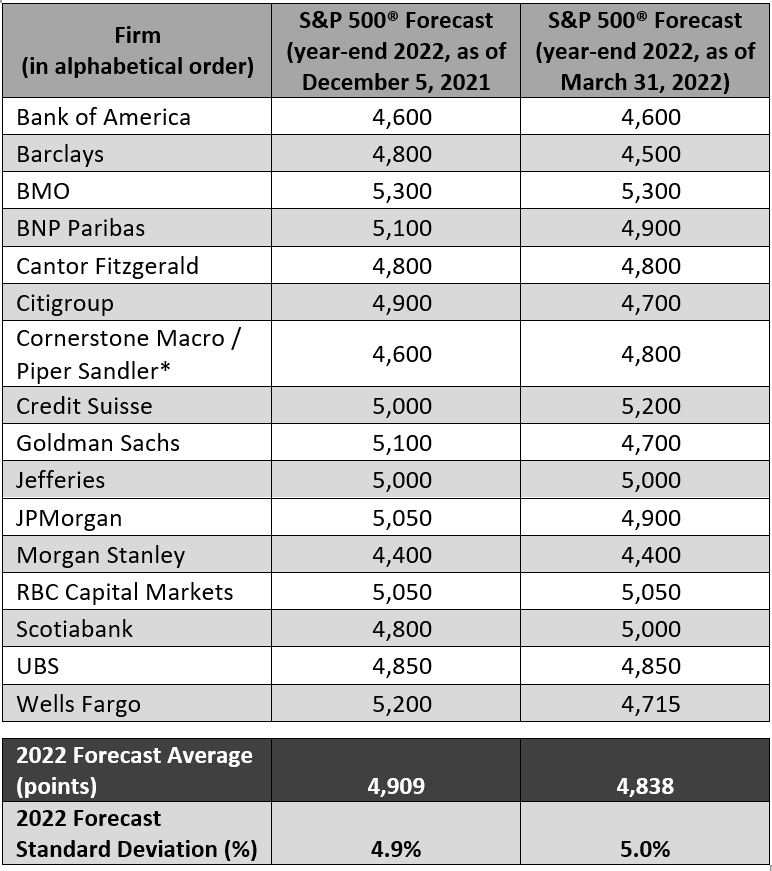
*Cornerstone Macro was acquired by Piper Sandler in February 2022.
Source: Bloomberg, Research Reports, as of 31 March 2022. Industry estimates are hypothetical in nature, do not reflect actual investments, and are not guarantees of future results.
We then split these events into two categories – positive Q1 and negative Q1. Positive Q1s happened 60% of the time with an average price gain of +6.9%, while negative Q1s made up the remaining 40% with an average price loss of -6.5%.
Subsequent price moves for these two categories are unexpectedly different. A positive Q1 was followed by a positive Q2-Q4 in almost 80% of years. But a negative Q1 was only followed by a positive Q2-Q4 in just over half the years – i.e., the rest of the year was close to a “coin flip.”
There were some other curious observations as well. Following a negative Q1, the average return over the rest of year was higher, but the median return was lower. The dispersion of outcomes was also wider. Exhibit 2 summarizes these results.
Source: Bloomberg, as of 31 March 2022. S&P 500 Index price series from January 1928 to March 2022, no transaction costs. Past performance does not predict future returns.
Now, the total sample size (94 years) is not particularly large, and the distribution of future returns can and will vary widely from the past. But these results suggest that a negative Q1 is associated with even wilder swings over the rest of the year.
This ever-present uncertainty of markets is why combining uncorrelated strategies and assets is key to building a robust portfolio. After a first quarter that was historic in many ways, our basic message is unchanged from the previous note: Prediction about the future is hard.
Footnotes
1 Bloomberg, S&P 500 Index price series from January 1928 to March 2022.
Average is found by adding all numbers in a data set and dividing by the number of values in the set.
Median is the middle value when a data set is ordered from least to greatest.
Standard Deviation measures historical volatility. Higher standard deviation implies greater volatility.
S&P 500® Index reflects U.S. large-cap equity performance and represents broad U.S. equity market performance.

Alternative Perspectives
Connecting you to the latest thinking from our Alternatives teams.
Explore Now