Please ensure Javascript is enabled for purposes of website accessibility Lowland Investment Company Fund Manager Commentary – October 2022 - Janus Henderson Investors

Lowland Investment Company Fund Manager Commentary – October 2022

Laura Foll and James Henderson, Portfolio Managers of Lowland Investment Company, deliver an update on the Company, highlighting factors currently impacting the UK market, the key drivers of performance, and recent portfolio activity.

Laura Foll, CFA

Laura Foll, CFA

Portfolio Manager


James Henderson

James Henderson

Portfolio Manager


17 Nov 2022
3 minute read

Please Note

From January, Lowland Investment Company’s Commentary will be merged into the Factsheet. The new, and improved, merged Factsheet document will still be accessible via the ‘Quicklinks’ and ‘Documents’ sections on Lowland Investment Company’s webpage.

Investment Environment

UK equity markets recovered in October as the FTSE AllShare Index rose 3.1%. UK Government bonds recovered strongly following volatility in September caused by the UK Government’s tax-cutting plans, while sterling also rallied towards the end of the month. Sentiment towards the UK improved after the previously announced tax cuts were reversed and there were hopes that the new Prime Minister could offer the UK more stability. This had the biggest positive impact on the share prices of large and medium sized companies. The FTSE 100 Index of large companies rose 3.0% while the FTSE 250 Index rose 4.5% (all figures given are total return, in sterling terms).

Portfolio review

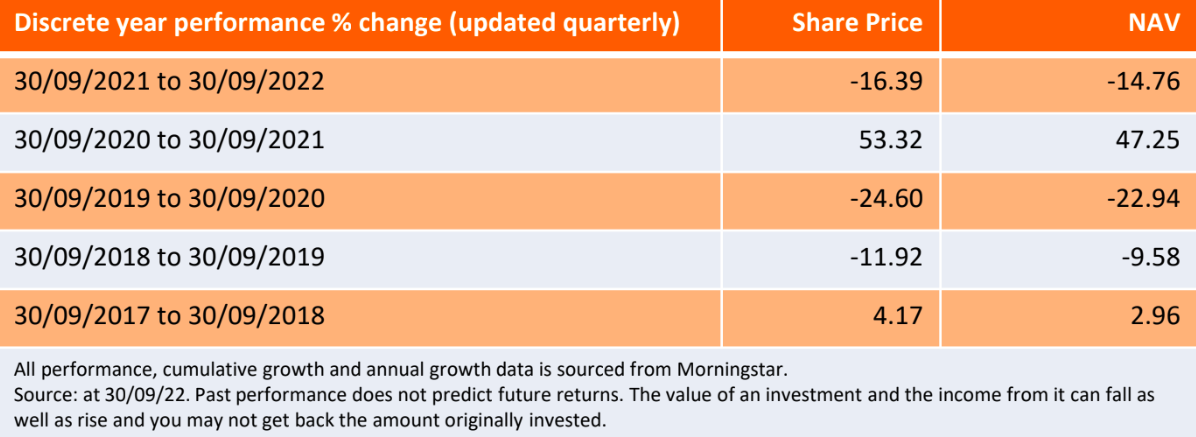
The Company underperformed the benchmark, returning 2.9% while the FTSE All-Share Index benchmark rose 3.1% during October. Over the same time period, its AIC UK Equity Income peer group rose 2.6%. We have always had a multi-cap approach to income investing as this broadens the potential investment universe beyond a relatively select number of large UK company dividend payers. So far this year, our larger than benchmark position in smaller companies has been a headwind to relative performance. Small-sized companies again underperformed the benchmark, while large and medium sized companies outperformed. At the sector level, the energy companies were the largest detractors from returns due to UK natural gas price weakness and concerns of a potential windfall tax on the profits of energy firms.

In October, we initiated a new position in housebuilder Bellway and added to the position in Land Securities. The UK property market has suffered recently as rising interest rates make mortgages less affordable for potential buyers, therefore reducing demand. Bellway has fallen significantly so far this year and was trading at a large discount relative to the value of its assets at the end of October, which we felt could already reflect a substantial fall in the value of its properties. We also added to the position in Land Securities which was trading at a large discount to its net asset value. These positions were funded by trimming the position in defence company BAE systems following a period of strong performance.

Manager Outlook

October saw an improvement in sentiment towards the UK following very turbulent period. The market reacted positively to the appointment of the new Prime Minister, buoying hopes of a period of less political instability in the UK. We have seen a recovery in the share price of our more domestically exposed companies. We are adding to companies which we believe are significantly undervalued and where we see potentially good opportunities for long term growth.


Discount/Premium – The amount by which the price per share of an investment company is either lower (at a discount) or higher (at a premium) than the net asset value per share (cum income), expressed as a percentage of the net asset value per share.
Gearing – The effect of borrowing money for investment purposes (financial gearing). The amount a company can “gear” is the amount it can borrow in order to invest. Gearing is used in the expectation that the returns on the investments bought will exceed the costs of the borrowings that funded the purchase. This Company can also use synthetic gearing through derivatives and foreign exchange hedging and/or other non-fully funded instruments or techniques.
Leverage – The Company’s leverage is the sum of financial gearing and synthetic gearing. Details of the Company’s leverage limits can befound in both the Key Information Document and Annual Report. Where a company utilises leverage, the profits and losses incurred by the company can be greater than those of a company that does not use leverage.
Market capitalisation – Month end closing mid-market share price multiplied by the number of shares outstanding at month end.
NAV (Cum Income) – The value of investments and cash, including current year revenue, less liabilities (prior charges such as loans, debenture stock and preference shares at fair value).
NAV (Ex Income) – The value of investments and cash, excluding current year revenue, less liabilities (prior charges such as loans, debenture stock and preference shares at fair value).
Net asset value total return – The theoretical total return on shareholders’ funds per share reflecting the change in Net Asset Value (NAV) assuming that dividends paid to shareholders were reinvested at NAV at the time the shares were quoted ex-dividend. A way of measuring investment management performance of investment trusts which is not affected by movements in discounts/premiums.
Net assets – Total assets minus any liabilities such as bank loans or creditors.
Net cash – A company’s net exposure to cash/cash equivalents expressed as a percentage of shareholders’ funds, after any offset against its gearing. This is only shown for companies that have gearing in place.
Net gearing – A company’s total assets (less cash/cash equivalents) divided by shareholders’ funds expressed as a percentage.
Ongoing charges – The total expenses for the financial year (excluding performance fee), divided by the average daily net assets, multiplied by100.
Risk rating – The key measure used to assess risk is volatility of returns, using historic net asset value (NAV) performance of the companyover 1 and 3 years. In this instance volatility measures how much a company’s NAV fluctuates over time in relation to the UK Equity market. The higher a volatility figure, the more the NAV has fluctuated (both up and down) over time. Please note that risk categorisations are indicative and based principally on historic data and should not be solely relied upon when making investment decisions.
Share price – Closing mid-market share price at month end.
Share price total return – The theoretical total return to the investor assuming that all dividends received were reinvested in the shares of the company at the time the shares were quoted ex-dividend. Transaction costs are not taken into account.
Total assets – Cum Income NAV multiplied by the number of shares, plus prior charges at fair value.
Yield – Calculated by dividing the current financial year’s dividends per share (this will include prospective dividends) by the currentprice per share, then multiplying by 100 to arrive at a percentage figure.
Cyclical stocks – Companies that sell discretionary consumer items, such as cars, or industries highly sensitive to changes in the economy, such as miners. The prices of equities and bonds issued by cyclical companies tend to be strongly affected by ups and downs in the overall economy, when compared to non-cyclical companies.
Net asset value – The total value of the Company’s assets less its liabilities.
Volatility – The rate and extent at which the price of a portfolio, security, or index, moves up and down. If the price swings up and down with large movements, it has high volatility. If the price moves more slowly and to a lesser extent, it has lower volatility. Higher volatility means the higher the risk of the investment.