

The Covid-19 outbreak has had a devastating impact on the global economy and, as a consequence, sent stock markets reeling across the globe. We have been here before however and, with any bear market – defined as a period in which share prices fall 20% or more from their most recent 52-week high (and typically stay depressed for a while) – there are invariably important lessons to be learned. Whilst the signposts are rather easier to recognise in the rear-view mirror, they are nevertheless worth studying after the fact.
So, are we actually in a bear market? On 17th January 2020, the UK’s FTSE 100 was at a high of 7,674; prior to that, on 29th July 2019, it was at 7,686. Now, in mid-April, it’s trading around 5,840 – a fall of roughly 24% against both previous highs.1 The US experience has been even more harrowing. The S&P 500 Index’s most recent 52-week high was 19th February 2020 when it stood at 3,386. It recently traded as low 2,237 on 23rd March – a fall of 34% – although, having regained some ground, it now stands around 2,790.2 The answer to the question posed would therefore be a resounding “yes.
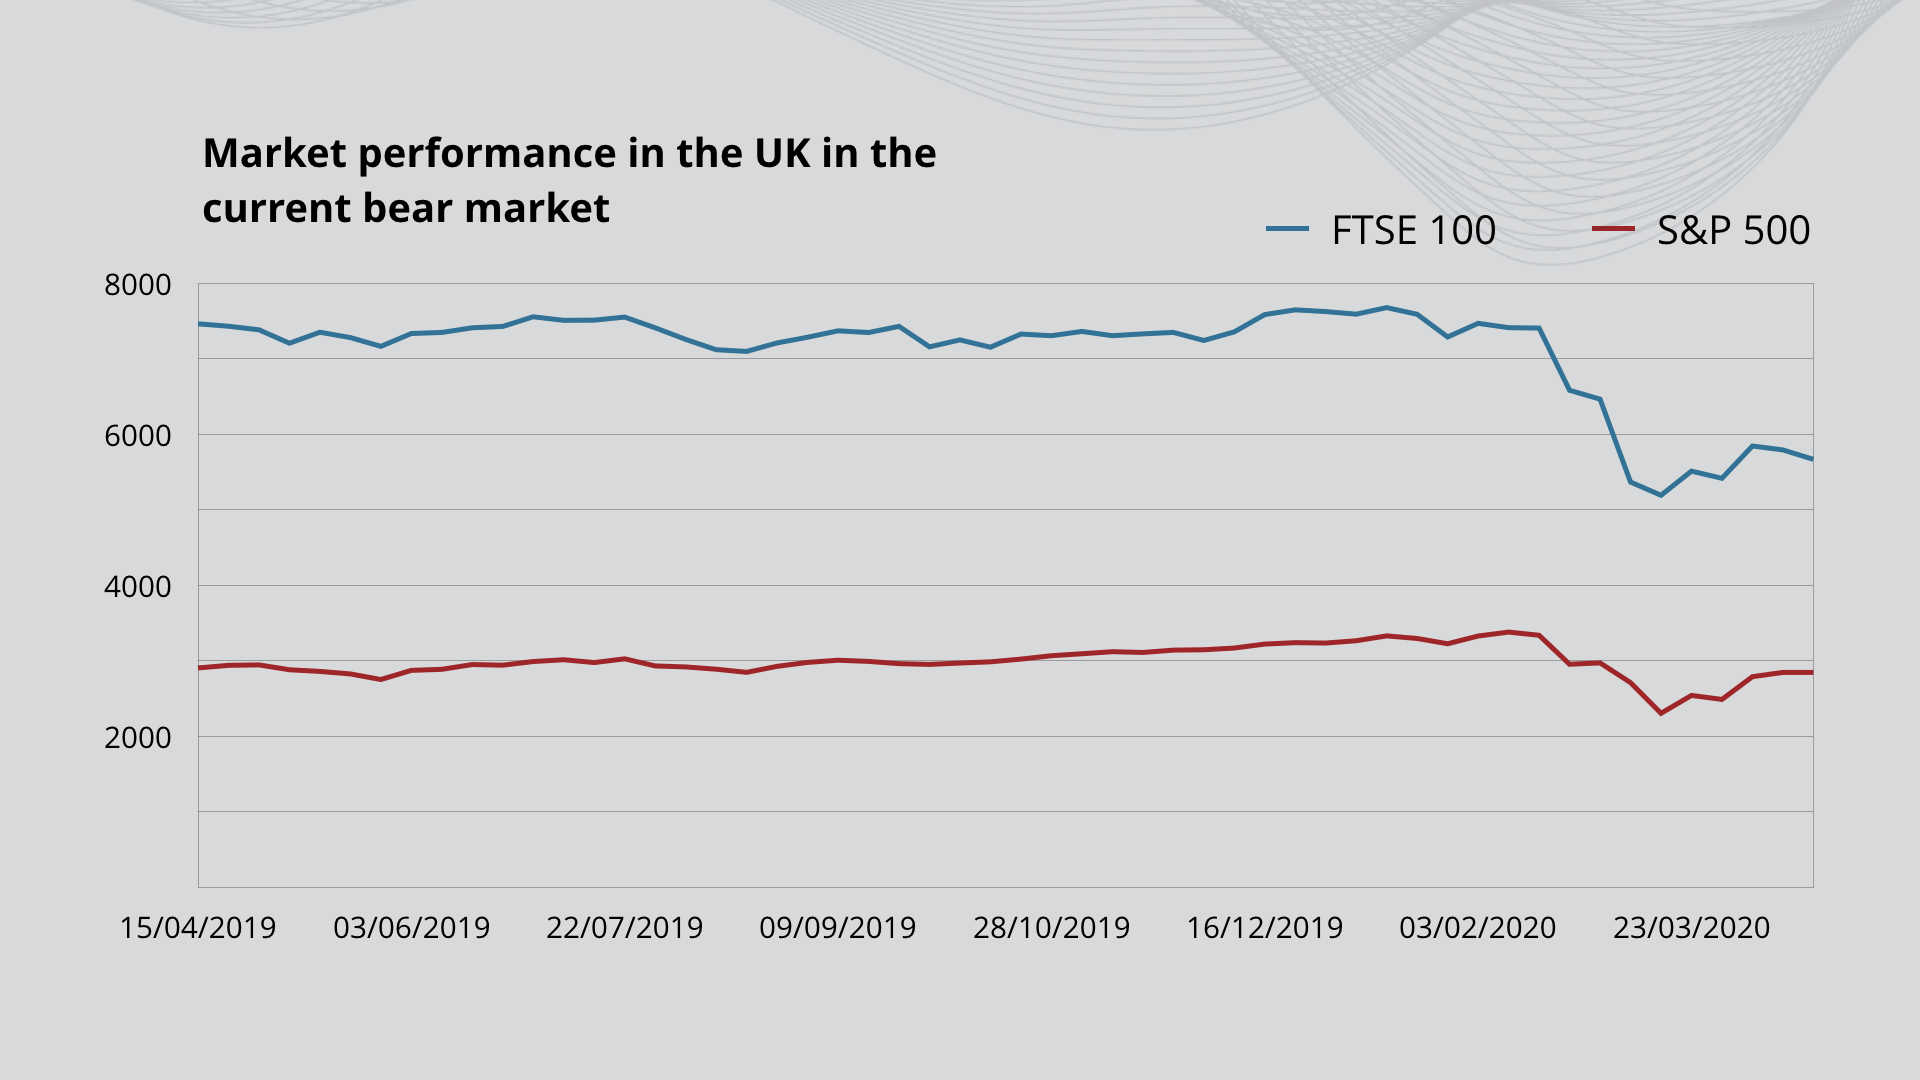 Source Data: London Stock Exchange, FTSE 100, Accessed 9 April 2020
Yahoo Finance, S&P 500, 52 Week Historical Data, Accessed 9 April 2020
Unpleasant – yes; uncommon – no
Whilst undoubtedly unpleasant, bear markets aren’t particularly rare. Indeed, we actually teetered on the edge of a bear market as recently as the last quarter of 2018, although equity markets rallied swiftly and 2019 closed out reasonably robustly. Prior to that, going back to the 1920s, we have experienced three significant market downturns – here they are, ranked in order of their severity:
- The stock market crash of 1929 – the ‘Great Depression’ crash – is considered to be the worst economic event in world history. It began on 24th October 1929, with skittish investors trading a record 12.9 million shares. On 28th October, dubbed ‘Black Monday’, the Dow Jones Industrial Average plunged nearly 13%, falling another 12% the following day; overall, it plummeted by 90% within a four-year period, having peaked at 381 on 3rd September 1929 and declined to 41 by 8th July 1932. Whilst a soaring, overheated economy no doubt contributed to the crash, many believe that the true catalyst was the introduction of a market innovation: buying ‘on margin’. This allowed investors – many with little in the way of financial acumen – to take a market position whilst only putting down 10-20% of the value represented, borrowing the balance from their broker. This over-confidence led to widespread over-valuations and the rest, as they say, is history. Many investors and ordinary people lost their entire savings, while numerous banks and companies went bankrupt. Whilst some continue to debate whether the crash of 1929 directly caused the Great Depression, there’s no doubt that it blighted the American economy hugely for many years.3
- The next worst, in percentage terms, was the global crash of 2008. The bursting of the US sub-prime mortgage bubble and the resultant collapse of Wall Street banking giant Lehman Brothers, which filed for the largest corporate bankruptcy in history on 15th September 2008 after failing to find a buyer, transformed a credit crunch into a full-blown worldwide crisis. The global financial system was on its knees and panic spread, leading to a 31% fall in the FTSE 100 in 2008, the largest annual fall in the 24 years since the index had been created.4 The bad news extended into 2009 as insurance giant AIG, which had been badly burnt by its exposure to credit default swaps, reported the largest quarterly loss in US corporate history5, and the UK officially entered recession. Having closed at 14,164 on 9th October 2007, the Dow Jones would fall 53% to 6,544 on 6th March 2009.6
- The third worst was the bear market of 1973. On 11th January 1973, the Dow Jones closed at 1,051 but, by 4th December 1974, it had fallen 45%. The largest contributory factor was Richard Nixon’s ending of the gold standard, which precipitated a marked rise in inflation as the dollar rose.7 1972 had been a strong year for the Dow Jones, with a gain of 15%, and 1973 was expected to be even better – indeed, only three days before the crash, Time magazine stated that it was “shaping up as a gilt-edged year”!8 The impact was even more pronounced in the UK, with the FT 30 losing 73% of its value during the crash. In 1974, the UK slipped into recession.9
Recession or correction?
The current downturn has unquestionably been fuelled by COVID-19, and we now find ourselves in entirely uncharted waters with nationwide lockdowns increasingly paralysing the global economy, causing extreme hardship for individuals, small businesses and larger corporates alike. With the prospect of an oil price war between Russia and Saudi Arabia also on the horizon, the immediate future is hard to predict and, whilst some might seek solace in the view that an out-and-out recession is by no means a certainty, it remains a distinct possibility.
Matters are not helped by the fact that equity markets – particularly in the US – had simply become frothy and complacent, having been buying narratives and ignoring the disciplines of fundamental analysis for some time. One need look no further than Apple by way of support for that contention – in 2019, its market capitalisation grew by $550 billion (or 74%), despite a fall in sales and net profit of $566 million (0.3%) and $1.9bn (3%) respectively.10 There were similar extraordinary rises by the likes of Xerox (up 90%), Target (up 95%) and AMD (up 151%). Looking at the US market as a whole, the S&P 500 index rose by nearly 30% in 2019, even though corporate profits barely climbed at all.11 In other words, almost all of last year’s gains were as a result of multiple expansion – the ‘p’ rather than the ‘e’ in the price/earnings ratio – and valuations derived in that way can’t be stretched forever!
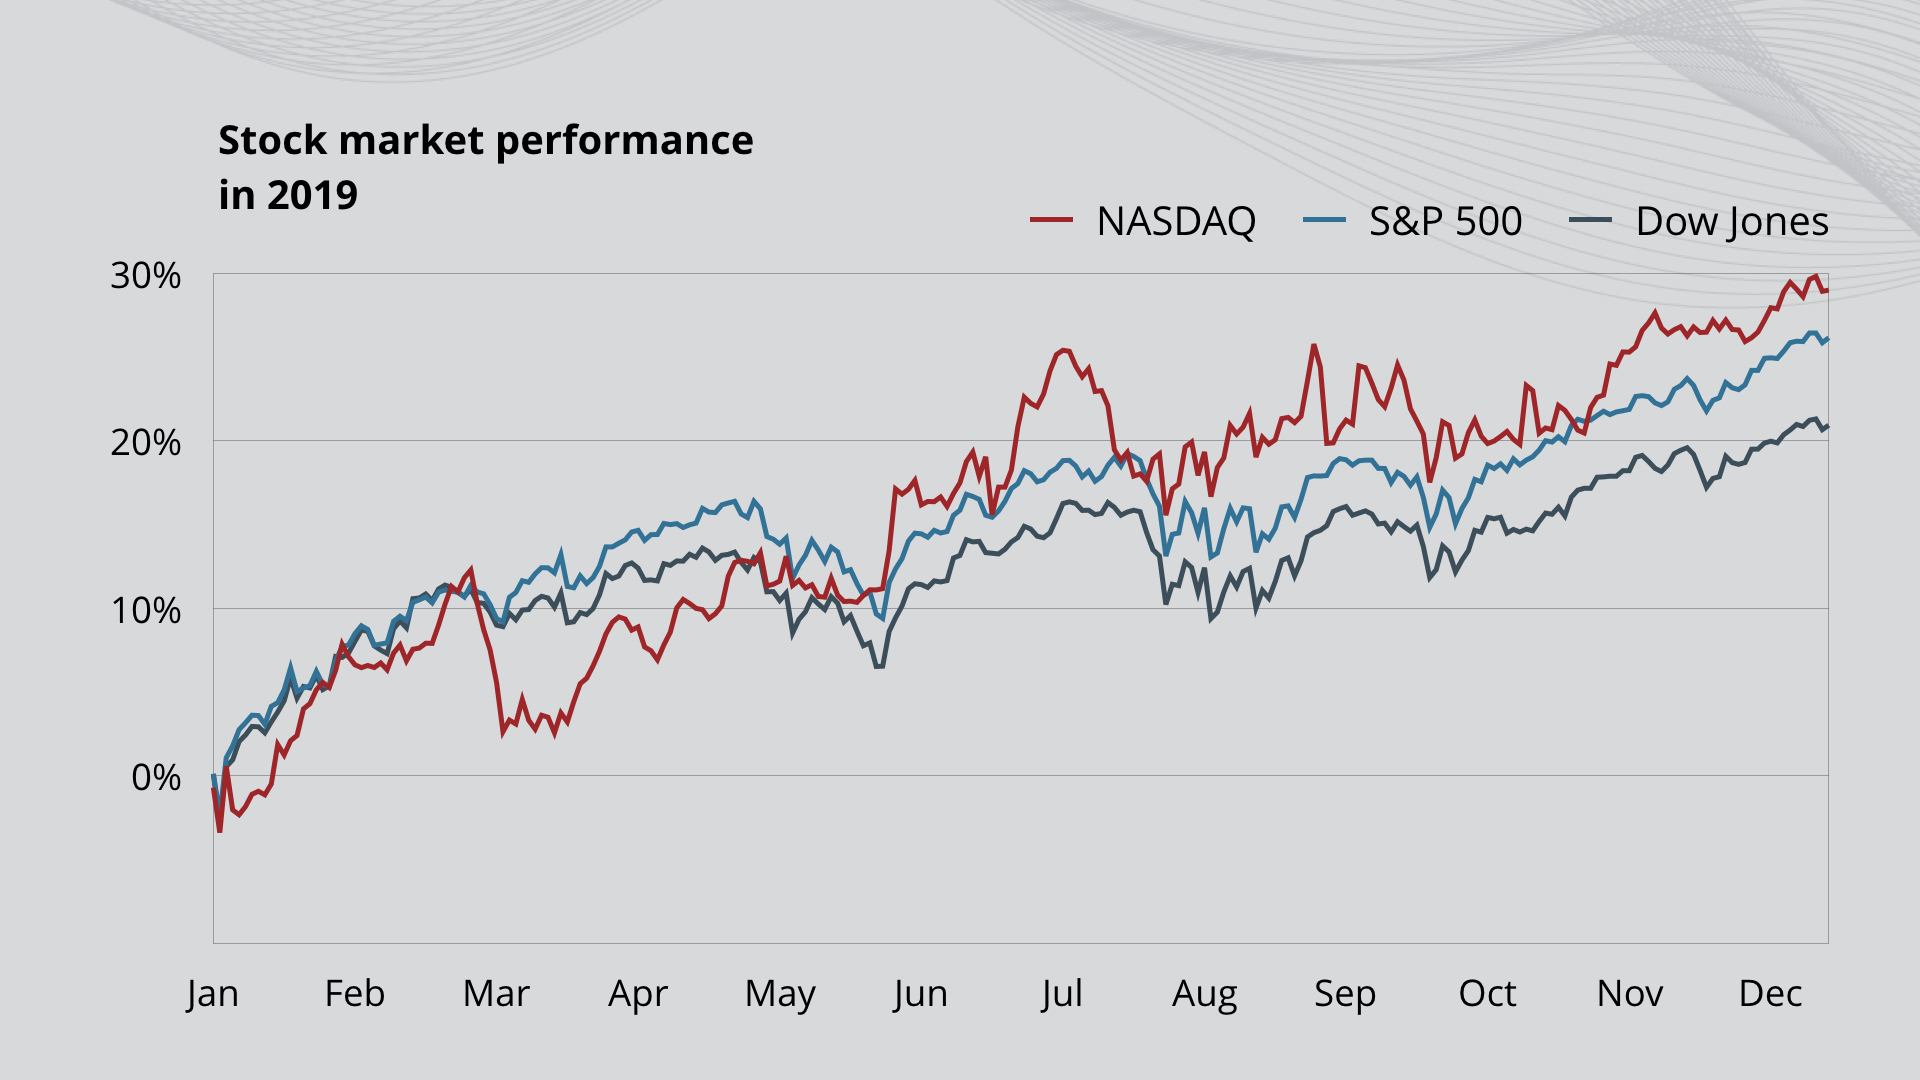
Source: CNBC, Stocks post best annual gain in 6 years with the S&P 500 surging more than 28%, 31 December 2019
Will there be a bounceback … and when will it come?
In an attempt to answer that question, one is reliant on historical data. As the table below shows, we have experienced 10 bear markets since the launch of the FTSE All-Share index in 1962, the average duration being just over a year and the average decline some 37%.
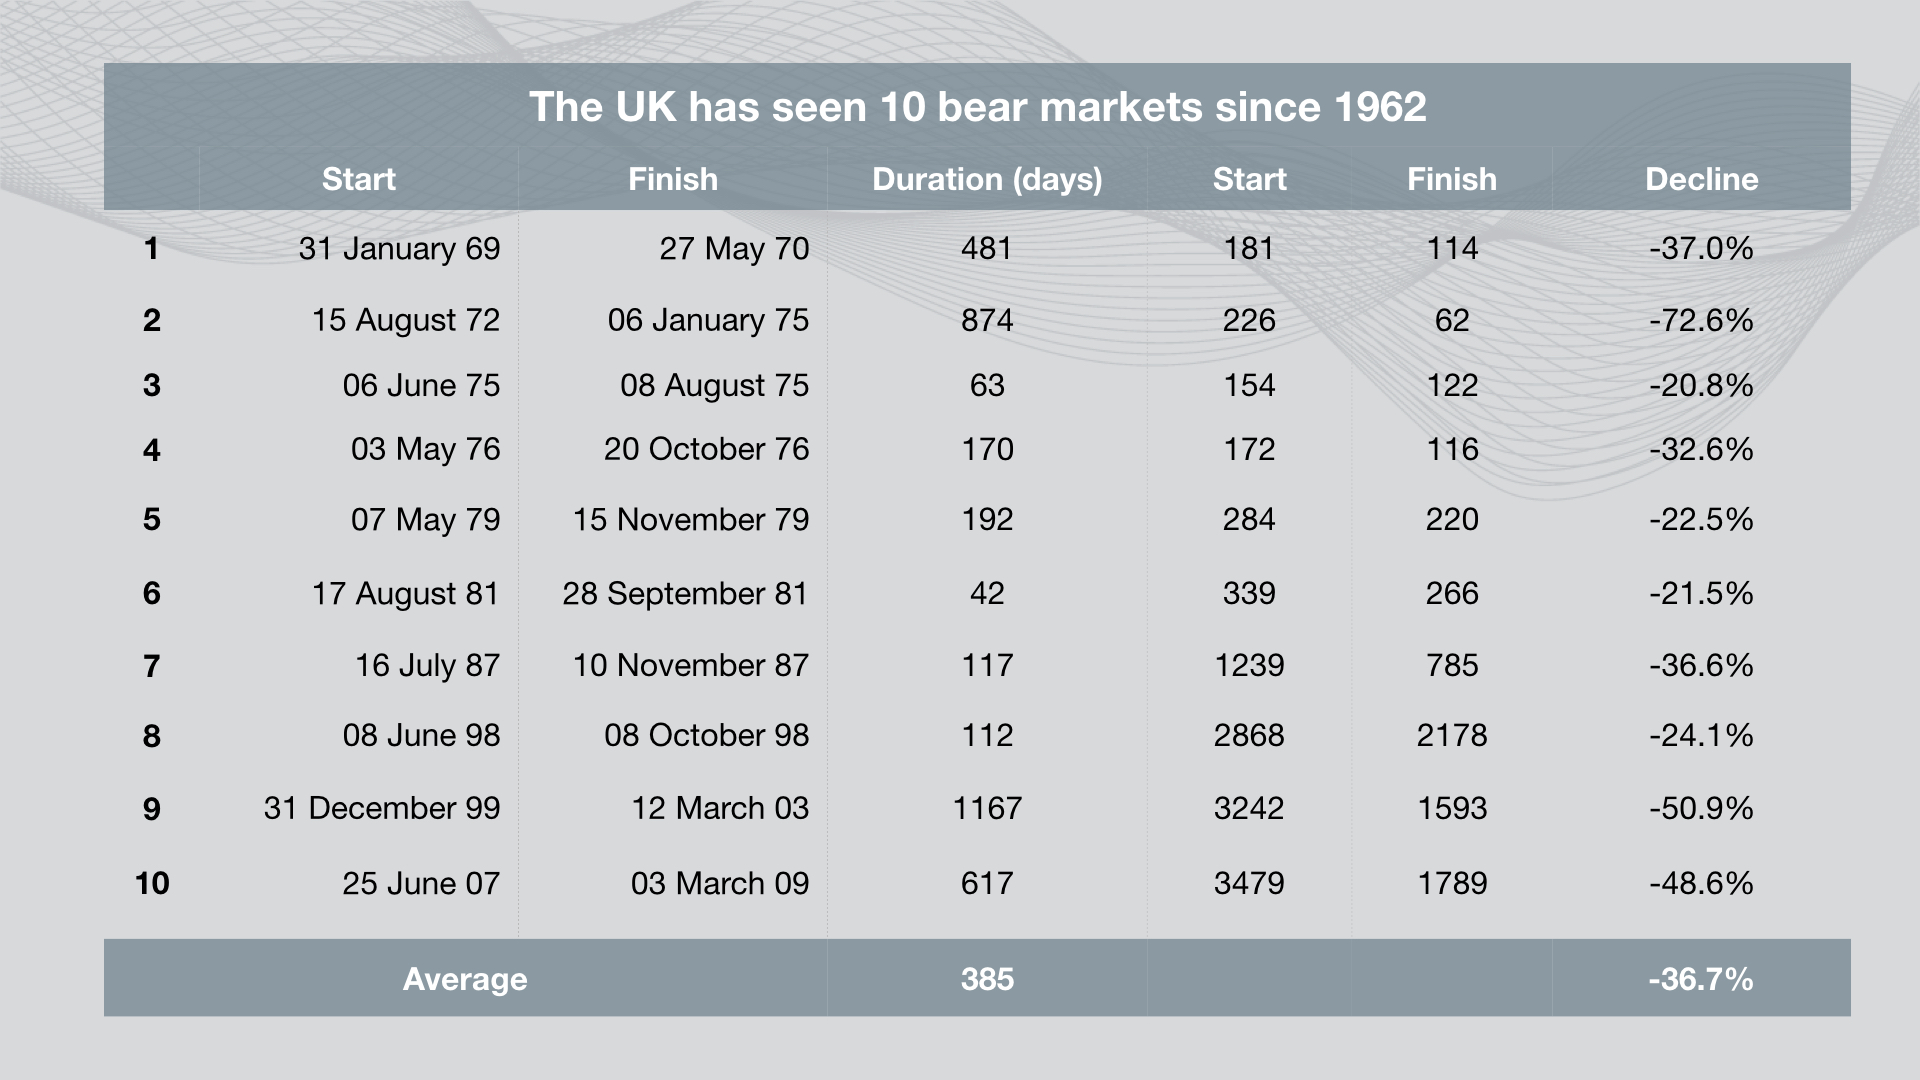
Source: Shares Magazine, Are stocks heading for a bear market?, 5 March 2020
Encouragingly, on all 10 occasions, the index has eventually recaptured any bull market gain it had previously achieved (see table below), the average recovery period being about 22 months.
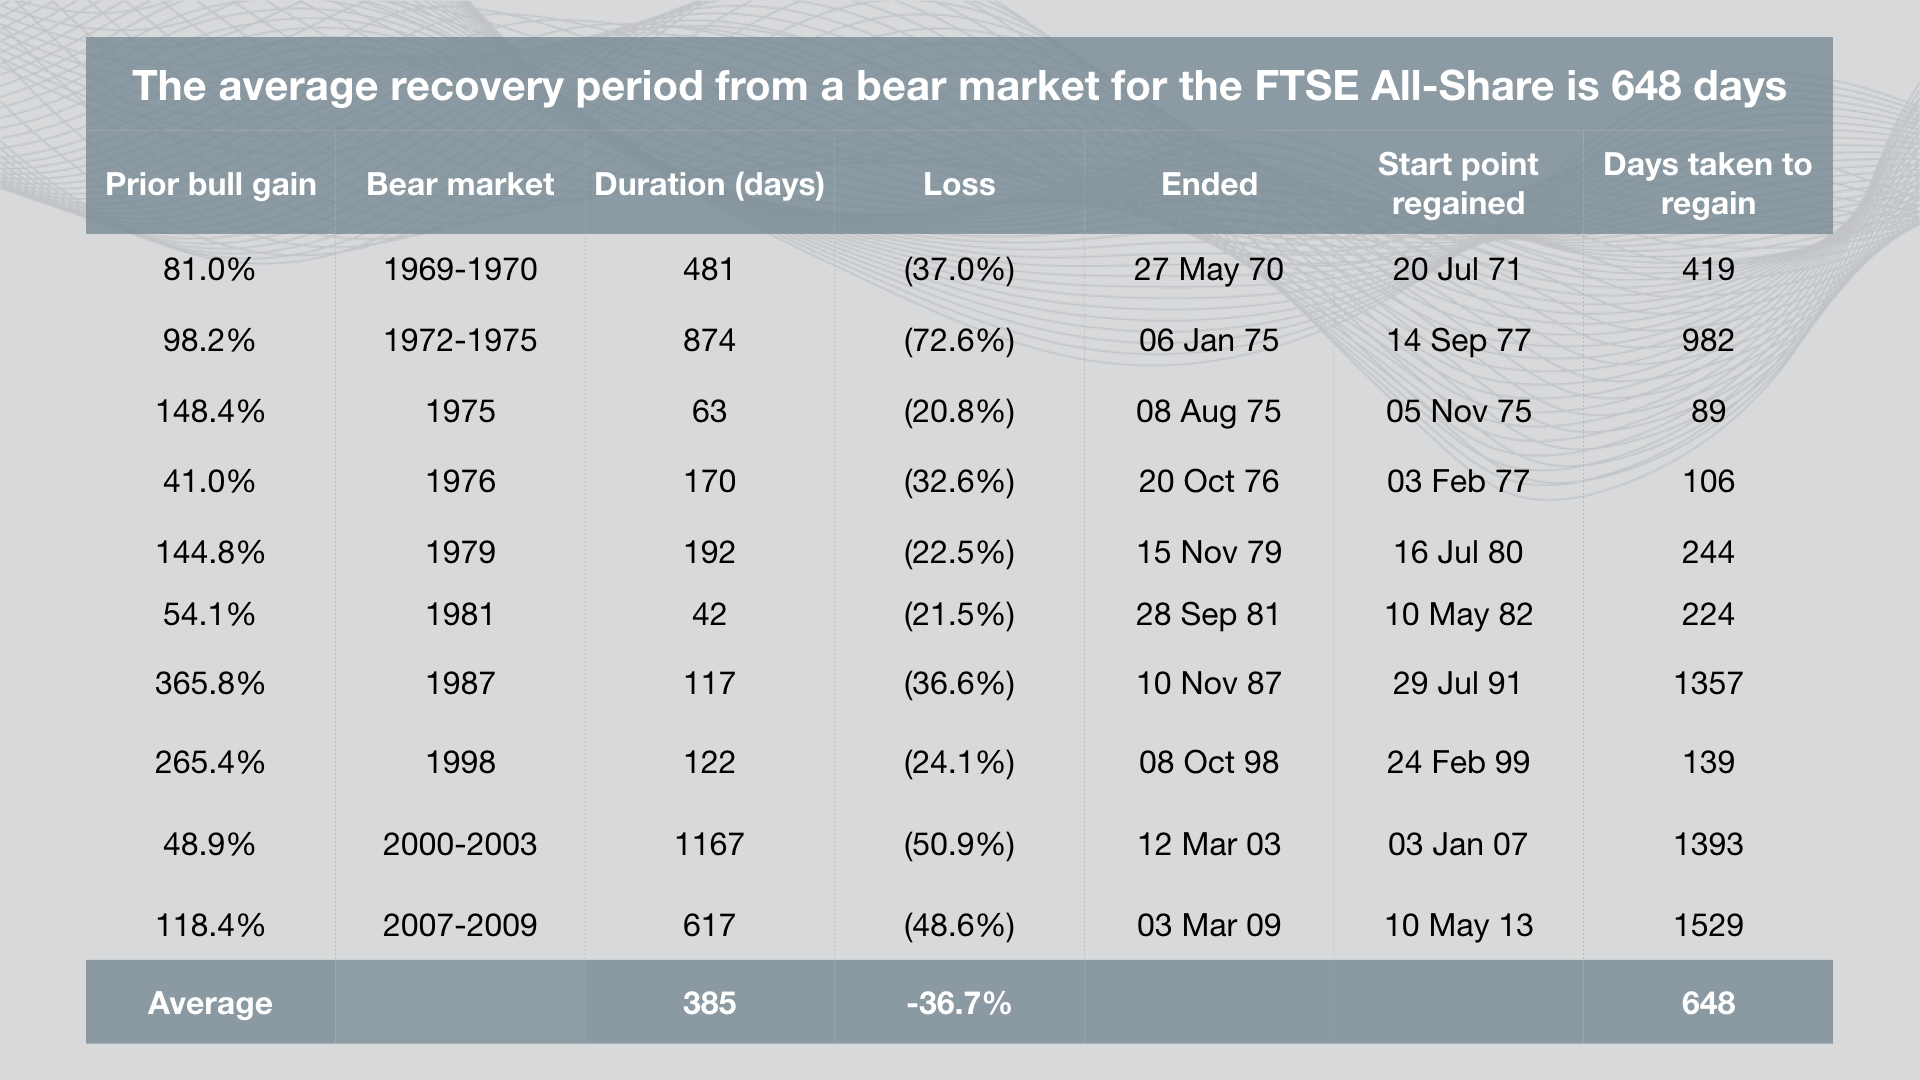
Source: Shares Magazine, How long does it take to bounce back from a bear market, 19 March 2020
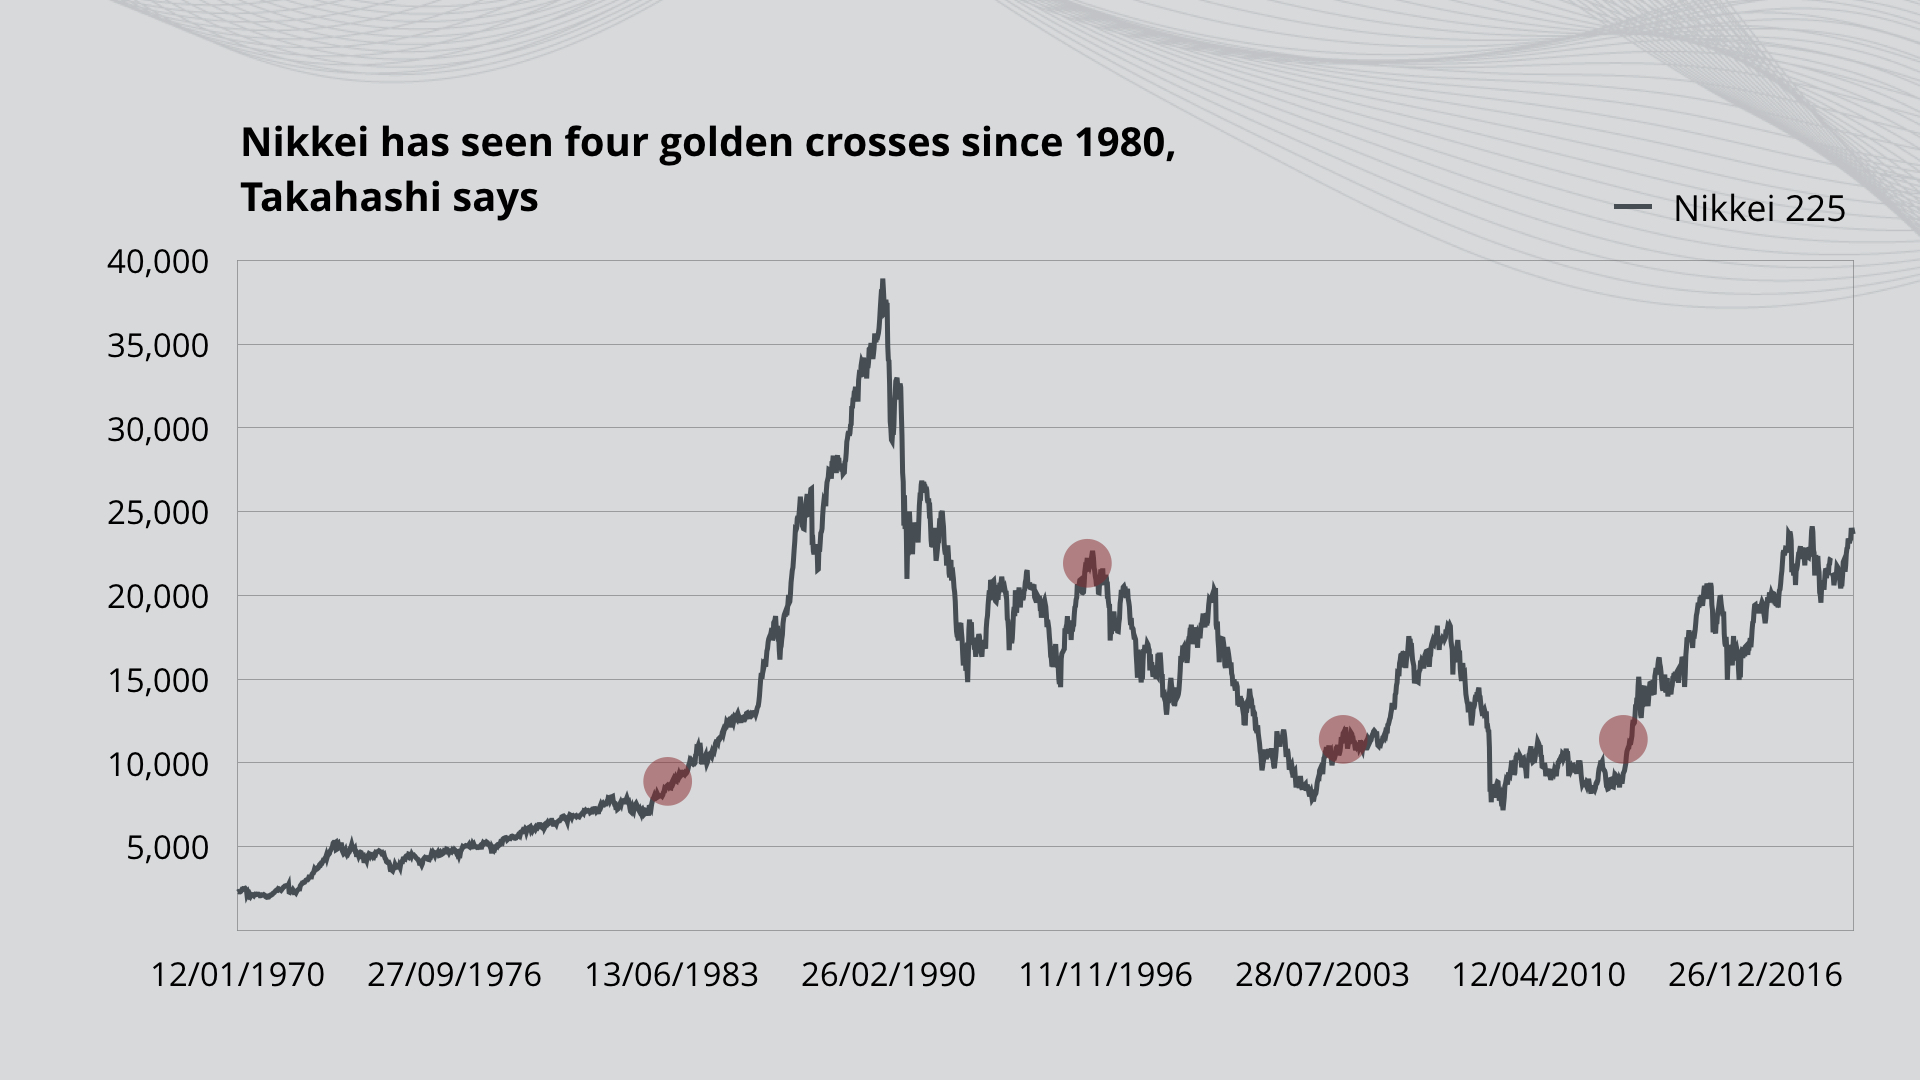
Source: MSN, For Japan’s Bullish Chartists, Stocks could rally like it’s 1989, 24 January 2020
What have we learned?
It’s far from easy to maintain one’s positivity in the teeth of a major market downturn but, as we’ve seen, there’s considerable encouragement to be had from the fact that the stock market has a strong history of recovery. With that in in mind, here’s some further food for thought.
Think long-term
Think diversification
Not all businesses will experience difficulties, and numerous opportunities for the skilled and judicious fund manager remain. The coronavirus shutdown has crippled the travel, transport and leisure industries – airlines, cruise lines, hotel owners, shipping businesses, cinema and theme park operators – and forced a halting of production at the ‘big three’ automakers, some are enjoying an unprecedented uplift in their fortunes and are well-positioned to return even stronger when the storm clouds inevitably begin to disperse. These sectors include supermarkets, streaming companies, telecommunication services and online retailers. Similarly, traditionally defensive sectors, such as healthcare and utilities, have once again proved their worth. For fund managers, it represents a strong stock-picking opportunity, with many household-name valuations having become markedly cheaper.
Think dividends
To borrow a quote from the ‘Sage of Omaha’, Warren Buffett: “We have no idea – and never have had – whether the market is going to go up, down, or sideways in the near- or intermediate-term future.” However, at Janus Henderson, we remain firm in the belief that, over the longer term, investors’ patience will be well-rewarded.
Bear market – A financial market in which the prices of securities are falling. A generally accepted definition is a fall of 20% or more in an index over at least a two-month period. The opposite of a bull market.
Bull market – A financial market in which the prices of securities are rising, especially over a long time. The opposite of a bear market.
Diversification – A way of spreading risk by mixing different types of assets/asset classes in a portfolio. It is based on the assumption that the prices of the different assets will behave differently in a given scenario. Assets with low correlation should provide the most diversification.
Dividend – A payment made by a company to its shareholders. The amount is variable, and is paid as a portion of the company’s profits.
Equity – A security representing ownership, typically listed on a stock exchange. ‘Equities’ as an asset class means investments in shares, as opposed to, for instance, bonds. To have ‘equity’ in a company means to hold shares in that company and therefore have part ownership.
Gilts – British government bonds sold by the Bank of England, done to finance the British national debt.
Source:
1London Stock Exchange, FTSE 100, Accessed 9 April 2020
2Yahoo Finance, S&P 500, 52 Week Historical Data, Accessed 9 April 2020
3University of Notre Dame, The Stock Market Crash of 1929, Accessed 12 April 2020
4Brewin Dolphin, Ten Years After the Financial Crisis, 1 October 2018
5NY Times, A.I.G. Reports Loss of $61.7 Billion as U.S. Gives More Aid, March 2009
6NYSE, Dow Jones Industrial Average History, Accessed 12 April 2020
7FiendBear, Dow Industrials: 1973-1974 Bear Market, Accessed 12 April 2020
8Time Magazine, A Gilt-Edged Year for the Stock Market, January 1973
9BBC News, Reading the stock market, Accessed 12 April 2020
10Yahoo Finance, Apple Inc (AAPL) History, Accessed 12 April 2020
11CNBC, Stocks post best annual gain in 6 years with the S&P 500 surging more than 28%, 31 December 2019
12Bloomberg, For Japan’s Bullish Chartists, Stocks Could Rally Like It’s 1989, 24 January 2020
13The Guardian, FTSE 100 ends 2017 at new record high as global markets celebrate $9tn year, December 2017
14Yahoo Finance, S&P 500, Max Historical Data, Accessed 12 April 2020
15CNBC, JPMorgan says the stock sell-off is overdone and recession risk is overblown, 10 March 2020
16Brewin Dolphin, Ten Years After the Financial Crisis, October 2018