
As work, education and retail went virtual during the Covid-19 pandemic, a surge in technology and internet-related shares helped lift US indices to record highs in 2020. At some point, US tech stocks were more valuable than the entire European stock market for the first time in history.i With US stocks outperforming non-US stocks in recent years, some investors have begun questioning conventional investing wisdom – the role that global diversification plays in their portfolios. Some have even started asking the question, is diversification dead?
Lessons from history
While it might be tempting to focus on a single index, sector or market based on returns over a short period, events throughout history have highlighted why this might not be the best approach. We can start with the Nifty 50 era when a narrow group of stocks rallied strongly during the 1960s and early 1970s. The prevailing sentiment was that these stocks were meant to be “bought, not sold”, and investors were willing to pay any price. By the early 1970s, some of them were trading at incredible valuations (as shown in the chart below).
 Source: Jeremy Siegel, Valuing growth stocks: Revisiting the Nifty Fifty, AAII Journal October 1998
Note: References made to individual securities should not constitute or form part of any offer or solicitation to issue, sell, subscribe or purchase, and neither should be assumed profitable.
However, as we all know, irrational exuberance is always a harbinger of darker days to come. Against a backdrop of rising interest rates, high oil prices and political instability, the US market entered a bear market in 1973, and Nifty 50 stocks fell significantly. From their highs, some of the share price declines to 1974 lows were precipitous: Xerox (-71%), Avon (-86%) and Polaroid (-91%)ii. Fast forward to today, a similar picture has been unravelling, particularly with US growth stocks that have dominated US stock market returns over the last few years.
During the pandemic, Zoom (148x) and Snapchat (320x) were trading at valuations extreme even by Nifty 50 standards. However, since their respective pandemic highs, some of these growth stocks have taken a beating – Zoom (-87%), Snapchat (-83%), Paypal (-74%) and Meta (-53%)iii – driven unnervingly by a similar cocktail of events that brought Nifty 50 stocks to their knees. They say history is a great teacher, and though alarm bells about US valuations have been ringing for quite some time, not many have listened. This latest reversion is yet another reminder of the dangers of focusing on a narrow market segment and how a period of outsized returns can lead to an aggressive reversal.
For those still unconvinced, just look at the dot.com bubble, where year-after-year, high-tech start-ups – driven by speculative investing – outperformed companies with far better balance sheets and consistent profit records. The Nasdaq rose 90% in 1999 aloneiv. However, as the tech bubble imploded, cash-strapped start-ups became worthless in months, and by 2002 the Nasdaq had lost 77% from its peak. As an investor, you must ask yourself, can you deal with the level of volatility that comes with focusing on a specific market segment.
Global to what effect?
Even focusing on a single country can be problematic. The “lost decade” (2000-2009) is a prime example of why a globally diversified portfolio can shield investors from weakness in one country. During this period, the S&P 500 recorded one of its worst 10-year performances with a cumulative return of -9.1% as investors dealt with the fallout of the dot.com bubble and global financial crisis. However, beyond US large caps, conditions were favourable for global equity investors. Most equity asset classes outside the US generated positive returns over the decade.

Source: Bloomberg, as at 26/05/2022
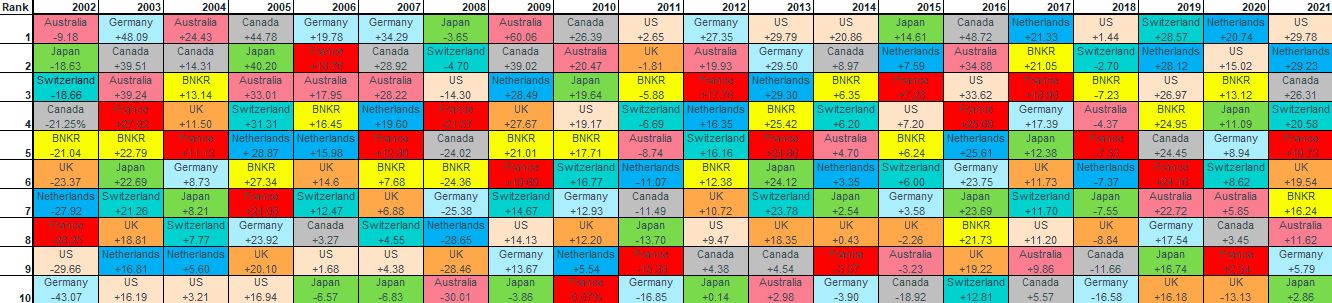
Another factor to consider is how difficult it is to predict single market returns and how a single year of outperformance might not necessarily translate to consistent outperformance. The adage “past performance is not a guarantee of future results” comes to mind. This is accurately reflected in the chart below. Such disparity in performance year-to-year highlights the difficulty of executing a strategy that relies on picking the best-performing country. However, more importantly, it reveals the benefits of diversification. Notice how competitively The Bankers Investment Trust has performed over the 20-years.
Click on the image below to see a full-size version.
 Preview modal-
BNKR – Regional Returns Chart
Source: Bloomberg as at 31/12/2001 to 31/12/2021
Note: Country returns are based on MSCI indices in GBP BNKRs return is ex par NAV Return
As 2022 gets underway, it is clear that uncertainty is now the new normal. Supply chain disruptions persist, and higher inflation has prompted central banks to raise interest rates and, more importantly, begin reducing their quantitative easing measures. All, if not most, of these factors, have been exacerbated by the war in Ukraine, causing further volatility in equity markets. Understandably, regions, sectors and businesses have all been impacted differently, posing the question – where can investors take refuge? The answer is simple – in diversification.
Diversified to the core
At The Bankers Investment Trust, we believe that diversification is now more important than ever. It is at the core of everything that we do. We have the flexibility to invest in any geographic region and sector with no set limits on individual country or sector exposures to provide sustainable long-term returns to our shareholders. Diversification can provide our shareholders with stable and consistent returns by offering a smoother, less volatile ride. This is especially important in periods of volatility when investors are often tempted to sell their assets. Even more than bear markets – emotional decision making is the greatest threat to an investor’s financial future.
It is a strategy that has served us well. Not only has the Trust paid dividends every year since 1894, but it has also increased dividends every year since 1966, a 55-year track record. The Trust has also outperformed its benchmark over the last 10 years despite the volatility that has characterised the period. While some might focus solely on the solid share price return, the compounding impact of consistent dividends has also contributed significantly (see table below).

Source: Bankers Investment Trust, Annual Report 2021
While, by its very nature, a diversified portfolio will never top the performance charts, it will not be at the bottom either. Diversification is not just about downside protection.
While owning growth/tech stocks for most of the pandemic was a good idea, the sharp reversal we’ve seen not only means these investors have incurred losses, but they have also missed out on the significant rally in value-heavy indices. In contrast, owning value-oriented markets such as the UK and Japan, alongside core growth equities, allowed us to benefit from that rotation.
It’s understandable that investors are frustrated by the underperformance of non-US stocks over the last few years and have rightly questioned the role diversification plays in a portfolio. However, it is at these moments that investors should see what lessons can be gleaned from history. After all, those who fail to learn from history are doomed to repeat it. We are one of the world’s oldest investment trusts, and there is a reason we continue to provide investors with stable and consistent returns.
i Source: U.S. tech stocks are now worth more than the entire European stock market (cnbc.com)
ii Source: Jeremy Siegel, Valuing growth stocks: Revisiting the Nifty Fifty, AAII Journal October 1998
iii Source: Bloomberg, as at 26/05/2022
iv Source: Bloomberg as at 26/05/2022
Price-to-earnings (P/E) ratio – A popular ratio used to value a company’s shares. It is calculated by dividing the current share price by its earnings per share. In general, a high P/E ratio indicates that investors expect strong earnings growth in the future, although a (temporary) collapse in earnings can also lead to a high P/E ratio.