Key Takeaways
- Defining Risk Premium
- Equity Risk Premium: Geographical and Over Time
- Risk Premia Overview
- Market Capitalization Risk Premium: SMB
- Momentum Risk Premium
Summary
This paper addresses several key philosophical and definitional issues related to risk premia investing. At the heart of this investment methodology is the idea that investors are not, per se, compensated for investing in assets, but rather they are compensated for assuming risks. Successful investing therefore requires both a clear understanding of the risks being assumed and a sound intuition with respect to why one should expect compensation for any assumed risk. Two functional definitions of “risk premium” are provided, as well as a list of specific examples across asset classes and an in-depth examination of two specific cases: Small Cap Equities minus Large Cap Equities (SMB) and Interest-Rate Momentum.
Introduction
At the heart of most investments is an exchange of an assumed risk in anticipation of some unknown but somewhat predictable payoff. For example, when buying a bond, one typically knows the payoff to maturity although there will be some uncertainty concerning the likelihood of default and some degree of price volatility prior to maturity. When buying a stock, one can use a quantitative or qualitative method for deriving a forecast and then “bound” the expectation by observing the stock’s historical or implied volatility (in the latter case, from the options market).
A well-designed portfolio therefore consists of a collection of assumed risks that respect a basic set of investment principles.
First, the assumed risks should be known to the investor. Second, there should be a well-founded expectation and measure of compensation associated with such risks. While these first two requirements seem obvious, it is frequently the case that even relatively sophisticated investors are often unaware of the risks they are assuming; moreover, they may also be unaware that they are receiving poor compensation for those assumed risks. Compensation for complex option structures and illiquid securities are examples of offenders in this category.
Third, an investor should seek to include a wide variety of risk exposures. Fourth, the assumed risks should be intuitively and measurably independent. As will be illustrated in this paper, an investment tool kit consisting of a broadly diversified collection of risk premia is a powerful ally in producing desirable return outcomes. Finally, assumed risks should be reasonably continuously monitored and steps should be taken to ensure that no single risk is allowed to dominate a portfolio’s returns.
Defining Risk Premium
As with any relatively new contribution to the finance “jargon-acular,” there is a real possibility of disputes developing due to a lack of common meaning when such terms are employed. In order to avoid any unnecessary confusion, a brief definitional detour is required.
What is a risk premium (the plural form being risk premia)? As it turns out, there is no universally accepted definition, but there are some definitions that are more rigorous, complicated and/or just plain better than others. Consequently, when using the term, it’s probably not a bad idea to give any interested party a preview of intended usage.
One relatively common and potentially useful definition is presented below as Equation 1.
Equation 1: E[U(ra)] = U(rf + Π)
The letter E refers to expected, U to utility, ra to risky asset, rf to risk-free rate and Π to risk premium. Equation 1, therefore, simply states that the expected utility (happiness) of a risky asset is equal to the utility of the risk-free rate plus a transferred, assumed risk that you expect to be compensated for in the form of a premium. At first pass it’s a fairly straightforward definition. Things can, however, become more involved and beyond the scope of this paper when discussing the nature of utility and how expectations are formed.
A simple example of how this definition works should prove helpful. As 2012 came to a close, the yield on the U.S. 1-month T-Bill was approximately 0.10% (or 10 basis points), while the yield on the U.S. 30-year T-Bond was approximately 2.80% (280 basis points). Somehow these two differently yielding instruments existed in the market at the same time. Using Equation 1, we see that the explanation is simple. The utility that market participants get from holding a T-Bill that is yielding 10 basis points is equal to the utility of holding a more risky, longer duration (more volatile from a price perspective) T-Bond. The 270 basis point differential represents the associated risk premium. In brief, the market is providing an additional 270 basis points to compensate investors for the additional risk (price volatility) of the longer duration instrument – in other words:
Expected utility of risky asset (2.80%) = utility of risk-free rate (0.10%) + risk premium (2.70%)
A second common definition of a risk premium — specifically, the Equity Risk Premium — is presented below in Equation 2.
Equation 2: ERP = E(re) — E(rf)
ERP refers to the Equity Risk Premium, E to expected, re to return on equities and once again rf to the risk-free return. Equation 2 simply states that the Equity Risk Premium is the expected return of equities over the expected risk-free return.
Despite this straightforward definition, there is a great deal of debate concerning the characterization of this risk premium, including:
- How to forecast it
(supply vs. demand methodologies) - Why it exists
(efficient markets vs. behavioral explanations) - How to measure it
(for example, what risk-free rate to use)
Equity Risk Premium: Geographical Over Time
A great deal of empirical research has been conducted concerning the Equity Risk Premium. A notable study examined the prevalence of the Equity Risk Premium both geographically and longitudinally (over time). Examining data across 19 countries from 1900 to 2010, researchers were able to show that excess returns (equity returns in excess of both long- and short-term government bond returns) were substantial. Across 19 countries, over the examined time frame, equities outperformed T-Bills by an average of 4.5% and long-term government bonds by an average of 3.8%.1
Despite the relatively robust nature of this risk premium, researchers have observed significant variability both geographically and over time. In a related study that examined U.S. equity data from 1802 to 2010, the author demonstrated that there was significant time variability and a real possibility that, over even extended periods of time, equity investors would not always be rewarded for assuming the additional risk of an equity portfolio.2 The important takeaway from these studies is that investors should clearly understand that the assumption of risk does not always entail a higher payoff; these are risk premia, not simply premia!
Risk Premia Overview
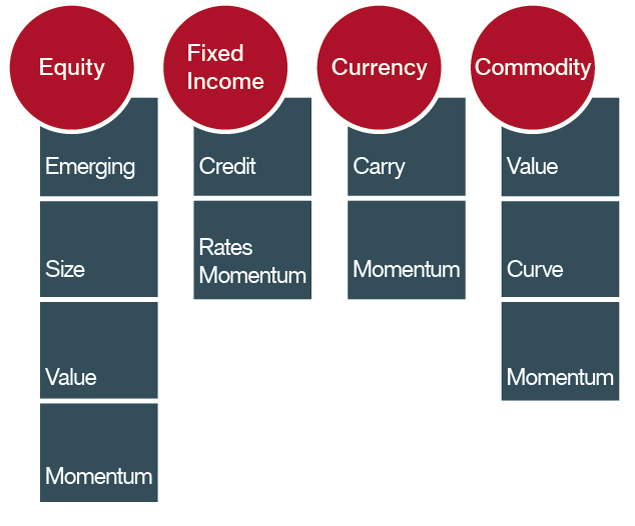
There is a multitude of additional and relatively statistically independent risk premia. A non-exhaustive list of risk premia is presented in Exhibit 1. These risk premia all share some basic properties. They are all well known, investable, scalable and well documented in both academic and practitioner literature, and possess a sound rationale with respect to the returns they have historically provided. Beyond the best-known risk premia (systematic equity risk — owning a diversified basket of equities, and credit — owning lower-credit fixed income securities), other risk premia have, in large part, been the private preserve of hedge funds. Their relatively robust nature has helped to bring into existence and drive the development of the multi-trillion dollar “alternative investment” industry. In reality, the term “alternative” is probably a gross misnomer as much of the “alpha” provided by many alternative investment managers is fairly standard systematic equity, default and duration risk.
Exhibit 1
Risk Premia Across Asset Classes

Market Capitalization Risk Premium: SMB
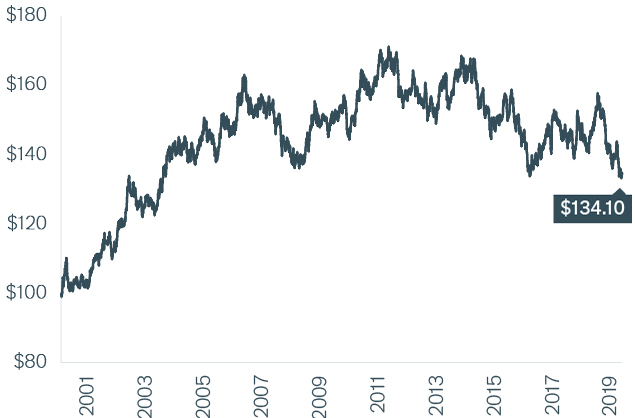
One of the stalwart risk premia of the equity investment community is “size.” In a landmark paper published in 1992 by Eugene Fama and Kenneth French, the market capitalization of equity securities was shown to explain a significant proportion of the cross-sectional variation in stock performance.3 More precisely, this risk premium — known by its acronym SMB (Small Minus Big, essentially long small-cap stocks and short large-cap stocks) — provided a relatively robust return to investors over the last several decades.4 A simple proxy, shown in Exhibit 2, covers a period of just over 19 years. It is produced by being long the Russell 2000® Index (the 2,000 smallest companies in the Russell 3000® Index) and short the Russell 1000® Index (the 1,000 largest companies in the Russell 3000®Index) in equal dollar amounts, rebalanced monthly with a targeted 8% annualized volatility.
Exhibit 2
Hypothetical Growth of $100 Invested in an SMB Strategy (1/2000 – 4/2019)

Source: Bloomberg and Janus Henderson Liquid Alternatives Group. As of 4/30/19.
Long the Russell 2000® Index and short the Russell 1000® Index, in equal dollar amounts, rebalanced monthly, with a targeted 8% annualized volatility.
The rates of return are hypothetical and used for illustrative purposes only. They do not represent the returns of any particular investment. The securities in this hypothetical example were selected with the full benefit of hindsight.
It is worth noting that further research on this topic has confirmed the core Fama-French results across industry sectors and geographically.5
The basic intuition for this risk premium put forward by most researchers asserts that portfolios of less liquid stocks tend to perform relatively poorly during market “stress” events; the typical return distributions of less liquid stocks tend to be more negatively skewed. An additional compensating return is thus required to induce investors to hold such securities. Regardless of the explanation, the empirical evidence of the existence of such a premium is quite compelling.
Momentum Risk Premium
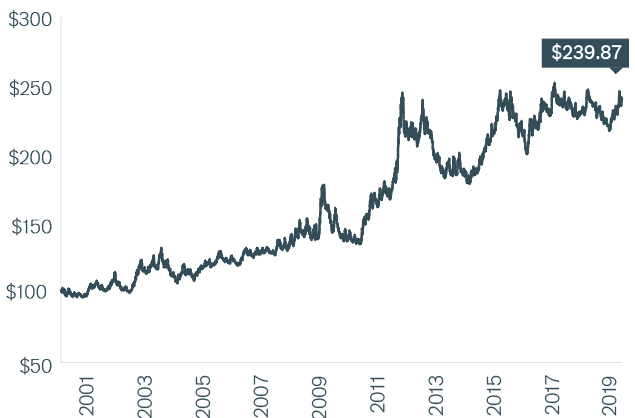
A second risk premium typically employed by Commodity Trading Advisors (CTAs), global macro investors and many equity investors is Momentum. Momentum investing seeks to take advantage of positive autocorrelation (also referred to as serial correlation) in the movement of asset prices. Basically, prices that have increased (decreased) the prior period have tended to increase (decrease) again in the following period. Momentum is typically harvested (invested in) by employing relatively straightforward filtering methods: quantitative techniques are used to establish long positions in upward trending assets and short positions in downward trending assets. A proxy for the returns associated with long-duration interest rate momentum is presented below. The returns presented in Exhibit 3 are based on a price-filtering strategy applied to two long-maturity note futures contracts, the U.S. 10-Year Note contract and the Euro-Bund contract (8.5 years to 10.5 years in maturity).
Exhibit 3
Hypothetical Growth of $100 Invested in a Momentum Strategy (1/2000-4/2019)

Source: Bloomberg and Janus Henderson Liquid Alternatives Group. As of 4/30/19.
Invested based on the use of a moving average crossover model applied to 10-Year Treasury Note contracts and Euro-Bund contracts.
The rates of return are hypothetical and used for illustrative purposes only. They do not represent the returns of any particular investment. The securities in this hypothetical example were selected with the full benefit of hindsight.
There have been a number of plausible and, in many cases, creative ideas set forth to explain this seemingly inefficient empirical feature of asset-price movement. Such explanations fall into two basic classes: behavioral and technical.
Some of the key concepts from the behavioral camp include:
- Conservatism, the tendency not to fully “price in” new information6
- Representativeness and Extrapolation, the tendency to mis-appraise the frequency of events based on small sample sets and subsequently see patterns where they don’t actually exist6
- Over-Confidence and Self-Attribution, the tendency to attribute successes to skill and failures to bad luck7
Factors from the technical camp include:
- Portfolio insurance strategies that attempt to control risk by replicating an option-like payoff on a security by buying it as it moves higher in price and selling it as it moves lower in price
- The slow diffusion of heterogeneous (non-standardized) information
- The autocorrelated behavior of exogenous participants in markets, most notably central banks which have a tendency to exhibit highly autocorrelated behavior in the movement of their interest- and exchange-rate targets
Research has shown that the presence of such behavioral biases and technical market distortions has created potentially exploitable opportunities for managers who are able to rigorously employ relatively straightforward price filtering techniques.
There are, however, at least three important provisos that investors should bear in mind if adding Momentum as a risk premium to an investment portfolio.
First, Momentum is not, per se, an asset allocation; rather it is a risk allocation that exists across asset classes. This is an important distinction as investing in Momentum across asset classes will not necessarily lead to any real diversification (within a selected basket of momentum investments). It is a fairly well known risk of “diversified trend following” that major market reversals in seemingly unrelated assets — such as commodities, currencies and fixed income – have tended to occur in close proximity, frequently on the same day.
Second, Momentum strategies have often performed poorly during market reversals. While Momentum strategies can prove helpful as a diversifying investment over longer periods of time, they actually tend to exacerbate losses occurring in other areas of a portfolio during market reversals due to the highly “path-dependent” exposures they create. As markets are moving up, Momentum investments tend to be long the market and therefore, if a sharp market reversal occurs, they will typically suffer for some period of time along with other traditional long-only investments.
Third, investor behavior can serve to further denigrate the diversification potential of this risk premium. In many cases, due to the inability to directly execute such strategies or to evaluate the relative merits of momentum providers, or simply due to the desire to maintain “plausible deniability” in the face of investment losses, many private and institutional investors are piled into a small collection of Momentum providers. The effect of this is to produce investment portfolios that are driven by the relative liquidity of the underlying asset classes rather than other criteria. For example, a CTA managing billions of dollars is likely to have the bulk of its returns driven by fixed income autocorrelation simply because that’s the place where large amounts of capital can be deployed. While this can be a helpful exposure during periods of market stress, when global interest rates are on hold for an extended period of time, such Momentum managers would likely bide their time buying high and selling low, a point that would probably not be lost on many unsatisfied investors.
Conclusion
Over longer time horizons, an investor’s ability to identify and harvest statistically independent risk-factor exposures (risk premia) can serve to enhance performance outcomes, provided that no single risk factor is allowed to dominate a portfolio’s return outcomes. Risk premia investing provides a framework for pursuing that goal. In the wake of other disastrous investment outcomes experienced by most investors in 2008, there is an increasing awareness that investors pursuing this goal are not compensated, per se, for asset allocation; rather they are compensated for the risks they assume.
As previously noted, there is a variety of useful risk premia that extend well beyond simple “long-only” asset allocations. While a detailed discussion of all such risk premia is beyond the scope of this paper, additional reader research is highly recommended. A select list of available resources is provided below.
- Dimson, Marsh and Staunton. Equity Premiums Around the World, From Rethinking the Equity Risk Premium, Research Foundation of CFA Institute, 2011.
- Arnott, Robert. Equity Risk Premium Myths, CFA Research Foundation Publications, Vol. 2011, No. 4, 2011.
- Fama and French. The Cross-Section of Expected Stock Returns. Journal of Finance 47 (2): 427–465, 1992.
- For approximately 60 years of daily return data on this risk premium, see Kenneth French’s website: http://mba.tuck.dartmouth.edu/pages/faculty/ken.french/data_library.html
- Hammond, Leibowitz and Siegel. Rethinking the Equity Risk Premium, Research Foundation of CFA Institute, 2011.
- Barberis, Shleifer and Vishny. A Model of Investor Sentiment, Journal of Financial Economics, 1998.
- Daniel, Hirshleifer and Subrahmanyam. Investor Psychology and Security Market Under- and Overreaction, Journal of Finance. 1998.
- Antonacci, Gary. Risk Premia Harvesting Through Momentum, Portfolio Management Associates, May 28, 2012.