

Download White paper
Investment trusts are a form of collective investment vehicle. They may invest in other companies’ shares – known as ‘equities’ – and/ or in a range of other assets, such as property, or fixed interest securities like government or corporate bonds. By enabling investors to pool their money with that of others, they offer exposure to a broad range of businesses, industries and territories that one would struggle to access as an individual. Investment trusts therefore offer all investors – even those of modest means – the benefits of a ready-made, diverse portfolio of assets.
From that perspective, investment trusts are not dissimilar to other types of collective investment vehicle – mutual funds, unit trusts, index funds, exchange traded funds etc. In one critical respect, however, they are fundamentally different. All investment trusts are established as public limited companies (PLCs) and so, oddly, the term ‘investment trust’ itself is something of a misnomer in that they are not actually constituted as trusts in the legal sense of the word. In common with all public limited companies, investment trusts are required to fulfil certain obligations in relation to their shareholders. For example:
- they are required to maintain an independent board of directors appointed by the shareholders to supervise their activities, to make key strategic decisions about the future direction of the trust and to safeguard the interests of the shareholders.
- the shares of an investment trust must be listed and traded on a recognised public stock market, such as the London Stock Exchange, in order that investors are able to verify the current price of the shares at any time and transact accordingly.
- in common with any stock market quoted company, investment trusts are required to produce audited accounts and to publish an annual report.
Why read an annual report?
For those who have never undertaken the task, getting to grips with the contents of a company annual report might seem daunting, which to a large extent explains why they tend to be so under-used. However, seasoned investors know it to be well worth the effort, in that it is the single most valuable piece of information available when one is looking to evaluate how strongly a business is performing – both in absolute terms and relative to its sector peer group.
Broadly speaking, a company annual report comprises two elements: first, a narrative section with observations and commentary from the chairman and chief executive, and possibly others, regarding the company’s activities and performance over the preceding financial year; and, second, the financial statements, i.e. the income statement, the balance sheet and the cash flow statement. Typically, an annual report will be read linearly, that is to say in the order just described; however, we would suggest that it can be more instructive to absorb the financial statements first, prior to allowing yourself to be influenced by the company management’s perspective on those numbers – in so doing, it’s possible to form your own, independently derived view without being unduly influenced by those who, with the best will in the world, will be keen to paint matters in the most favourable light. Most of the time, you’re likely to find yourself agreeing; on occasion, you may not!

With that in mind, this white paper has been designed to enable you to make the most of your forays into the world of annual reports by guiding you through the detail of the three main financial statements and how best to understand them. For reference, we have used the most recent publicly available financial statements from a household-name UK business, the clothes retailer Next. In this piece, we explain the financial statements that would commonly be found in the annual report of a trading company. In a subsequent piece, we’ll look closely at an investment trust annual report and illustrate both how it differs and the key things an investor should be looking for by way of clarification.
At this stage, a few general observations might be beneficial however.
- Timing is everything: Whilst being immensely useful as a repository of vital information, it’s worth remembering that an annual report is a ‘point-in-time’ view of a business, and that managements are at liberty to select the year-end date which best suits their narrative. Retailers, for example, typically choose a spring year end in order to capture the revenue peak of a busy Christmas season. Airlines tend to do the same, in that consumers tend to book and pay for summer holidays during the winter months.
- Think longer term: Stock market investing is not a short-term exercise and, by the same token, examining a single annual report for a company may tell you little about its prospects. Wherever possible, try to focus on the trends over a longer period rather than an isolated 12-month interval.
- Relative vs absolute: be sure not to look at the company’s performance in isolation, but rather evaluate it in the context of its key competitors – whilst a business may at first sight be performing well, its peer group may be performing rather better.
- Focus on what matters: Some business metrics are simply more illuminating than others. Growth in revenue is important, but profit growth is more important still. Similarly, profit is good but cash is better – not least because, from an accounting perspective, cash is undeniable whereas profit is capable of manipulation to the extent that, within reason, it can be whatever management wants it to be.
The Income Statement
The income statement – often also referred to as the ‘profit and loss’ statement – summarises the revenues, costs and expenses incurred by the business, and provides information about its ability to increase profits by growing revenue, reducing costs, or indeed both. The expressions ‘top line’ and ‘bottom line’ emanate from the income statement. The top line refers to revenue, in that it appears at the head of the income statement, as you can see from Next’s 2020 results in the table overleaf. Revenue is generally synonymous with sales, although it can encompass other revenue-generating activities, such as commissions or the provision of financing to customers.
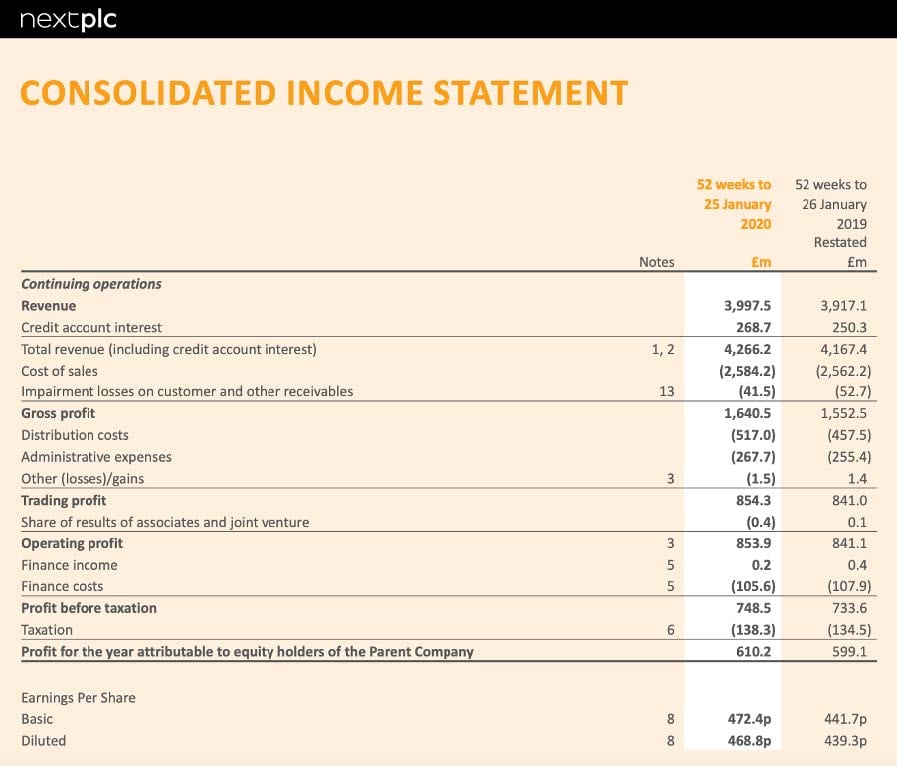
Source: Next PLC, Annual Report & Accounts, January 2020.
It’s interesting to note that Next has not been immune to the turmoil on UK high streets: as you can see from the table below, its online business grew almost 12% year-on-year, whilst sales from its retail stores declined over 5%.
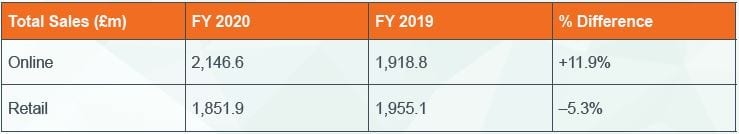
The next key element is gross profit, which represents the incremental value added to the business by the sale of the product or service. When looking at the profitability of the two sales channels independently, we again see that the online business is faring rather better, with profits up 13% for online but down 23% for retail.1 Dividing this gross profit figure by the revenue gives a gross margin – for Next, that gross margin is circa 38%.
We then move to operating profit, sometimes called ‘earnings before interest and tax’ or ‘EBIT’, which accounts for the related costs of generating that revenue, such as the cost of the goods sold, payroll, marketing and other operating expenses, tax, interest costs, and any other expenses sometimes referred to as ‘extraordinary’ expenses. (‘EBITDA’ is relevant where a business has tangible assets – depreciation and amortisation are then also deducted where a company has fixed assets, thereby reflecting the ‘wearing-out’ of that asset base over its useful life.)
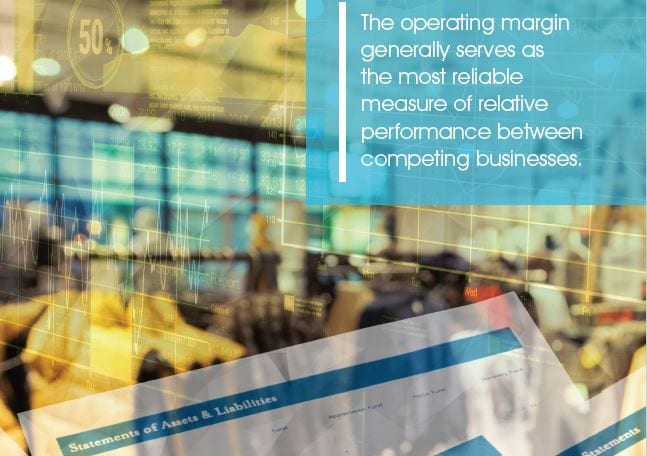
Dividing operating profit by revenue gives an operating margin, a figure which generally serves as the most reliable measure of relative performance between competing businesses in that it excludes the effects of interest or taxation. Interest costs may be significant, of course, where a business has resorted heavily to debt rather than equity financing. For Next, that operating margin is a healthy 20% – its two key online competitors, Boohoo and ASOS, show operating margins of circa 7% and 8% respectively, for example.2 A closer look at Next’s operating profit line reinforces the widespread carnage felt on UK high streets: whilst the online business has grown profits by 13% year-on-year to £400m, the profitability of the retail estate has plunged by 23% to just £164m.
Within the operating profit line, we see a finance charge of £105.6 million which is broken down in a note to the accounts as being comprised of £43.6m of debt interest on corporate bonds owned by investors, and finance costs on lease liabilities of £62 million. Thereafter, we are left with just the bottom line, which is the company’s net income – or profit after taxation – and which, unsurprisingly, is the final line on the income statement.
The Balance sheet
Balance sheet strength is an obvious attraction for equity investors but it is important to be clear as to the key factors which contribute to a robust balance sheet. Essentially, it’s a function of the ratio of assets to liabilities but the precise meaning of those two terms would benefit from deeper examination. At its simplest, assets are what a business owns and which enhance its value, whilst liabilities are what a business owes and which diminish its value. Let’s look initially at assets.
- Long-term assets, commonly referred to as ‘non-current assets’ or ‘fixed assets’, are typically physical in nature: land, buildings, equipment, plant etc. Purchased with cash or borrowed funds, they are then depreciated over their estimated useful lives. Intangible assets have come to represent a meaningful proportion of fixed assets, and would include intellectual property, brands, proprietary technology, patents and copyrights.
- Short-term assets, commonly referred to as ‘current assets’, include inventory, cash on deposit and outstanding invoices, in other words money owed to a company.
1. Source: Next PLC, Annual Report & Accounts, January 2020
2. Source: Boohoo PLC, Annual Report & Accounts, 2020 & ASOS PLC,Annual Report & Accounts, 2020
Tangible assets are easier to account for than intangible assets because they have a finite life and a demonstrable market value, whilst intangible assets have no pre-determined lifespan and are harder to price.
From an accounting perspective, intangible assets – advertising spend or the cost of acquiring patents, for example – are treated somewhat differently in that they are a revenue item within the profit and loss account and tend not to feature on the balance sheet. An obvious exception would be software companies, which capitalise their development costs such that they can appear on the balance sheet and amortise them over their anticipated useful life.
Finally, we come to goodwill – whilst also an intangible asset, it relates only to historic acquisitions and is treated as the premium over book value paid for the assets acquired. Goodwill is inextricably linked to the acquired asset, can’t be sold or purchased independently of it, and has an indefinite useful life, unlike intangible assets such as patents and licenses. It can, however, be written off; indeed, some of the biggest losses in history relate to the writing off of goodwill. The most famous relates to the 2001 acquisition by America Online of Time Warner for $165 billion, the largest ever at the time. The move was driven by a desire to capitalise on the accelerating convergence of mass media and the internet but, shortly afterwards, the dot-com bubble burst. In 2002, the company reported a net loss of $98.7 billion, the largest annual loss ever reported, after taking a fourth-quarter charge of $45.5 billion, mostly to write down the value of its troubled America Online division.
Let’s turn now to the other side of the balance sheet, liabilities. These consist of short-term liabilities, such as invoices yet to be settled (otherwise known as creditors), and long-term liabilities such as extended borrowing facilities. Incidentally, all balance sheets are required to ‘balance’ – hence the term: the difference between a company’s assets and its liabilities is made up by shareholder equity, i.e. the amount which would theoretically be paid to shareholders if it were wound up.
Balance sheet strength is a key factor in evaluating a business’s appeal from an investment perspective, although the issue is more nuanced than it might first appear since there are two aspects to balance sheet risk: liquidity and solvency. Liquidity relates to short-term risk, i.e. the ability to discharge current debts and to run the business operationally. Solvency relates to the ability to meet longer-term obligations, such as corporate bond redemptions, and is generally satisfied where assets exceed liabilities and, as a result, the business is in a position to meet all its long-term obligations in the event that it had to abandon its activities. Solvency is not mutually inclusive with liquidity however, in that the latter is a function of a business’s ability to manage its short-term cash flows: can it meet current running costs and service ongoing debt repayments with current assets?
Many will remember the 2007 images of Northern Rock customers queueing for miles to withdraw their savings from Northern Rock branches during the global banking crisis. The bank was unable to generate sufficient income to service its debts and, once the news broke that it was in dire need of government support, a run on the bank caused it to collapse. It was the first British bank in 150 years to fail due to a bank run.
Various measures – generally expressed in the form of ratios – are used to assess balance sheet strength, and therefore solvency and liquidity: for the former, the two most common are ‘debt to assets’, also called the leverage ratio, and ‘debt to equity’, also called the gearing ratio, whilst, for the latter, one most often sees the ‘current ratio’ and ‘quick ratio’, also known as the acid test.
An example may help. The table below shows the balance sheet data relating to two putative companies: Prudent PLC and Precarious PLC.
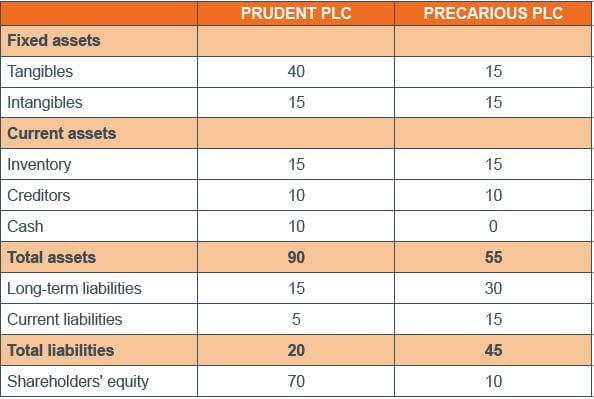
Even at first glance, it’s clear that Prudent possesses the stronger balance sheet but a closer look at the numbers reveals why and to what extent.
Prudent’s solvency, as measured by its debt to asset ratio is 15/90, i.e. circa 21% which is healthy; 79% of its assets are financed by equity therefore. The equivalent ratio for Precarious is 30/55, i.e. circa 55%, a less comforting figure – it may not face any immediate difficulties but higher leverage places a business at greater risk of failure. Comparing debt to equity ratios reveals a similar disparity. For Prudent, the figure is 15/70, i.e. circa 21% i.e. debt is covered by shareholders’ equity roughly five times whilst, for Precarious, the equivalent figure is a more worrying 30/10, i.e. 300%.
Moving now to liquidity and the current ratio – current assets divided by current liabilities – the figure for Prudent is a very encouraging 35/5, i.e. 7. For Precarious, the figure is 25/15, i.e. 1.7 – not quite so promising and indicative of potential problems. The quick ratio numbers – essentially the same calculation but ignoring the asset value of inventory, and therefore a more stringent measure – produces figures of 4 (20/5) and 0.66 (10/15) respectively, and so we see that Precarious may struggle to meet all its short-term commitments without resorting to a partial sale of inventory.
The Cash flow statement
There are seasoned investors regard the cash flow statement as a more reliable, and therefore more valuable, measure of a company’s profit¬ability than the income statement. As a result, they don’t spend huge amounts of time looking at a company’s profits – as we’ve said earlier in this piece, cash is cash whereas profits are subject to a degree of financial alchemy.
As the third component of a company’s financial statements, the cash flow statement describes how cash has been deployed during the financial year – both cash entering and cash leaving the business – and will therefore show the change in a business’s bank balance. Essentially, it measures both how well the company generates cash and how it manages that cash. It is often used in conjunction with the income statement and balance sheet in order to paint a holistic picture of the business’s financial wellbeing.
The three main components of the cash flow statement are:
- cash from operating activities.
- cash from investment activities.
- cash from finance activities.
Cash from operating activities includes any sources and uses of cash from business activities, i.e. how much cash is generated from the sale of a company’s products or services. Other elements would typically include interest payments, tax payments, payments made to suppliers of goods and services, employee salaries and rent.
Cash from investment activities includes cash related to the purchase or sale of assets – usually in the form of physical property, such as real estate or vehicles, and non-physical property, like patents – using free cash, not debt.
Cash from finance activities includes the payment of dividends, payments for share repurchases and the repayment of debt principal.
As can be seen, the cash flow statement is an important tool for assessing both the current profitability of a company, and its future prospects, in that it demonstrates an organisation’s ability to function in the short and long term, based on the levels of cash flowing into and out of it. It can also be used to predict future cash flow, which helps with matters of budgeting.

In conclusion
An ability to understand the financial position of a company – thereby identifying promising opportunities whilst avoiding undue risk – is a vital skill for any investor. Financial statements are therefore an essential conduit to that under¬standing by offering a window into the fortunes of a business which might otherwise be difficult to determine.
In this piece, we’ve looked at the financial statements within an annual report produced by a ‘typical’ trading business. In the follow-up piece, we review an investment trust’s annual report, explaining the key differences and the key areas for an investor to dig deeper.
Glossary
Depreciation – the reduction in value of a fixed asset over its useful lifetime.
Amortisation – the action or process of gradually writing off the initial cost of an asset.
Equity financing – the process of raising capital through the sale of shares.
Leverage – The use of borrowing to increase exposure to an asset/market. This can be done by borrowing cash and using it to buy an asset, or by using financial instruments such as derivatives to simulate the effect of borrowing for further investment in assets.
Gearing – A measure of a company’s leverage that shows how far its operations are funded by lenders versus shareholders. It is a measure of the debt level of a company. Within investment trusts it refers to how much money the trust borrows for investment purposes.
Liquidity – The ability to buy or sell a particular security or asset in the market. Assets that can be easily traded in the market (without causing a major price move) are referred to as ‘liquid’.
Disclaimer
For promotional purposes. Not for onward distribution.
Before investing in an investment trust referred to in this document, you should satisfy yourself as to its suitability and the risks involved, you may wish to consult a financial adviser. Past performance is not a guide to future performance. The value of an investment and the income from it can fall as well as rise and you may not get back the amount originally invested. Tax assumptions and reliefs depend upon an investor’s particular circumstances and may change if those circumstances or the law change. Nothing in this document is intended to or should be construed as advice. This document is not a recommendation to sell or purchase any investment. It does not form part of any contract for the sale or purchase of any investment. We may record telephone calls for our mutual protection, to improve customer service and for regulatory record keeping purposes.
Issued in the UK by Janus Henderson Investors. Janus Henderson Investors is the name under which investment products and services are provided by Janus Capital International Limited (reg no. 3594615), Henderson Global Investors Limited (reg. no. 906355), Henderson Investment Funds Limited (reg. no. 2678531), (each registered in England and Wales at 201 Bishopsgate, London EC2M 3AE and regulated by the Financial Conduct Authority) and Janus Henderson Investors Europe S.A. (reg no. B22848 at 2 Rue de Bitbourg, L-1273, Luxembourg and regulated by the Commission de Surveillance du Secteur Financier).
Janus Henderson, Janus, Henderson, Perkins, Intech, VelocityShares, Knowledge Shared, Knowledge. Shared and Knowledge Labs are trademarks of Janus Henderson Group plc or one of its subsidiaries. © Janus Henderson Group plc.
