
Six-month growth of the “global” (i.e. G7 plus E7) real narrow money measure tracked here is estimated to have fallen again in September, confirming July as a peak – see first chart. Allowing for an average nine-month lead, this suggests a slowdown in six-month industrial output growth from around April 2021.
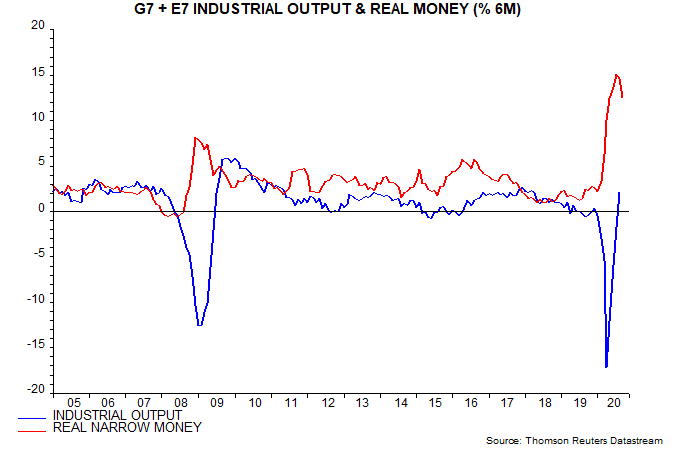
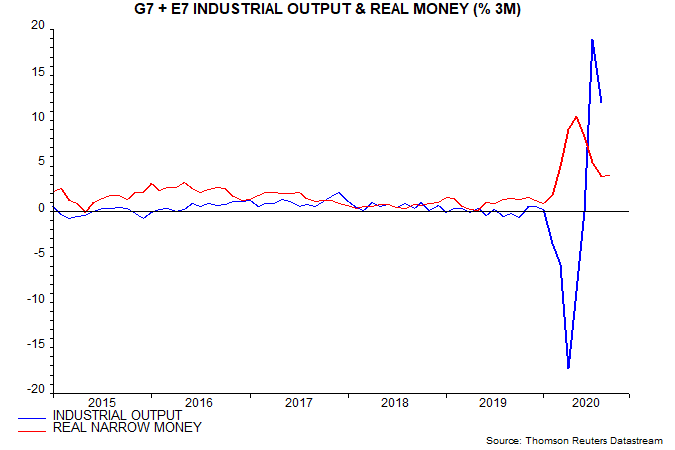
Three-month real narrow money growth, however, stabilised last month and remains above average – second chart. So money trends are still suggesting solid economic prospects for mid 2021.
Cycle analysis also argues against overemphasising recent monetary cooling. As previously discussed, the global stockbuilding or inventory cycle is now in a recovery phase, with a cycle peak unlikely until late 2021 at the earliest. Money-signalled economic slowdowns tend to be minor during stockbuilding cycle upswings. For example, falls in six-month real narrow money growth in 2012-13 and 2016-17 were followed by small and temporary dips in industrial output momentum, with significant weakness delayed until 2014 and 2018 after the stockbuilding cycle had peaked (following lows in late 2012 and early 2016).
Market prospects depend on not the level of (real) money growth but rather any deviation of actual growth from the demand for money based on economic needs. Assessment of current “excess” money conditions is complicated by recent extreme volatility in money and output data.
As previously reported, the gap between six-month growth rates of global real narrow money and industrial output has been informative about future equity returns historically, outperforming both 12-month and three-month growth gaps. A surge in the six-month growth gap from March signalled a V-shaped recovery in markets.
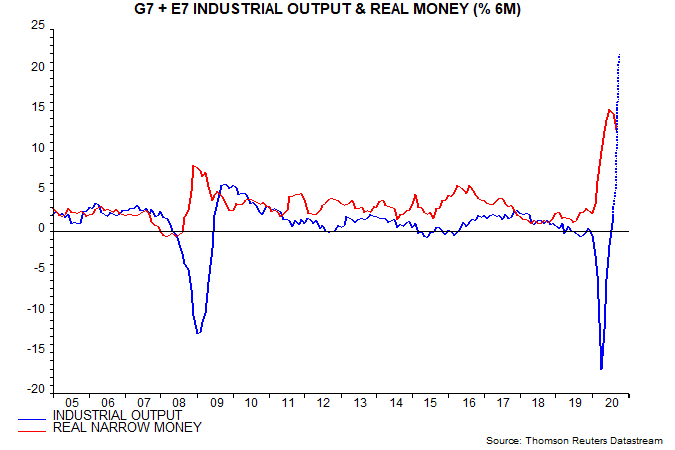
The six-month growth gap appears to have remained positive in September but will turn negative in October, reflecting an output growth base effect from a record 12.9% month-on-month fall in April – see third chart, in which the output projection assumes 0.8% monthly increases in September and October. A negative cross-over would normally suggest shifting defensively, based on the historical risk-return trade-off. The backtesting allowed for a two-month reporting lag, i.e. a negative October gap would suggest cutting equity exposure at end-December.
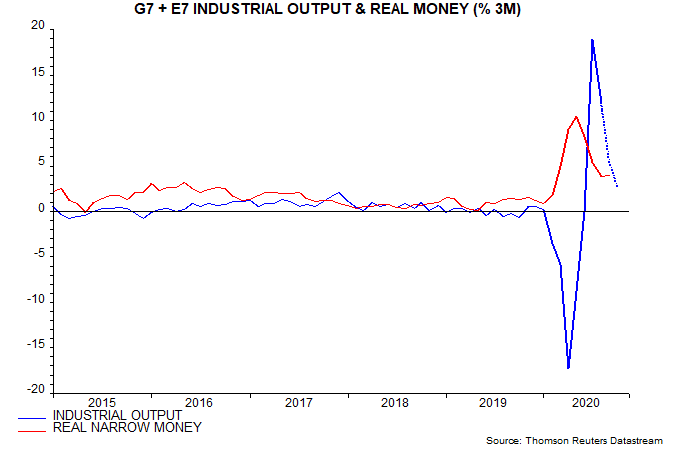
The negative signal, however, is very likely to prove short-lived. The three-month growth gap, which turned negative in July, is already starting to close as output growth normalises and could turn positive in October just as the six-month gap gives a cautionary signal – fourth chart.
A further consideration is that stockbuilding cycle upswings are usually associated with outperformance of equities and other cyclical assets, albeit punctuated by sometimes significant corrections.
A possible compromise could be to maintain but limit pro-cyclical positioning until the six- and three-month excess money growth gaps return to positive alignment and / or a market correction presents an opportunity to increase exposure at more attractive levels.