
Key takeaways:
- As QT comes centre stage, we assess the potential market impact, compare and contrast QT to QE and discuss how central banks’ approach to QT may have implications on bank rates.
- The route to balance sheet normalisation – such as active or passive – will be critical to how QT plays out in markets, and the Bank of England (BoE) will be a key one to watch.
- QT has the potential to have greater impact on credit spreads than on rates, but higher volatility is more of a given. Markets should not overlook the potential for a dovish pivot.
Views as of early June 2022.
The infamous backpedal
The UK and US monetary policy meetings in May reminded us of how central banks can backpedal if conditions necessitate. Future progress on economies’ tightening paths can be viewed with this in mind, as QT comes centre stage. The US Federal Reserve (Fed) kicked off its QT programme and raised rates by 0.5% but took 0.75% hikes off the table; the BoE raised rates as expected to 1%, but delayed revealing details on active gilt sales until August. The BoE had previously stated its intention to actively sell gilts when the bank rate reaches 1%; deferring gilt sales stands in contradiction to the rapid and surprising announcement earlier this year to sell corporate bond holdings in September. As it enters an experimental phase of QT, the BoE could be the main one to watch for markets. While central banks are likely to take different roads to QT, they all face the same challenge. Namely, to reduce balance sheets to build space for QE to tackle future (perhaps imminent) recessions. This is nothing less than a herculean task. Since the start of the pandemic two years ago, G4 central bank balance sheets have increased by more than US$12 trillion, with those of the European Central Bank (ECB) and Fed effectively doubling1.
Will QT be a substitute for rate hikes?
Central bankers have been careful to distance rate hikes and QT, except for the Fed – the maestro of the QT cast – which has explicitly linked balance sheet reduction and inflation. Theoretically QT should cool inflation, as it reduces broad money supply in the economy.
Both liquidity and policy can be used to tighten financial conditions. Ultimately, QT could mean bank rates end up lower than they would have otherwise been, and typically QT has elicited either a halt or backpedal from central banks. As demonstrated by the Wu Xia Fed Funds Shadow rate2, around 2% of accommodation was effectively added through QE and forward guidance through the pandemic (Figure 1). Reversing this huge increase in QE though would only have half the 2% impact of QE, effectively withdrawing only 1% of stimulus (partly as QT does not contain any forward guidance)3. In the UK, the haircut (the multiplier) will be larger to quantify QT from QE, as mortgages there have shorter tenors and so are less impacted by higher longer-term yields. The question is then how do we assess the market impact of QT without extrapolating a clear mirror opposite? Especially with little experience to judge it by.
Figure 1: Getting to pre-pandemic levels would be equivalent to 1% in hikes through QT
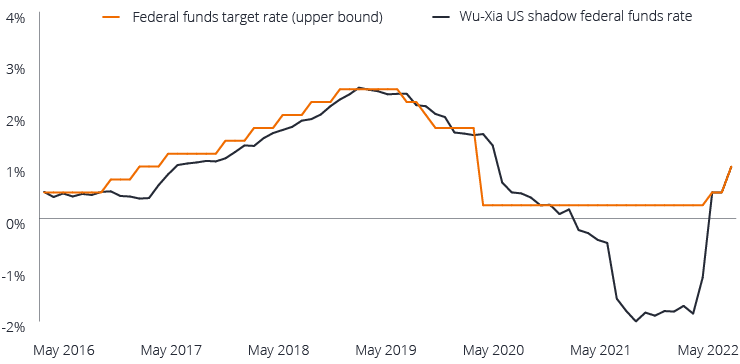
Source: Bloomberg, 23 May 2022. The Wu and Xia model uses one-month forward rates beginning n years hence, with n = 1/4, 1/2, 1, 2, 5, 7, and 10 years. Full details of the Wu and Xia model are available on the website of the Federal Reserve Bank of Atlanta.
Is QT set to impact markets in the opposite way to QE?
QE works best when used in two environments – where there is market dislocation and rates are at the lower bound. QE is therefore an effective sidekick (or complementary) to the leading actor – the bank rate – and signals that rates will be ‘lower for longer’. Conversely, QT works when it can be a predictable and gradual background variable – a supporting actor – and impervious to the bank rate moving at a quicker or slower pace in either direction. QT therefore does not have signalling power (rates will not be ‘higher for longer’). This allows the bank rate to remain the primary tool. That is … until it isn’t. This is where circular effects emerge as money market liquidity abruptly ended the last round of QT in the US. We know from history how higher interest rates affect economies, but we don’t for balance sheet reduction. We don’t even really know what QE did on its own, let alone the dreaded underling QT. The interplay – or push and pull – between the two players is an unknown and only becomes apparent in retrospect.
Active sales are a different show
Another unknown is the route to balance sheet normalisation, as the supporting passive actor of QT could morph into a prominent active role. Two roads to QT exist – a passive one where maturities aren’t reinvested, and one with active sales of bonds which accelerate the reduction. It would take four years for the Fed to see debt fall to pre-pandemic levels by letting it mature, compared to 8.5 years for the BoE (Figure 2). This reflects the gilt curve’s much higher weighted average maturity (WAM) and sporadic maturities – leading to a lumpy maturity path. The BoE may need to actively sell gilts to smooth and accelerate balance sheet normalisation, and so it’s the market to watch for the effects of this.
Central banks planning to sell bonds need to establish a framework to do so – they will be in direct competition with debt management offices (rather than easy tango partners during QE) and two active sellers risks impacting the normal running of government debt issuance. While balance sheets are indemnified against losses, optically, the Treasury sending money back to the central banks (as they sell bonds at a loss) at a time of fiscal prudence may incite some public backlash. It could call into question central banks’ reputation and independence. Without QE and with higher rates, high government deficits will be less easy to ignore. It’s a careful balancing act walking the tightrope of QT.
Figure 2: Lumpy and smooth – the UK versus US balance sheet reduction
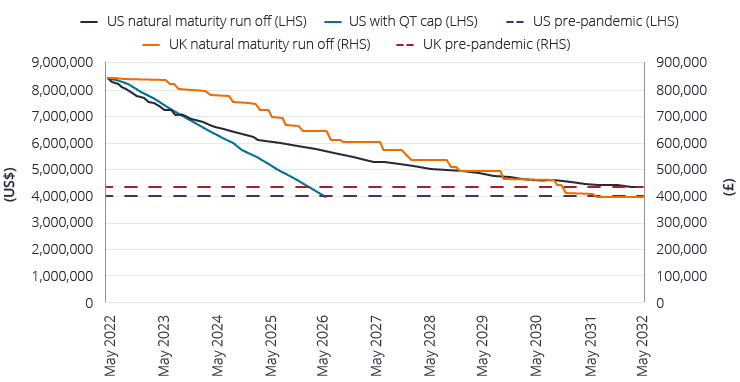
Source: Bank of England and New York Fed, 13 May 2022. UK natural maturity profile is only gilts (no corporate bonds); US is only Treasuries (no mortgage-backed securities). The US QT cap is the monthly run-off of US$95 billion (phased in over three months) by stopping the reinvestment of proceeds from these securities.
A rates or credit story?
QE has been blamed for depressing the term premium through demand pushing down long-dated yields. So, yield curves should also logically be steeper than they are if reflecting the risk of QT? While initial market reactions to QT announcements have often agreed with this argument, it’s transpired to be a myth over the long term. Curves have steepened as balance sheets have increased with QE (Figure 3).
Figure 3: QE steepens yield curves over the long term
Rolling 12-month change in global central balance sheets and US 2s10s slope
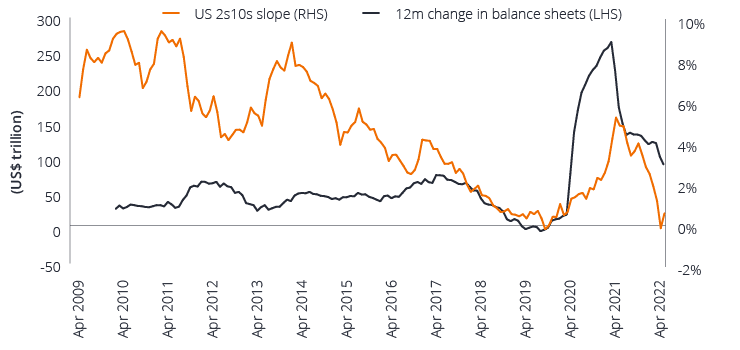
Source: Bloomberg, 29 April 2022. 2s10s slope = the difference between the 10-year and 2-year US Treasury yields.
In reality, it’s tricky to disentangle the specific market impact from rates and balance sheet announcements. In 2018, the risk aversion that blew out spreads in the US was likely, in our view, to be a function of hiking rates in a slowing economy rather than QT. What will be key to the ‘invisibility’ of QT is the state of the market, as it is more likely to breeze by in its supporting role if conducted in tranquillity, a specious concept given current market volatility.
QT may justifiably then impact spreads via sentiment more than rates, albeit steeper yield curves could result from active sales (driven by an influx of supply at certain areas of the curve for example). The stepping back of central bank buyers is significant for credit. The BoE’s commitment to sell its near £20bn corporate bond portfolio constitutes about 1.4 years of additional supply4. This equates to 8% of the sterling investment grade (IG) market5 and looks likely to disrupt this market as it is unwound. Similarly, the ECB holds 16% of the EUR IG market and so active selling of such bonds could be significant. In terms of corporate bond holdings, the average maturity of the ECB’s CSPP portfolio is around six years, versus 14 years for BoE’s CBPS and in perpetuity for the Fed’s SMCCF’s ETF holdings6. Clearly, longer maturity profiles drive the need for active sales.
Same inflation tide buffeting all boats
This time around the world is synchronised in its tightening efforts (unlike the last hiking cycle) against pervasive inflation and we do not know how co-ordinated action will impact on scale. QT paths may have started to be mapped out, but their durability is unknown. After all, no country has managed to unwind their QE programmes over the long term. More uncertainty comes from Japan – the reassuring world’s duration anchor – potentially being forced by its depreciating currency to widen its yield curve control band, which would be expected to push all global bond yields higher. Such particular circumstances highlight that the exact QT multiplier will be specific to the country. QT is expected to have more of an impact on the longer-dated part of the curve, so could tighten conditions more in countries tied to longer-dated borrowing costs, like the US. The Fed arguably has an advantageous position in that it already offloaded its corporate bond holdings last year.
Ultimately, central banks are reliant upon lagging, backward-looking indicators – such as employment and job openings as targeted by the Fed – to make decisions. Interest rates also act with large and variable lags. The faster you act – particularly in the face of such lags – the more likely the destination will change. There is a heightened risk therefore that central banks overtighten policy which quickly needs to be reversed. 2017 is the most comparable occurrence to now when the Fed had to reverse course and begin purchasing U.S. Treasury bills to maintain liquidity. Will the Fed’s second time trying QT be sustainable? With global central bank balance sheets all switching out of expansion mode, this will be unlikely.
The BoE has suggested it would change its QT path only if the bank rate was cut to the lower bounds. This reaffirms the primacy of the bank rate. However, we cannot see how in a downturn when a central bank is lowering rates, that it thinks it appropriate to still reduce its balance sheet – it would be akin to putting a foot on the accelerator and brake at the same time. Central banks want QT to be sustainable in a growth upturn as well as downturn – in our view, this will age badly and it’s more likely that QT and rates will work in the same direction.
Curtains down
As the curtains come down for the finale, we believe markets should not overlook the potential for a dovish pivot from the combination of rates and QT in the face of weaker global growth momentum, which could lead to a re-pricing of aggressive rate hiking expectations and lower terminal rates. Ultimately, we do not expect central banks to be able to tighten monetary policy as much as markets have priced in.
Central banks have a lot at stake to prove balance sheets can decline over time. Despite their ambition for QT to be cast as a supporting actor, it is unlikely to pass by unnoticed. Headwinds from the departure of a marginal buyer and higher rates may start to cause cracks in credit markets. Real yields moving higher into positive territory (which tends to occur in a QT/hiking cycle) are another concern for credit. Sentiment will be a key driver of spread vulnerability. Liquidity in government bonds has been tested recently with central banks stepping back from purchases, and the introduction of QT increases the likelihood of volatility remaining high for some time. A cautious approach to navigating markets with a razor focus on credit conditions and careful attention to the shape of QT and any hints of a pivot in policy feels sensible.
1 Source: HSBC, 7 March 2022.
2 This uses the term structure of interest rates to quantify the impact of such measures as QE when the policy rate is between 0 to 0.25%.
3 The Fed’s rule of thumb is that in a year’s time, US$1 trillion worth of QT would be roughly equivalent to a 0.25% rise in the fed funds target rate.
4 Relative to 2019 net non-financial issuance as we deem this year to evidence normal supply patterns.
5 As represented by the ICE BofA Sterling Corporate Non-Financial Index as at 18 May 2022.
6 Source: HSBC, 7 March 2022. The ECB’s CSPP (corporate sector purchase programme), the BoE’s CBSP (corporate bond purchase scheme) and the Fed’s SMCCF (secondary market corporate credit facility) outline the respective parameters for each central bank’s purchase of corporate bonds.
[jh_content_filter spoke=”fiii, noii, seii”]
Direct Investors

[/jh_content_filter]
[jh_content_filter spoke=”fiii, noii, seii”]
ipsum

[/jh_content_filter]