Securitised debt has been labelled by some investors as ‘opaque’ and ‘risky’. As part of an educational series into European securitised debt, we separate fact from fiction by considering the distinct characteristics that define the asset class and evaluate the risk-reward profile of the securitised sub-sectors against European investment grade corporate credit. We also explore how to assess ESG in securitised investments, tackling data challenges and value chain traceability as well as using engagement to encourage change.
Key features of European securitised debt
While the European securitised market comprises a range of structures with a diverse pool of assets, there are some common features:
- Real economy exposures: Given the nature of the underlying collateral, the European securitisation sector offers access to different consumer-driven and ‘real economy’ risks, diversifying from corporate credit. Examples include auto loans, credit card receivables and personal loans.
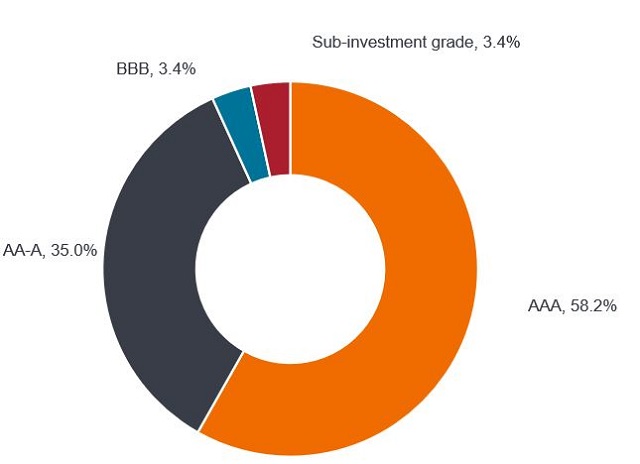
- High quality: The pooling of risk of the underlying loans and credit enhancement features results in an overwhelmingly high-quality market, reflected in a high proportion of the structures rated AAA (Figure 1). This compares to the European investment grade corporate bond market having a weighted average credit rating of A-1. Such structural protections, high asset quality as well as natural deleveraging from amortisation has enabled the European securitised sector to exhibit a very low default rate through economic cycles and periods of broad macro stress.
Figure 1: European securitised – a high-quality asset class

Source: Janus Henderson Investors, AFME, European securitised debt outstanding as at 31 March 2024. Based on Moody’s rated securities. For illustrative purposes only.
- Floating rate coupons: Coupons typically reset monthly or quarterly, moving in line with market interest rates (with a spread over prevailing cash rates). Thus, interest rate risk is somewhat negligible.
- Higher credit spreads: Supply and demand mechanics can result in higher credit spreads than in traditional corporate credit. Less favourable regulatory treatment of the underlying assets on bank balance sheets encourage securitisation to offload such assets. Similarly, banks use securitisation as a funding tool, freeing up capital for other lending activity. Both these factors are supportive for supply. Conversely, a perceived complexity premium, exclusion from passive indices and less frequent use in institutional liability hedging strategies hamper demand.
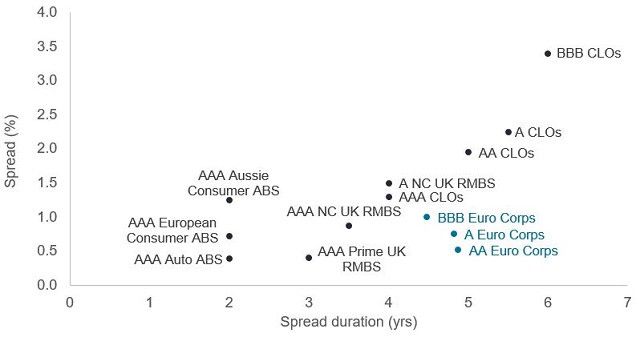
Collectively, these features result in a risk-reward profile that is distinct from what can be found among corporate bonds. Securitised asset classes typically offer higher credit spreads while taking lower spread duration risk and exhibit better credit quality (Figure 2).
Figure 2: A distinct risk-reward profile versus corporate bonds
Securitised and investment grade corporate bond spread versus spread duration profiles
Source: Janus Henderson Investors, Bloomberg, Citi Velocity, Morgan Stanley, JP Morgan, as at 31 August 2024. Weighted average lives for securitised asset classes are used to estimate their spread duration. A Euro Corps = ICE BofA Single-A Euro Corporate Index, AA Euro Corps = ICE AA BofA Euro Corporate Index, BBB Euro Corps = ICE BBB BofA Euro Corporate Index. NC = non-conforming. Yields and spreads may vary and are not guaranteed.
Addressing ESG in securitised
Another misconception around the securitised sector is that the ‘opaque’ structures make ESG analysis impossible. The nature and structure of the European securitised market does mean analysis across multiple layers of a transaction, while it is challenging to gather standardised ESG metrics. This requires a specialist approach to ESG analysis. Traditional data providers currently have very low levels of data coverage in the securitised market. This is a particularly prevalent issue when it comes to capturing climate change data. To address this challenge, we are working to promote standardised disclosures from issuers, and to improve the quality and depth of disclosures from across the industry. Given these challenges, it is therefore important to develop proprietary frameworks that enable us to gauge the ESG profiles of these investments using loan and collateral data for the assets financed by our securitised investments.
As we develop our frameworks to measure carbon in securitisation markets, we continue to engage collaboratively with international agencies such as the Partnership for Carbon Accounting Financials (PCAF) and European Leveraged Finance Association (ELFA), as well individual issuers across residential mortgage-backed securities (RMBS), auto asset-backed securities (ABS) and collateralised loan obligations (CLOs) to obtain additional data to enhance the accuracy of our carbon estimates. When deciding on where and with who to engage, it is important to identify where we, as investors, have most direct influence.
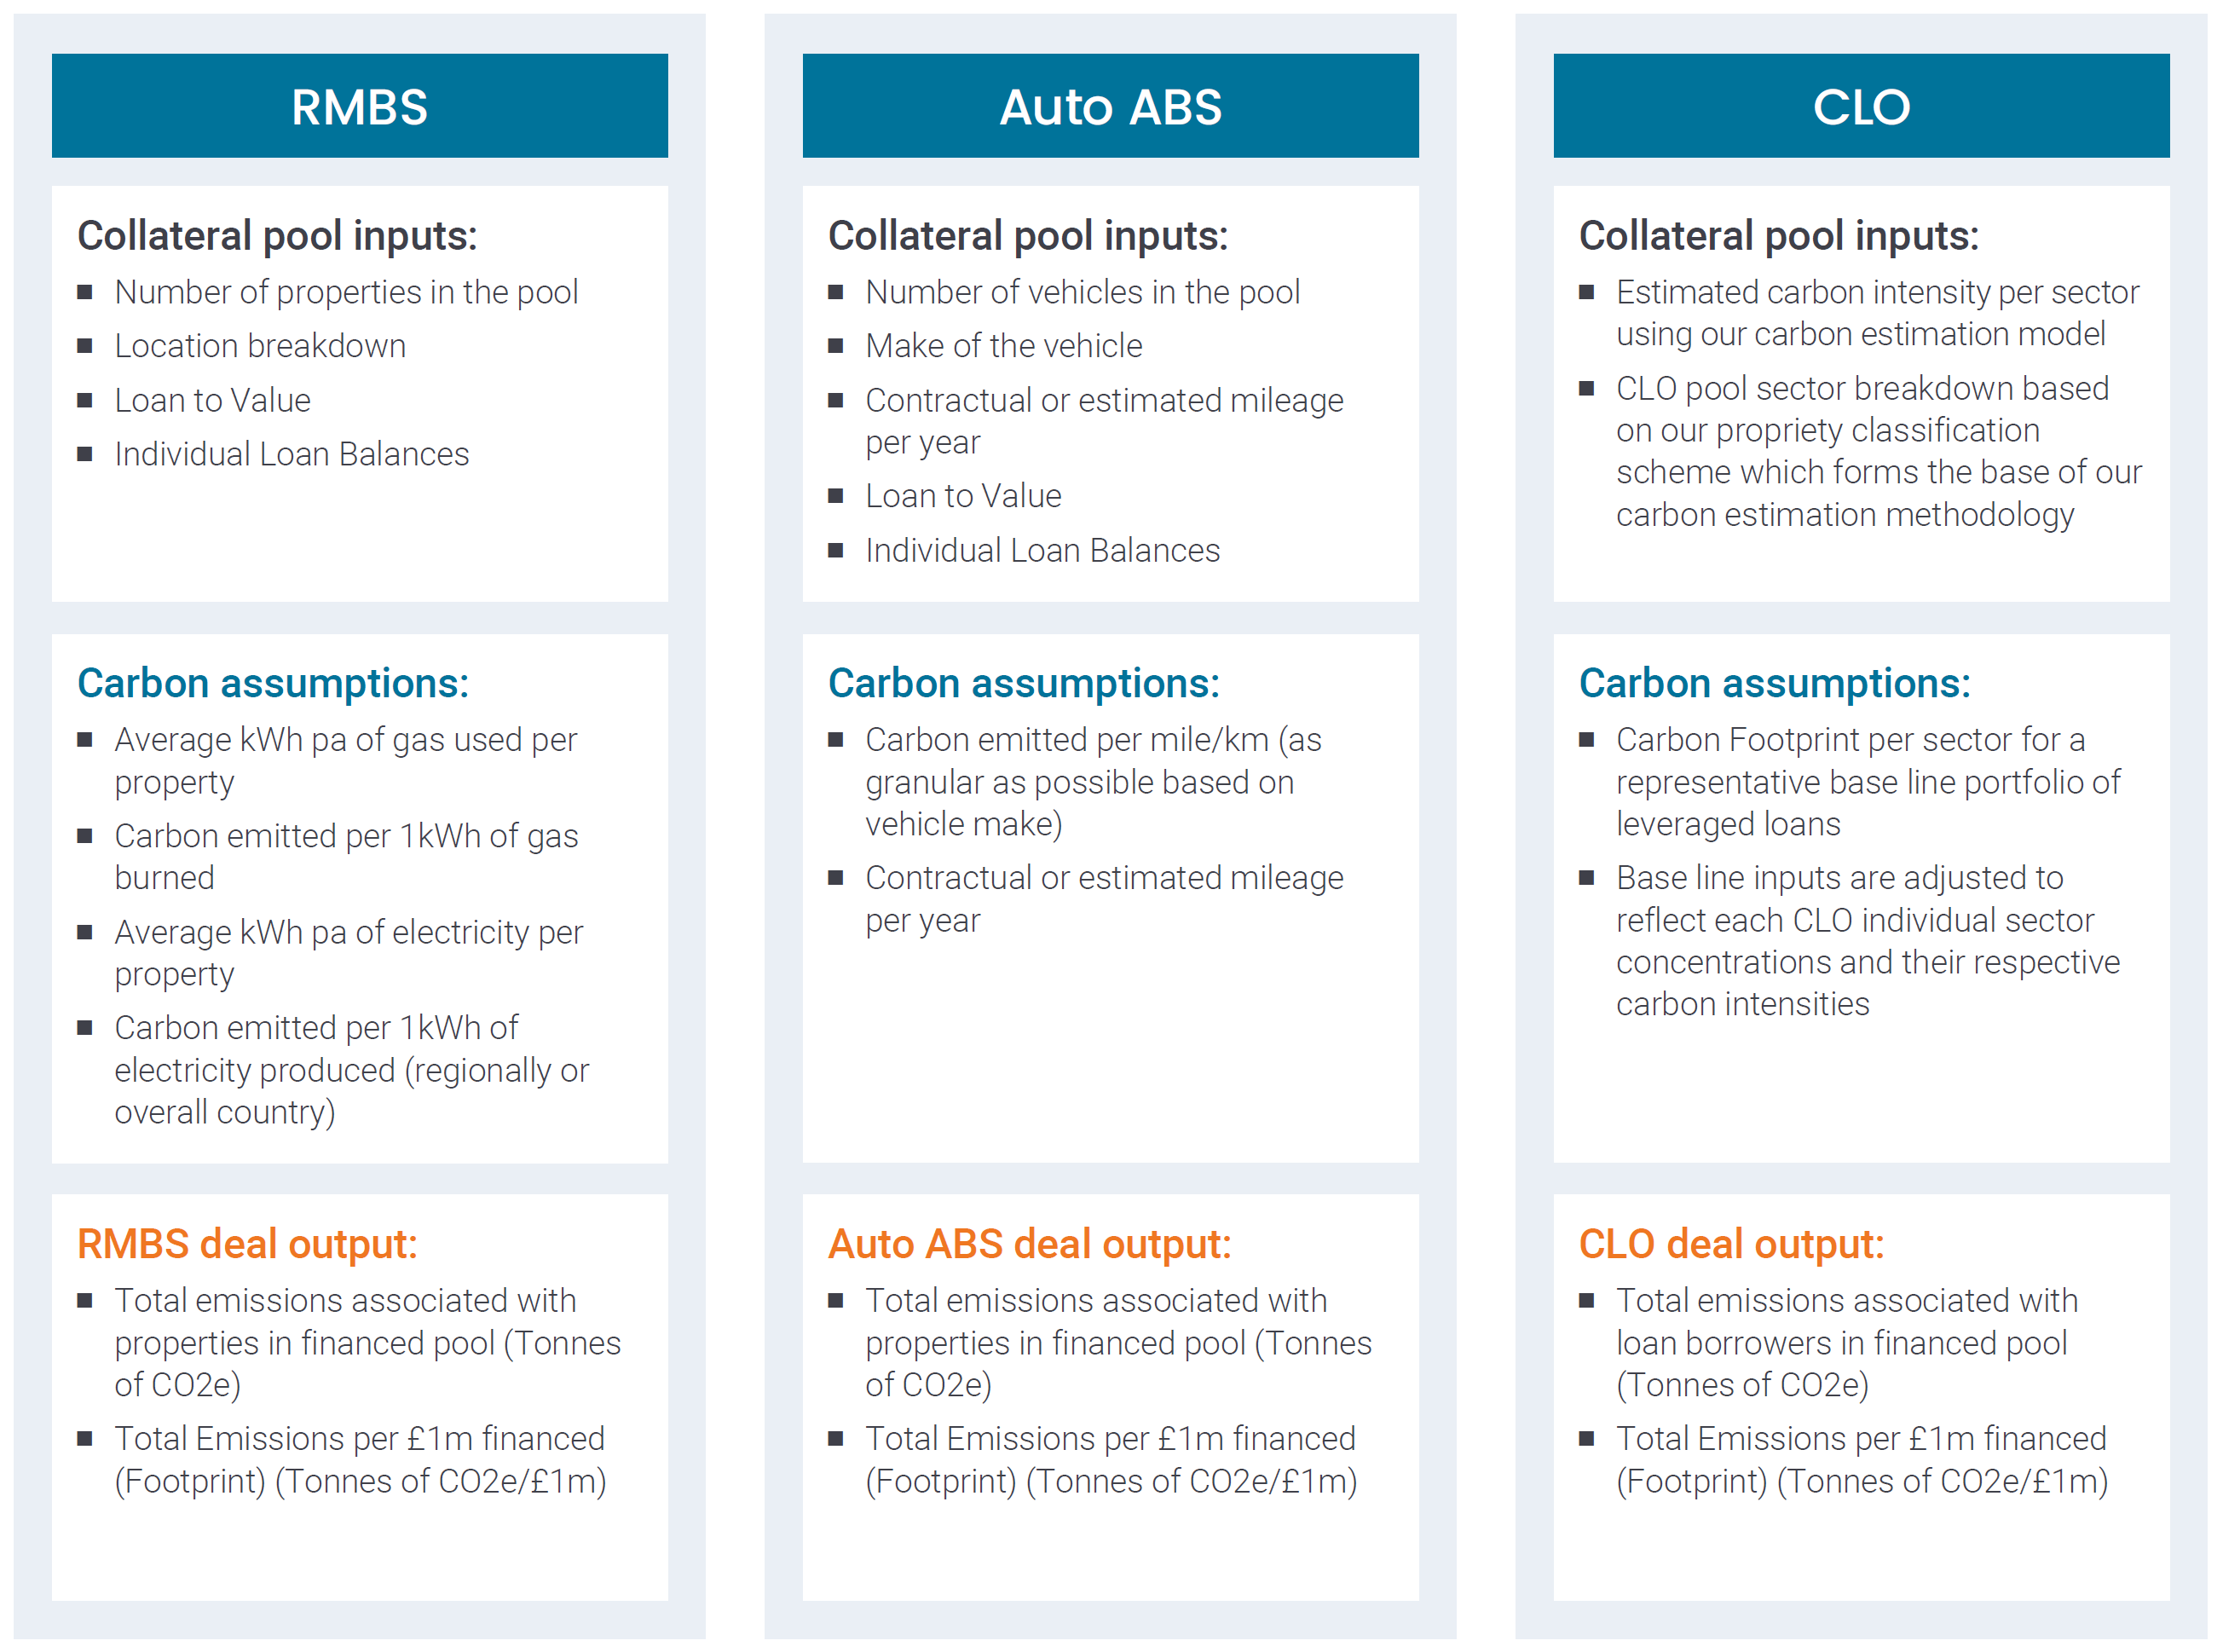
One of the data challenges to evaluating climate change risk in European securitised assets is value chain traceability. This is key in accounting for “Scope” carbon emissions – both indirect and direct – and quantifying those which are under the influence of the investor. A sole focus on Scope 1 and 2 emissions and overlooking Scope 3 in securitised assets would mean failing to recognise the true size of financed emissions. For example, the Scope 3 emissions of CLO investments are best represented as the sum of Scope 1 and 2 of the businesses financed through loans in the CLO collateral pool. We show some of the inputs and assumptions into our Scope 3 emissions calculations across securitised asset classes in Figure 3. Generally, Scope 3 represent the largest proportion of carbon emissions when considering the global net zero challenge.
Figure 3: Scope 3 emission calculation for securitisations

Source: Janus Henderson Investors.
When quantifying overall climate-related risks on a medium three- to seven-year time horizon, where direct data is not immediately available, we aim to create solutions to be able to conduct more indirect scenario risk analysis. For example, the impact of the climate transition under the Bank of England’s exploratory exercise, the ‘Climate Biennial Exploratory Scenario’ (CBES). We considered how a carbon tax could impact consumers and companies if introduced. This involved not only consideration of financial and macro risks, but also physical risks such as extreme weather events.
Clearly defining sustainability objectives is key to a successful engagement programme, which should be well-established and systematic to achieve outcomes. One example of thematic engagement is efforts to improving carbon disclosure from Auto ABS issuers, requesting that they directly provide vehicle emissions data and estimated mileage as part of their loan level data. Three Australian auto issuers have confirmed that they will start providing such loan level emissions data, acknowledging that change is a result of our ongoing engagement with them.
It is clear then that a specialist approach to assessing ESG in securitised investments and engagement to facilitate change can help tackle some of the challenges surrounding this endeavour, such as data availability. The defining features that separate the securitised asset classes from investment grade corporate credit warrant consideration from multi-asset investors seeking diversification in portfolios. In the next instalment in our series, we take a deeper dive into the sub-asset classes, looking behind the acronyms in the sector.
Footnotes
1 Source: Janus Henderson Investors, Bloomberg, as at 31 August 2024. ICE BofA Euro Corporate Index.
Glossary
Floating rate: A floating interest rate, otherwise known as a variable interest rate, changes periodically in accordance with the benchmark rate to which it is pegged.
Amortisation: An amortised bond is one in which the principal (face value) on the debt is paid down regularly, along with its interest over the life of the bond.
Spread duration risk measures how much a bond’s price changes in response to changes in credit spreads.