March 2020
Dividend futures – mind the gap
-
 Natasha Sibley, CFA
Portfolio Manager, Diversified Alternatives -
 Lucy Holden, CFA
Quantitative Research Analyst, Diversified Alternatives
Portfolio Manager Natasha Sibley and Analyst Lucy Holden consider the potential use of systematic and tactical approaches in seeking to take advantage of the asymmetric supply/demand characteristics of dividend futures.
Key Takeaways
- In markets where structured products are prevalent, such as in Europe, dividend prices are distorted by the supply of dividend exposure that must be hedged, commonly by banks seeking to hedge risk from structured notes.
- The structure of dividend futures markets lends itself to both systematic strategies designed to harvest the available risk premia and tactical strategies that seek the most attractive dividend exposures.
- While Europe is by far the biggest market for dividend futures, there is room for these securities to become increasingly internationalised.
It is possible for investors to take a view on dividends that companies will pay in the future. At a simple level, the market price for dividends is influenced by standard supply and demand factors – like all markets – so does not reflect a pure expectation of future dividends. In markets where structured products are prevalent, such as in Europe, dividend prices are distorted by the large supply of dividend exposure that must be hedged. This creates opportunities for investors willing to take dividend risk at a statistically interesting level.
As prices move and fundamentals evolve, the distribution of returns from dividend exposure changes, making the risk/reward trade-off more (or less) favourable. The long-term structural dynamic of this market is a persistent supply, commonly from banks seeking to hedge risk from structured notes, for example. Given that the focus of these trades is to hedge risk, the actual pricing of dividend futures tends to be of secondary significance, a level of asymmetry that can create a persistent risk premium.
Systematic and tactical – two complementary strategies
The structure of dividend futures markets lends itself to two styles of trading: one a systematic, rules-based exposure that harvests the risk premia available; the other, a more tactical strategy that seeks to tilt dividend exposures to where they are most attractive – both geographically (across the globe) and along the tenor curve (the length of time remaining before a contract expires).
On one side, designing and precisely specifying a systematic strategy is informative for tactical trading, allowing investors to benchmark trading decisions and generating a quick feedback mechanism. Conversely, an opportunistic tactical trading process, and the framework around it, helps to develop the thought behind systematic strategy design. Considering strategies from both perspectives informs results on both sides, providing the opportunity for improvement.
A systematic strategy gives insight into the true effectiveness of a hedge, providing an opportunity to question whether it is suitable, or if a more appropriate hedge is available. It could also deliver some context into past events of interest, such as the early days of the global financial crisis in 2008-2009.
The European dividend anomaly
We believe that the market for dividend futures on European stocks is one of the richest hunting grounds for divergence in dividend valuations. Pricing has shifted away from market fundamentals and, to us, European stock dividends seem to be trading at a level that does not reflect their real value. If we are correct, one way to benefit from a backdrop of political uncertainty would be to capitalise on the discrepancy between the price of European stock dividends and the forecasts for dividend payouts from European companies (US investors could buy dividend futures on the Euro Stoxx 50 Index, for example).
The charts in Exhibit 1 show the discrepancy between the expected growth in dividends (the forecast line) paid by companies in some of the world’s biggest stock market indices, and the growth priced into dividend futures (market price). Euro Stoxx 50 dividend futures are pricing in dividend cuts for the next few years, to the tune of around 3% per annum – numbers that look extraordinary when compared to analysts’ expectations for corporate earnings (declines of the scale implicit in such numbers could present a significant problem for the single-currency region).
There is always a risk that companies could cut their dividends severely, meaning any trade could potentially lose money. But for those investors who believe that conditions are unlikely to be that bad, buying longer-tenor futures contracts and holding them to maturity could represent a potential trading opportunity.
Exhibit 1: Europe leads the arbitrage opportunity
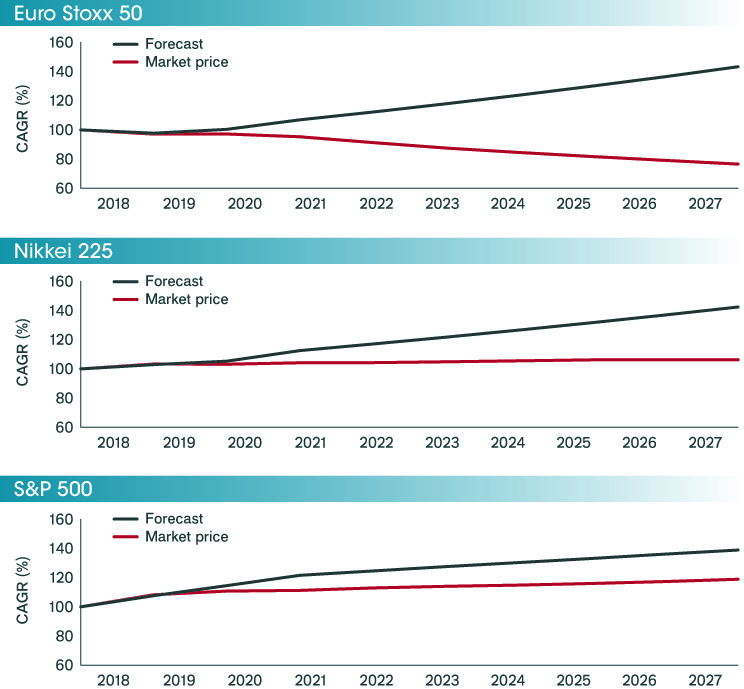
Source: Bloomberg, Janus Henderson Investors, dividend estimated compound annual growth rate (CAGR) December 2018 to December 2027, shown as a percentage, rebased to 100 at start date. Forecasts as at 31 October 2019.
While this divergence is more pronounced in Europe than elsewhere in the world, it is an ongoing theme we see in the US and Asia as well. As the charts show, the gaps are far narrower than in Europe, perhaps reflecting that these types of structured notes have not been as popular in the US, for example. There is certainly room for these products to become increasingly internationalised. But dividend futures still represent a potentially valuable arbitrage opportunity for investors seeking alternatives at a time of heightened geopolitical noise.
Structured products relating to dividend futures are less common in the S&P 500 Index than in European or Asian indices. As such, there is less natural flow on the dividend market (banks don’t have much exposure, so have much less need to hedge).
However, as Exhibit 2 shows, there are sometimes temporary dislocations. This example is from the summer of 2019, when S&P 500 dividends sold off somewhat, while the underlying S&P 500 Index rallied. The discount to forecast became unusually high, providing an attractive short-term trading opportunity, before the gap subsequently narrowed in October and November.
Exhibit 2: The S&P 500 dividend futures trade of 2019
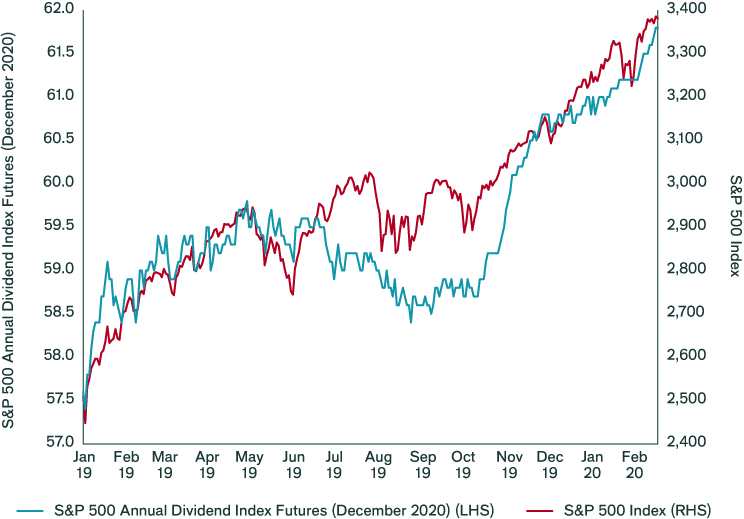
Source: Bloomberg, Janus Henderson Investors, 2 January 2019 to 19 February 2020. Chart illustrates the temporary dislocation in prices between the S&P Annual Dividend Index Futures and the S&P 500 Index. Past performance is not a guide to future performance. The value of your investment may go down as well as up and you may not get back the amount originally invested. ALTERNATIVE
PERSPECTIVES Back to main
More Alternative Perspectives
PREVIOUS ARTICLE
Liquidity in stressed markets is more expensive than you think
In this article, Portfolio Manager Aneet Chachra and Investment Director Alistair Sayer consider the cost of trading when volatility spikes, and ask if liquid alternatives provide an alternative for investors to manage their portfolios during periods of uncertainty?
NEXT ARTICLE
Trend is your friend
Can investors follow the pack and hope to outperform? In this article, Portfolio Managers Andrew Kaleel, Mathew Kaleel and Maya Perone investigate the characteristics of trend-following strategies and consider their potential value as part of a strategically positioned portfolio.