
The Bankers Investment Trust, part of the Janus Henderson stable, and managed since 2003 by Alex Crooke, Co-head of Equities – EMEA & Asia-Pacific, is well-known in the asset management landscape for a host of reasons, chief amongst which are:
- its longevity – one of the oldest investment trusts in existence, it was founded in 1888)
- its size – with circa £1.5bn of total assets (as at 30th June 2021), it’s one of the largest investment trusts
- its impressively consistent dividend record – it is one of only six investment trusts in existence to have increased their payouts for over 50 years consecutively, and has the joint-longest record of year-on-year dividend increases for an investment company, having increased its dividend every year since 19661; it has paid a dividend every year since 1894.
The trust is perhaps less well-known, however, for its regional multi-manager approach and flexibility to invest with no set limits within individual countries or sectors. The trust invests globally with the aim of achieving capital and income growth from a portfolio of equities and, whilst Alex sets the geographical allocation, the portfolio is managed on a day-to-day basis by specialists from across Janus Henderson’s global equity teams, each of whom focuses on a specific region: the UK, North America, Europe, Japan, Pacific (ex Japan, China) and China. He regards his role as more akin to that of a conductor, parcelling out portions of the trust’s assets to the various specialist investment desks at Janus Henderson to manage, whilst ensuring that the fund’s asset allocation across world stock markets and sectors is sufficiently diverse.
A free lunch…
The trust primarily employs a bottom-up, value-based investment process to identify suitable investment opportunities and so it’s appropriate to reference the views of Benjamin Graham, widely known as the ‘father of value investing’, who famously tells us: “Diversification is an established tenet of conservative investment.” The key word in that well-known quotation is ‘conservative’ and accordingly, it establishes that the ultimate aim of diversification is to reduce risk, i.e. the likelihood that an investment’s actual returns will diverge from its anticipated outcome. A diversified portfolio won’t guarantee to eliminate losses but will deliver its returns with lower volatility.
Not all risks are diversifiable, however. ‘Systematic’ risk – commonly referred to as ‘market’ risk – is not capable of diversification in that it typically pervades the full gamut of the investment landscape: interest rates, exchange rates, inflation, political uncertainty and war, or indeed a pandemic such as we’re currently experiencing, would be examples. The related risks can’t be mitigated, let alone eliminated, given that these factors are rarely associated with a specific region, industry, sector or business.
Unsystematic risk is diversifiable, however, in that it is limited – either to a region, a nation, a sector, an industry or an individual company. In the quest for diversification of this form of risk, the well-advised approach is to invest in an array of assets such that they will not all be influenced by market factors in the same way, the expectation being that the superior performance of certain holdings will neutralise the inferior performance of others. In short, it’s the practical application of the time-honoured adage ‘Don’t put all your eggs in one basket’ – but remember that the principle holds true only if the portfolio’s assets are uncorrelated, i.e. that they can be relied upon to respond differently, and often in opposing ways, to market influences and events. When share prices fall, for example, bond prices commonly rise, as a function of investors switching their assets into what is generally considered to be a lower-risk investment.
The point can be dramatised relatively simply by reference to the chart below, which shows the annual returns for selected asset classes ranked from best to worst within each calendar year over the last 10 years.

Source: Refinitiv Datastream, as at 03 May 2021
As can be seen, the return rankings change dramatically from year to year. For example:
- Emerging markets was one of the highest performing sectors of last year but one of the worst in 2018
- Japanese equities was the top-performing sector of 2015 but one of the worst in 2016 and 2018
- European equities was the second most lucrative sector to be exposed to during 2017 and the second worst the following year
- Cash as an asset class very rarely tops the charts but succeeded in doing so in 2018.
Thus, whilst diversification cannot always eliminate the risks of investing – the global financial crisis of 2008 and 2009 should have taught investors just how impossible that ideal is to achieve, as legions of seemingly well-diversified investors found little refuge from a financial tsunami – it does illustrate why investing across a variety of asset classes can help to alleviate the damage. This provides us with an opportune segue to a maxim first coined in 1952 by another market luminary, the Nobel prize-winning economist and architect of modern portfolio theory Harry Markowitz – “Diversification is the only free lunch in investing”. His use of the metaphor was intended to reinforce the notion that diversification facilitates the reduction of risk at negligible marginal cost, whilst simultaneously offering the potential to enhance returns. Some 70 years later, however, and having lived through the effects of diversification through a host of market cycles – not to mention the 11 bear markets experienced in the UK since 1969 – we’ve come to acknowledge that a genuinely appetising free lunch requires a decent menu, and that a great many investors are not nearly as diversified as they might think they are.
Things aren’t always what they seem
Investing in a single stock would seem to be a supreme act of folly and arguably the quintessence of hope over experience – intense concentration of that kind leaves no margin for error. Two examples – albeit relatively extreme – will serve to make the point. First, consider the employees of Enron, the US energy company, among whom it had become habitual to invest in the shares of their employer. As the true extent of the false accounting scandal unfolded, Enron’s share price, which had achieved a high of just under US$91 in mid-2000, plummeted by the end of November 2001 to less than US$1. The vast majority of employees lost not only their jobs but, worse, their retirement funds and, in many cases, their life savings.5 A similarly tumultuous journey was experienced by investors in Amazon shares at the turn of the millennium, although those brave enough to stay the course experienced a rather happier outcome ultimately. In December 2000, Amazon shares were trading at over $100 but, by the following October, they had fallen to below $6 … and one would have had to wait until December 2007 to see them climb back above $90. The share price is now over $3,700!
Investing in a single sector runs the risk of proving similarly imprudent. Ponder the pummelling now being felt by the world’s airline businesses thanks to the coronavirus pandemic: shares in IAG, BA’s parent, traded at above £6.70 in mid-January 2020, but continue to languish at around £2, a fall of some 70%. A great many other airlines, and also airline leasing firms, have suffered a similar fate, with the entire sector feeling the heat.
Investing on a multi-sector basis represents much the better option therefore although, even then, things are not always what they seem. Consider the US, the largest economy in the world, as represented by the Standard & Poor’s 500 Index or ‘S&P 500’, the most common index used to track the performance of the US stock market. Often hailed as a reliable and holistic representation of corporate America, one could be forgiven for assuming the opportunities for diversification to be boundless. However, whilst it does offer investors broad exposure to the US economy, it is inordinately weighted towards a small number of specific sectors, as the breakdown below amply demonstrates.
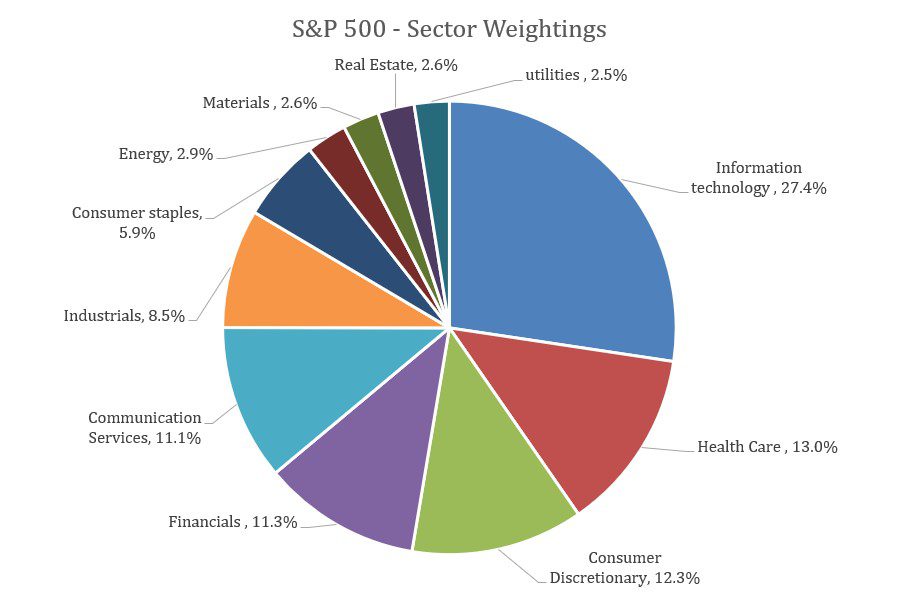
Source: S&P Dow Jones Indices, based on GICS sectors, as at 30.06.21
Those investing in the US on a ‘benchmarked’ basis therefore need to be confident that the technology sector, for example, will outperform, given its weighting of over 25% of the index. Note also that the three largest sectors, in aggregate, make up over half the index’s total value.
However, whilst the FTSE 100 unsurprisingly offers exposure to all sectors, some are much more prominently represented than others. Interestingly, given the make-up of the S&P 500, the most conspicuous absentee is technology: companies in the tech sector make up circa 1.7% of the FTSE 100, whilst they represent over 20% of the FTSE Global All Cap Index.8 Investing in the UK’s premier index market is effectively a good-sized bet that the technology sector will underperform therefore, whereas in recent years the reverse has been true … which goes some way towards explaining the relatively pedestrian performance of UK equity markets. Moreover, just four sectors – Banks & Financial Services, Basic Resources, Industrial Goods & Services and Healthcare make up over 45% of the FTSE 100 Index.9 Dividend-focused investors may also feel their ambitions for diversification somewhat thwarted by investing in the FTSE 100: according to AJ Bell, one of the UK’s largest investment platforms, just 10 stocks delivered over 50% of the total dividends paid in 2020; the top 20 stocks delivered circa 75% of the index’s total payout.10 Whilst arguably the most popular bellwether for the health of UK PLC, the FTSE 100 may not be the most representative. Investing in one’s domestic market simply feels safer of course – it’s commonplace to believe we understand the companies in our local market that much better on the basis that we interact with them that much more frequently (a phenomenon widely known as ‘home bias’). It’s a source of uncompensated risk however – additional risk but without the potential for additional returns – but it’s a risk that can be easily allayed by diversifying beyond one’s own geographical borders: ‘location, location, location’ in other words. The appeal of an investment vehicle with a global mandate and pursuing a benchmark such as the FTSE World Index, is undeniable therefore and yet, even here, a deeper examination of the composition of those indices raises further diversification issues.
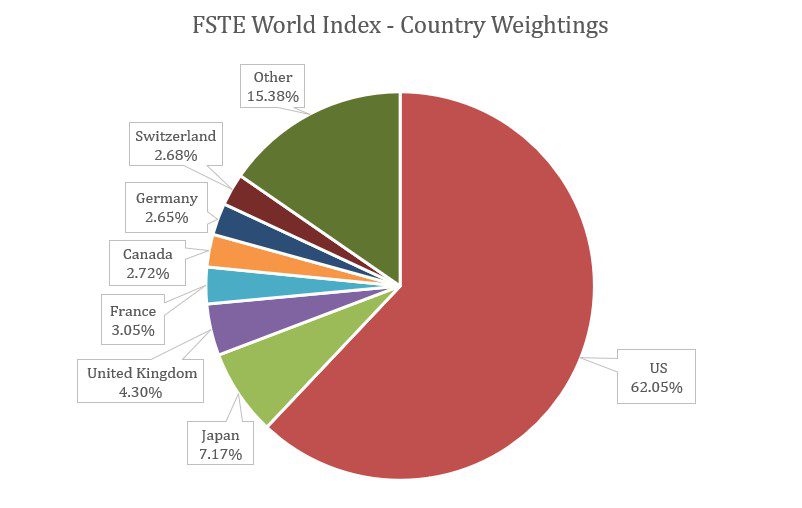
Source: FTSE Russell, FTSE World Factsheet, as at 30.06.21
Given the opportunity to access 35 advanced economies and over 2,600 individual stocks in the case of FTSE World, it’s tempting to infer that excessive exposure to a single economy has been averted. However, a global benchmark typically obliges the investor to be markedly upbeat about the US, on the basis that – as shown in the chart above – it represents over 60% of the market capitalisation. Just one other nation, Japan, represents more than 5% and so the index proves to be somewhat less diversified than one might have anticipated.
It’s an approach which has delivered in performance terms. Over the longer term, performance has steadfastly delivered, with the with the share price and NAV total return both being well ahead of the benchmark over five and 10 years.3 Over the most recent financial year, with dividends reinvested, the net asset value (NAV) total return was 5.3%, outperforming the FTSE World Index total return of 4.3%, whilst the share price total return was higher still, at 8.1%, due to the narrowing of the discount to NAV at which the shares are traded: a premium of 0.4% at the year-end compared to a discount of 2.2% for the previous financial year.2 Four of the regional portfolios delivered positive returns and all outperformed their respective local benchmarks over the year apart from the Pacific (ex Japan and China) portfolio, the performance of which was hampered by virtue of the investment style for this portfolio being both value and income oriented – it’s a style which has served the trust well in the past and the managers are confident it will continue to do so in the future.
Ancient and modern
It’s ironic to note that Bankers Investment Trust – one of the UK’s oldest listed vehicles – has remained consistently fleet of foot in adapting the portfolio allocation to prevailing market conditions. Shortly prior to the arrival of COVID-19 early last year, the share price traded at record highs, only to fall towards the end of February as governments across the globe imposed national lockdowns. The trust was nimble in its response, however, exiting travel or transport related stocks and reducing its exposure to financials, whilst a prescient build-up of its technology holdings – Alphabet, owner of Google, Apple, Facebook, Microsoft et al – positioned it to benefit from the accelerating transition to working from home. Despite recent developments, Microsoft has consistently been the largest holding over recent years.
Why it all matters
Few would take issue with the fact that the arguments in favour of diversification – by sector, by region and by asset class (this last aspect was not discussed in this piece) – are highly persuasive. As ever in life, the devil is in the details however and, having determined what one wants to achieve by way of a diversification strategy, it’s important to look closely at how any particular investment vehicle might achieve the desired goal. A free lunch is a free lunch, but some can leave a bad taste in your mouth. At the risk of forcing the metaphor, Alex Crooke is confident that a great many investors will continue to find his Bankers ingredients highly appetising.
1Source: Association of Investment Companies, 4.08.21
2Source: The Bankers Investment Trust PLC, Annual Report 2020
3Source: The Bankers Investment Trust PLC factsheet, 31.05.21
4Sources: Refinitiv Datastream, 03.05.21, annual index total returns (income or dividends reinvested) in US$ dollars, indices are unmanaged and therefore not subject to fees. 2021 shows the year to 30.04.21. Indices or prices used are: US equities – MSCI USA Index, EM equities – MSCI Emerging Markets Index, Europe equities – MSCI Europe Index, Japan equities – MSCI Japan Index, DM government debt – Bloomberg Barclays Global Treasury Index, Emerging debt – JP Morgan Emerging Market Bond Index (EMBI) Global Composite, High yield – Bloomberg Barclays Global High Yield Index, IG credit – Barclays Global Corporate Credit Index, Commodities – Commodity Research Bureau (CRB) Index, Cash – Bloomberg Barclays US Treasury Bill Index, REITs – S&P Global Real Estate Investment Trust Index, Infrastructure – S&P Global Infrastructure Index. Annualised column shows the annualised total return over the last 10 years to 30.04.21.
5Source: Employees’ Retirement Plan Is a Victim as Enron Tumbles – The New York Times (nytimes.com)
6Source: S&P Dow Jones Indices, based on GICS sectors, as at 30.06.21
7Source: The Guardian, 15.08.20
8Source: FTSE Russell, FTSE 100 and FTSE Global All Cap Factsheet, as at 31.05.21
9Source: FTSE Russell, FTSE 100, Factsheet, as at 30.06.21
10Source: AJ Bell, Dividend Dashboard Q4 2020
11Source: FTSE Russell, FTSE World Factsheet, as at 30.06.21
12 Source: Bloomberg, as at 30.07.21 Bear market Expand
A financial market in which the prices of securities are falling. A generally accepted definition is a fall of 20% or more in an index over at least a two-month period.
Bottom-up fund managers build portfolios by focusing on the analysis of individual securities, in order to identify the best opportunities within an industry or country/region.
Companies that sell discretionary consumer items, such as cars, or industries highly sensitive to changes in the economy, such as miners. The prices of equities and bonds issued by cyclical companies tend to be strongly affected by ups and downs in the overall economy, when compared to non-cyclical companies.
A way of spreading risk by mixing different types of assets/asset classes in a portfolio. It is based on the assumption that the prices of the different assets will behave differently in a given scenario. Assets with low correlation should provide the most diversification.
A measure of a company’s leverage that shows how far its operations are funded by lenders versus shareholders. It is a measure of the debt level of a company. Within investment trusts it refers to how much money the trust borrows for investment purposes.
The rate at which the prices of goods and services are rising in an economy. The CPI and RPI are two common measures. The opposite of deflation.
Marginal cost is the additional cost incurred in the production of one more unit of a good or service. It is derived from the variable cost of production, given that fixed costs do not change as output changes, hence no additional fixed cost is incurred in producing another unit of a good or service once production has already started.
The total market value of a company’s issued shares. It is calculated by multiplying the number of shares in issue by the current price of the shares. The figure is used to determine a company’s size, and is often abbreviated to ‘market cap’.
Market cycles, also known as stock market cycles, is a wide term referring to trends or patterns that emerge during different markets or business environments. During a cycle, some securities or asset classes outperform others because their business models aligned with conditions for growth.
The total value of a fund’s assets less its liabilities.
Systematic risk refers to the risk inherent to the entire market or market segment. Systematic risk, also known as “undiversifiable risk,” “volatility” or “market risk,” affects the overall market, not just a particular stock or industry.
Unsystematic risk is the risk that is unique to a specific company or industry. It’s also known as non-systematic risk, specific risk, diversifiable risk, or residual risk. In the context of an investment portfolio, unsystematic risk can be reduced through diversification-while systematic risk is the risk that’s inherent in the market.
Value investors search for companies that they believe are undervalued by the market, on the basis that they expect their share prices to increase. One of the favoured techniques is to buy companies with low price to earnings (P/E) ratios. See also growth investing.
The rate and extent at which the price of a portfolio, security or index, moves up and down. If the price swings up and down with large movements, it has high volatility. If the price moves more slowly and to a lesser extent, it has lower volatility. It is used as a measure of the riskiness of an investment.
| Discrete year performance % change (updated quarterly) | Share price | NAV |
|---|---|---|
| 30/09/2020 to 30/09/2021 | 28.8 | 22.6 |
| 30/09/2019 to 30/09/2020 | 3.7 | 5.9 |
| 28/09/2018 to 30/09/2019 | 3.1 | 4.3 |
| 29/09/2017 to 28/09/2018 | -8.6 | 2.0 |
| 30/09/2016 to 30/09/2017 | 36.0 | 21.5 |
All performance, cumulative growth and annual growth data is sourced from Morningstar