May 2021
A unique recovery: the handoffs commence
-
 Mathew Kaleel
Portfolio Manager -
 Andrew Kaleel
Portfolio Manager
-
 Maya Perone
Portfolio Manager
Can investors follow the pack and hope to outperform? In this article, Portfolio Managers Andrew Kaleel, Mathew Kaleel and Maya Perone investigate the characteristics of trend-following strategies and consider their potential value as part of a strategically positioned portfolio.
Key Takeaways
- Trend following seeks to buy assets that are rising in value and short assets that are falling in value. A simple form involves using a moving average over a time series on a given security.
- Trend-following strategies are typically implemented via liquid futures markets on regulated global derivatives. The use of futures markets allows investors to trade on margin and as a result, provides the flexibility to target preferred outcomes.
- Trend following has historically added value in times of chaos, uncertainty and macro disruption and when blended with other strategies designed to minimise left tail risk, the use of trend following could represent an attractive portfolio protection option for those investors with a positive return expectancy.
The performance of trend-following strategies (also known as ‘time series momentum’ or ‘CTA’) has come into focus over the past few years, and debate continues on their potential value as both a standalone allocation to a traditional portfolio and as part of a wider alternative asset portfolio.
In its purest implementation, trend following seeks to buy assets that are rising in value and sell short assets that are falling in value. A simple form of trend following involves the use of a moving average over a time series on a given security. A directional view (to be long or short) can be ascertained by looking at the average of the closing prices of a time series over a given time frame.
For trend-following strategies, the time horizon is typically six to 12 months. If the current price is above the moving average of the price series (see Exhibit 1), investors would be long that asset, while selling short if the current price is below the average of the time series. Therefore, trend following does not seek to predict price moves; on the contrary, it seeks to be positioned in the direction of recent movement in prices.
Exhibit 1: The dislocation between price and moving average indicates the direction of trend
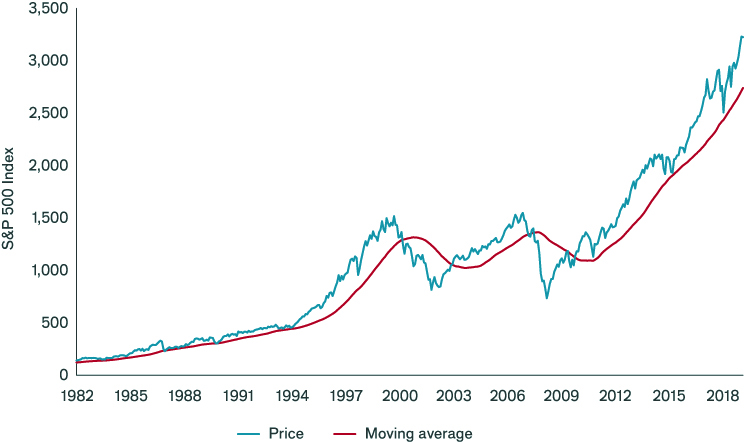
Source: Refinitiv Datastream, Janus Henderson Investors, Diversified Alternatives Team, January 1981 to December 2019. The moving average shown is a rolling three-year average of the S&P500 Index. Past performance is not a guide to future performance.
Trend Beta Model
Trend-following strategies are typically implemented via liquid futures markets on regulated global derivatives. The use of futures markets allows investors to trade on margin and as a result, provides the flexibility to target preferred outcomes.
The mechanical nature of trend-following strategies allows for the development of models that provide an overview of the historical performance and positioning of a basic trend-following strategy. For the sake of simplicity, we can examine long-term trends via a hypothetical trend beta model. In this example, weekly time series data is used in conjunction with a multiyear moving average to determine long and short positioning. Individual positions are scaled utilising an ex-post volatility methodology, allowing for an initial equal contribution to risk for each of the underlying positions.
Sector allocations are then re-scaled with the intent to equally allocate risk. Allocations are made across 60 markets, covering interest rates, bonds, currencies, commodities and stock indices. An assumption of 2% per annum (pa.) is allowed for implementation costs, and interest (income) received is based upon the US federal funds rate.
Finally, positions are scaled to target an ex-post portfolio volatility target of 12% pa.
Trend performance
The data suggests that this hypothetical trend beta model would have provided attractive long-term return to risk outcomes versus the S&P 500® Index, delivering a positive payoff in addition to lower drawdowns and volatility. Over this period, the strategy would have had essentially zero correlation to equities:
| Annualised return | Annualised volatility | Sharpe Ratio | Maximum drawdowns | Correlation | |
|---|---|---|---|---|---|
| Trend Beta Model | 13.5% | 12.0% | 0.70 | 40.1% | -0.01 |
| S&P 500 Index | 11.6% | 16.2% | 0.47 | 71.7% | – |
Note: Hypothetical model based on weekly time series data across commodity, bond, rate, currency and equity futures. Used in conjunction with a multiyear moving average to determine long and short positioning, rebalanced weekly and scaled to target an ex-post volatility of 12%pa. Incorporates a hypothetical 2%/year cost. See disclaimers for additional information on simulated performance.
What causes markets to trend?
A trend will manifest in a given market or sector based upon one or more factors, including sentiment, market dislocations, changes in perceived or actual levels of supply and demand, macro drivers (such as the US dollar or oil prices), changing inflationary expectations or central bank policy.
A typical trade setup exhibits several different phases. It begins with an initial market move that determines the trend and signal, evolves into managing a position while the trend plays out, and ends with eventual exhaustion as prices react to news that runs counter to the market.
For example, a price shock or change in supply could cause prices to move away from perceived fair value. The initial move higher would result in trend strategies instigating a long position (and vice versa for a short position). As the market event progresses, this can bring new participants to the table, pushing prices higher, forming the basis of a meaningful trend. Ultimately, prices may move to a level well beyond fair value. At this point of exhaustion, momentum is lost, and prices likely revert to fair value (or beyond), thus ending the trend.
Trend following as a potential shock absorber
Trend following has historically been used by investors as a tool to help improve diversification and reduce risk in multi-asset portfolios. The long-term expected payoff profile of a trend-following strategy is one that exhibits a good upside capture ratio, but more importantly a material positive return in sustained bear markets for stocks and bonds.
A defining feature of the long-term return series of a trend-following strategy, when compared to the S&P 500 Index, is the ‘CTA Smile’, which captures the four potential outcomes when comparing monthly returns (see Exhibit 2). Returns in the top left quadrant highlight the incidence of positive returns for trend following when equities are negative. The frequency of these positive returns indicate that trend following has historically contributed to left tail protection.
Exhibit 2: The CTA smile indicates a trend of tail protection
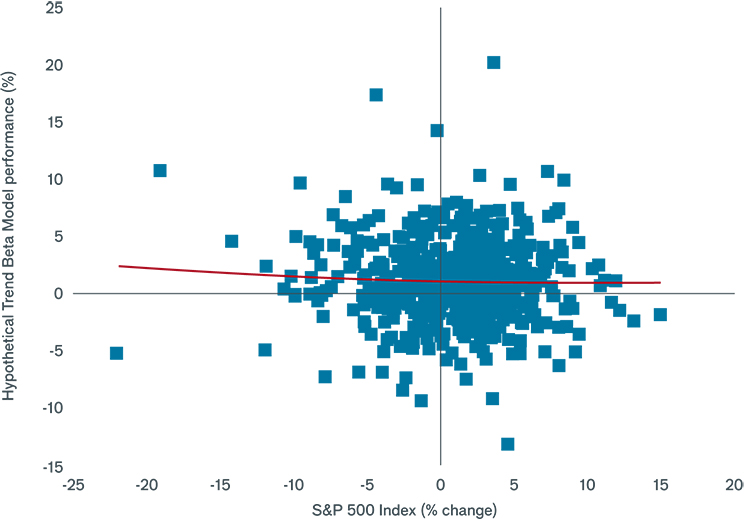
Source: Janus Henderson Investors, monthly returns 30 November 1973 to 27 December 2019 for the hypothetical Trend Beta Model described earlier versus the S&P 500 Index. Past performance is not a guide to future performance.
More recent returns for global equities and implications for trend following
More recent data for trend indices have seen lower return outcomes. Is the case for including a trend-following strategy still intact? From our analysis, the short answer is yes. Looking at rolling three-year returns of the Trend Beta Model, the data provides the following insights:
- While returns since 2008 have been low, they are not unusual relative to longer-term returns.
- Prior periods of relatively muted returns have preceded periods of positive outperformance over the following five years.
Looking at the returns from allocations to both global equities and the Trend Beta Model since the Global Financial Crisis (GFC), rolling 12-month returns on the MSCI World Index have effectively not been below 10% on the lower bound since the GFC. There is not much conjecture that central bank intervention has removed the downside risks to this point.
In our view, extended historical bear markets and recessions reinforce the argument for a defensive allocation to alternatives. The last two major global stock market shocks – the US recession of 2000-2001 and the GFC in 2008-2009 – coincided with significant positive absolute performance from the Trend Beta Model, and meaningful left tail alpha. The Trend Beta Model also benefited from extended moves in specific sectors, such as during the bond bull market of 2014.
One final observation is the case for mean reversion over a meaningful time horizon. Historically, rolling returns on global equities that exceed 25% to 30% have often reversed over the next two to three years. It is these periods in which diversifying or protective strategies could potentially add material value to a traditional portfolio.
Trend-following capacity and factor crowding
Another important factor that must be considered is the constituents of widely used and quoted CTA/trend-following indices, which can be dominated by larger CTAs.
Our view on capacity is that there is a critical threshold for assets under management (AUM), beyond which a trend-following strategy will likely have to alter the way that capital is allocated. Beyond this level, markets with lower liquidity or capacity will by necessity receive a lower allocation, concentrating risk in fewer, larger markets.
The issue of crowding is a different matter. We do not believe this is likely to have a meaningful impact on potential returns. Firstly, the size of the CTA industry has remained relatively stable over the past decade, while trading volumes have increased year on year during this period. Secondly, we estimate that the total average position size of a trend-following strategy is not close to a material level where we would expect to see any significant market impact.
The role of trend following in a portfolio
There are several indicators that, in our view, suggest positive prospects for trend-following strategies. Overall trading costs continue to decline while the technology around execution and implementation continues to improve. An increasing number of investable markets (such as the growth in emerging markets) offers the prospect of further potential diversification for trend portfolios in the future.
Elsewhere, the evolution of trend following has seen managers move into other areas of investment (OTCs and cash equities). The creation of ‘synthetic’ time series for prices (either at the sector level, macroeconomic level or cross-asset level), for example, offers a range of opportunities to potentially augment returns.
Trend-following strategies are also being used more thoughtfully, as part of a broader suite of protection strategies. We believe a trend-following strategy optimally sits as part of a suite of strategies that are designed to provide a shock absorber for various adverse outcomes, including known unknowns and black swans.
In summary, trend following has historically added value in times of chaos, uncertainty and macro disruption. When blended with other strategies designed to minimise left tail risk, the use of trend following could represent an attractive portfolio protection option for those investors with a positive return expectancy.
ALTERNATIVEPERSPECTIVES Back to main
More Alternative Perspectives
PREVIOUS ARTICLE
Dividend futures – mind the gap
Portfolio Manager Natasha Sibley and Analyst Lucy Holden consider the potential use of systematic and tactical approaches in seeking to take advantage of the asymmetric supply/demand characteristics of dividend futures.
NEXT ARTICLE
Machine learning – no silver bullet?
Machine learning has evolved rapidly over the past decade, with huge consequences across industries. But does the hype exceed its potential impact? In this article, we discuss with Portfolio Manager Mark Richardson the value of machine learning for the world of quantitative finance.