The last quarterly commentary expressed a cautious view on the outlook for the global economy and risk markets, on the grounds that monetary trends remained weak and did not support early recovery hopes. Market falls in Q1, of course, mainly reflected the coronavirus crisis – the monetary analysis was a “lucky general” on this occasion. The economic policy response to the health shock has already been reflected in a strong pick-up in money growth, suggesting a V-shaped economic rebound when pandemic containment measures are relaxed. The crisis, indeed, may prove to be the catalyst for a sustained period of monetary strength, thereby laying the foundation for a secular upswing in inflation. Broad money trends will be key for assessing this prospect.
The forecasting approach followed here relies on the empirical rule that swings in real (inflation-adjusted) narrow money lead swings in economic activity, usually by between six and 12 months. Six-month growth of “global” real narrow money (i.e. in the G7 economies and seven large emerging economies) fell from 2.6% (not annualised) in September 2019 to 1.7% in January 2020, signalling deteriorating economic prospects as the coronavirus shock arrived – see first chart. The assessment last quarter was that a rise above 3% was needed to signal an economic recovery.
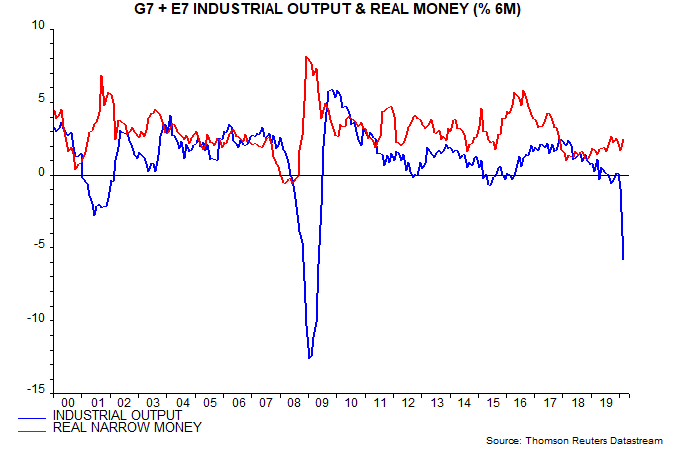
The initial market / policy response to the crisis was reflected in a recovery in six-month real narrow money growth to 2.4% in February but a much bigger rise, to 4% plus, is expected to have occurred in March. US M1 and M2 grew at record rates in the five weeks to 30 March as the Fed expanded its balance sheet by 40% and corporations drew down commercial bank credit lines. Chinese March numbers were also significantly stronger while global real money growth is being further boosted by a sharp fall in consumer price momentum due to the collapse in the oil price.
Narrow money outperforms broader measures as a leading indicator of economic activity but broad money trends are more important for assessing medium-term inflation prospects. Narrow money velocity is more variable than that of broad money over the medium term, resulting in a weaker relationship with nominal GDP and inflation trends. The average level of global narrow money growth has been high by historical standards since the GFC but a faster-than-average fall in velocity has resulted in modest nominal GDP growth and inflation. Broad money growth has been lower and a better guide to inflation quiescence, as illustrated by the second chart (which uses G7-only data because of its much longer history).
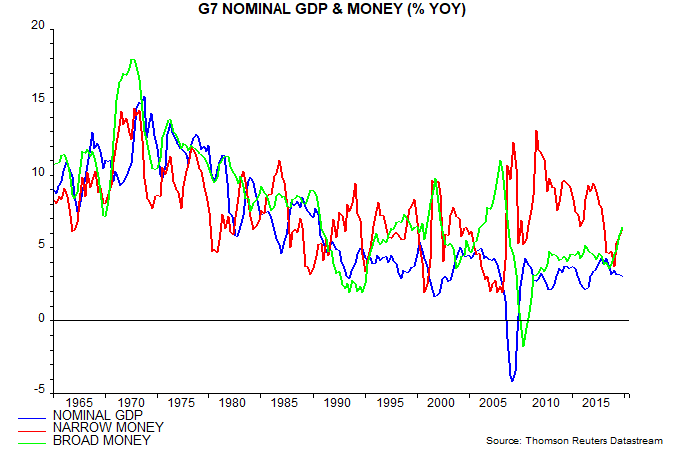
Japanese experience provides further evidence of the greater importance of broad money trends for medium-term inflation performance. Annual narrow money growth averaged 6.0% over 1995-2019 but broad money growth of 2.1% better reflected secular nominal GDP weakness and price deflation. By contrast, both measures grew strongly when Japan suffered bouts of severe inflation from the 1950s through the late 1980s.
The second chart shows that G7-only narrow money growth had rebounded before the coronavirus shock – the continued sluggishness of the global real measure tracked here reflected weakness in China and a pick-up in inflation in late 2019 / early 2020. More significantly, broad money growth had also strengthened, reaching its highest level since the GFC. This suggests that the medium-term inflation outlook was shifting before recent policy actions.
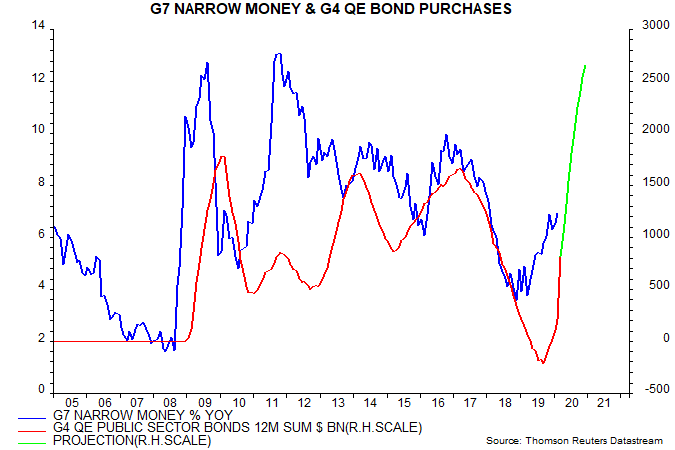
Global narrow money growth is expected to surge as a result of these actions but a sustained acceleration in broad money is also now plausible. While major central banks have had less scope to cut interest rates than during the GFC, their QE response has been much larger and faster – third chart. These QE programmes represent – whether or not central bankers care to admit it – monetary financing of fiscal deficits that may rise to 10% of GDP or more as a result of relief spending and recession, probably remaining wide well beyond the crisis.
Policy-makers are, in addition, promoting an expansion of commercial bank lending to support economic activity via a combination of relaxation of capital requirements, loan guarantees, cheap funding schemes and “moral suasion” verging on compulsion. Changes to rules globally have released capital of $500 billion supporting potential lending of $5 trillion, according to the Financial Times – $5 trillion amounts to 7% of the global broad money measure tracked here. The weak response of broad money to policy easing during the GFC partly reflected regulatory pressure on banks to contract their balance sheets to boost capital ratios. Regulatory policy has switched from brake to accelerator, suggesting a surprisingly large current response.
The Fed’s interventions have dwarfed those by other central banks, resulting in a 71% rise in US bank reserves since the start of the year; the ECB’s actions, for comparison, lifted Eurozone reserves by 18%, with a smaller increase in the UK – both, however, will rise much further. The surge in relative supply of US high-powered money may arrest or reverse a destabilising rise in the US dollar during March, suggesting, among other consequences, a slowdown or cessation of EM capital outflows.
Chinese monetary weakness, as noted earlier, was a significant drag on global money growth in early 2020. Previous commentaries attributed this partly to funding difficulties of smaller regional banks, causing them to restrict credit. PBoC liquidity injections have eased funding conditions – 3-month SHIBOR has fallen by 150 bp since end-2019 – and banks have been directed to expand loan supply. The monthly flow of total social financing in March was a record in yuan value terms, while narrow and broad money measures rose sharply.
Euroland and UK March money numbers, to be released around end-April, will reflect the initial impact of new QE programmes amounting to 6% and 9% of GDP respectively and involving record monthly flows – the ECB’s purchases are scheduled to be completed by end-2020 and the Bank of England’s “as soon as is operationally possible”. The Bank of Japan’s policy changes were relatively minor but this should not be taken to imply inaction – the “yield curve control” policy allows for potentially unlimited QE if planned large-scale fiscal stimulus and / or global market trends put upward pressure on intermediate JGB yields.
The suggestion from monetary trends of strong global economic growth in late 2020 / 2021 is supported by cycle analysis. The latter provides a longer-term framework for anticipating rises and falls in economic momentum; monetary analysis narrows down the timing of such shifts. There are three cycles: the 3-5 year stockbuilding or inventory cycle, the 7-11 year business investment cycle and the 15-25 year housing cycle.
Recessions are usually associated with downswings in at least two of the cycles. Strong growth and booms occur when all three are in upswings. Upswings last longer than downswings, typically occupying at least two-thirds of overall cycle length.
Global GDP growth reached a seven-year high in 2017 as the stockbuilding cycle recovered from a 2016 low while the business investment and housing cycles remained in uptrends, having bottomed in 2009. The business investment cycle, however, entered a downswing in 2018, with the stockbuilding cycle following in 2019. The housing upswing, meanwhile, lost momentum in response to rising interest rates in 2018 and as the other cycles exerted a drag.
The last quarterly commentary suggested that stockbuilding cycle had bottomed in late 2019 but the coronavirus shock may have shifted the low to H1 2020. The business investment cycle was expected to bottom in H1 2020; this timing is maintaining but the trough level of investment, probably in Q2, will be much lower than previously foreseen. Both cycles, however, are scheduled to be in recovery phases by late 2020 while the housing cycle upswing will be reenergised by interest rate falls in 2019 / early 2020 – housing investment had already started to regain momentum in late 2019. The stockbuilding cycle, moreover, is not due to peak until late 2021 or, more likely, 2022. The suggestion is that an initial economic recovery as coronavirus-related restrictions are relaxed will develop into a full-scale boom in 2021-22.
Readers have pushed back against the idea that the stockbuilding and business investment cycles will bottom in H1 2020, arguing that financial losses and weak confidence will result in further spending cut-backs in H2. The impact of stockbuilding on GDP, however, depends on its rate of change – a cycle reversal requires only that the decline slows from a likely extreme level in early 2020. As for business investment, companies delay replacement capital spending during the downswing, resulting in a build-up of potential demand that plays an important role in driving an initial recovery.
Sceptics are right to point out that the 2020 recession reflects a supply-side shock and was not foreordained by cycles. The judgement here is that the global economy would have avoided a recession in the absence of the health crisis – real narrow money growth was not sufficiently weak and there have been historical examples of joint stockbuilding / business investment cycle downswings resulting in slowdowns rather than contractions, e.g. the US near-recession of 1967. The cycle backdrop, however, may have influenced the health policy response – the long business investment cycle upswing and an associated fall in unemployment to multi-decade lows may have fed into government overconfidence about economic resilience and consequent willingness to impose costly shutdowns.
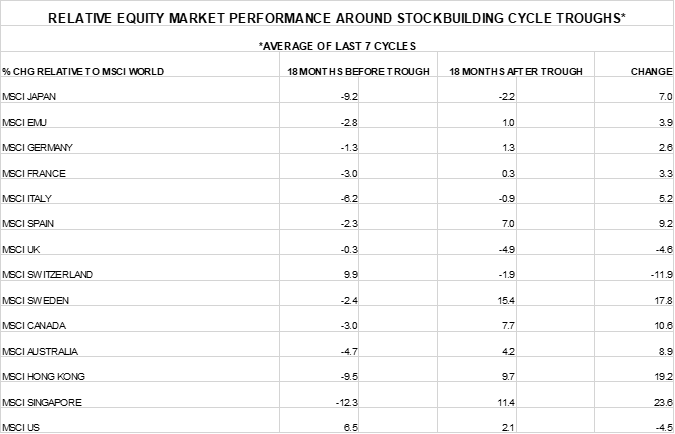
The economic scenario described above suggests that investors should use any set-backs caused by near-term negative news on activity / profits or pandemic developments to increase exposure to cyclical assets and inflation hedges. Previous commentaries noted that the 18-month periods following lows in the stockbuilding cycle have been associated, on average, with strong equity market performance, outperformance of cyclical sectors and emerging markets, a fall in the US dollar, significant price rises for precious metals and commodities generally, rising “safe” government bond yields and weaker relative performance of US equities and the quality factor compared with the cycle downswing phase.
The geographical pattern of equity markets returns is also distinctive in these periods, reflecting the sensitivities of individual economies to global activity and differences in sectoral market makeup. Of the MSCI developed markets, the performance improvement between the 18-month periods before and after stockbuilding cycle lows was largest in Singapore, Hong Kong, Sweden, Canada, Spain and Australia, while Swiss, US and UK performance weakened – see table.