Subscribe
Sign up for timely perspectives delivered to your inbox.

Exchange Traded Funds (ETFs) have become synonymous with passive investing. But building a passive portfolio requires only a few broad funds to cover major asset classes and geographies. However, there are now 2000 US-listed ETFs and most are ‘closet active’ vehicles targeting a specific theme. For example, there has been a post-election boom in US financial sector ETFs, driven by the consensus view that the new Trump administration will be good for banks. These ETFs are passively managed, persified and low-cost. However, an S&P 500 Index investor already has proportionate exposure to the financial sector. Buying a financial sector, or any other sector ETF is not passive, but rather an active choice that the particular sector will outperform. It replaces stock-picking with sector-picking.
Similarly, single country ETFs (versus broad international funds) are a way to bet on a particular market. This is the opposite of the passive investing approach to “own everything”. This article looks at ETF flows to estimate how active their investors have been and how they have performed on average. The results suggest that ETF investors have the same behavioural biases of over-trading and poor market timing that mutual fund and other investors have long been faulted for. ETFs may be passive, but their investors are not.
Inpidual stocks have a reasonably fixed share count so all trades occur within the existing supply – ie, the share you buy typically comes from an existing holder. Mutual funds are usually the opposite – incoming investors add to unit count, while departing investors reduce it. ETFs use a hybrid model – your purchase of an ETF might come from a seller, or from a newly created unit.
For US-focused ETFs the creation/redemption mechanism makes it difficult to infer true flows eg, an investor could be swapping a mutual fund or existing holdings to an ETF, or units are created to facilitate short-selling, ETF/stock arbitrage, or market-making. However, these effects are less pronounced for single country ETFs traded in the US – most large-scale creation/redemption is to enable US investors to conveniently buy and sell stocks listed in a specific foreign market. Therefore, a reasonable approximation is that created units correspond to net buying, and redeemed units correspond to net selling by US investors.
Let’s look at specific examples from Japan, Europe and India ETFs to illustrate this:
After “Abenomics” started in 2013, it became a consensus view that the yen would fall, and the Nikkei would rally as Japanese exporters benefited from the weaker currency. An ETF that provides currency-hedged exposure to Japanese stocks exploded in popularity as it combines both equity and FX into a single, easy to trade security.
The chart below shows this ETF’s unit price (left axis) and shares outstanding (right axis) over the last three years. The ETF has gained 7%, and averaged $49.18 over this horizon. Looking at the chart, you can see that the number of units outstanding is quite volatile indicating very active creation/redemption. Notably, units outstanding typically went up when the price was rising, and went down as the price was falling.
[caption id=”attachment_72648″ align=”alignnone” width=”680″]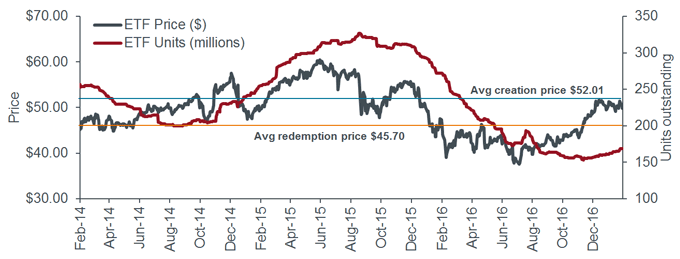 Source: Henderson Global Investors, Bloomberg, as at 31 January 2017. Chart shows price and units outstanding for the WisdomTree Japan Hedged Equity Fund.[/caption]
Looking at only the days that the ETF units were created (net buying) – the weighted average creation price of $52.01 can be estimated from the number of new units and respective closing prices. Similarly, for days that the ETF was redeemed, the weighted average redemption price is $45.70. So even in an ETF that rose, it appears that the average US investor who traded the ETF lost 12% from buying high and selling low.
There was a similar macro theme here too – bullish on European equities, but bearish on the euro. An ETF similar to the Japan example gained prominence as both retail and institutional investors flocked to this product in 2014-15 before many exited in 2016.
The ETF has risen 6% over the last three years. However, based on flows the active ETF investor has done poorly. The ETF averaged $57.08, but the average creation was at $61.99 and average redemption was at $52.99, resulting in a 15% loss on transacted units due to poor timing and return chasing.
[caption id=”attachment_72670″ align=”alignnone” width=”680″]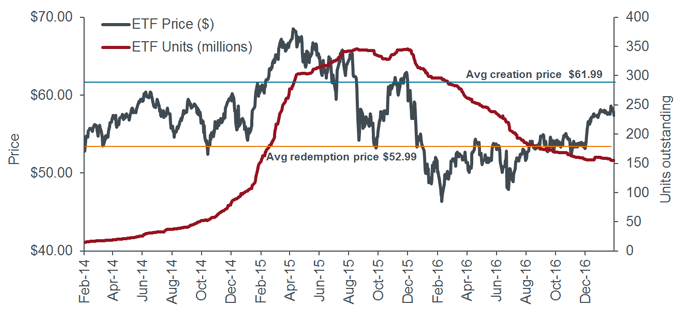 Source:Henderson Global Investors, Bloomberg, as at 31 January 2017. Chart shows price and units outstanding for the WisdomTree Europe Hedged Equity Fund.[/caption]
The 2014 election of Prime Minister Modi led a spike in foreign interest in India as prospective government reforms dovetailed with good demographics, rapid GDP growth and a windfall from lower commodities prices. Buy-and-hold investors have done well in India, especially compared to other emerging markets. The most traded Indian ETF is up 32% over the last three years.
But like the other countries, ETF tourists to India have tripped over themselves. The average creation price is $22.07 and the average redemption price is $20.26, resulting in an 8% loss on transacted units. US investors appear to have bought and sold the ETF at almost exactly the wrong times.
[caption id=”attachment_72659″ align=”alignnone” width=”680″]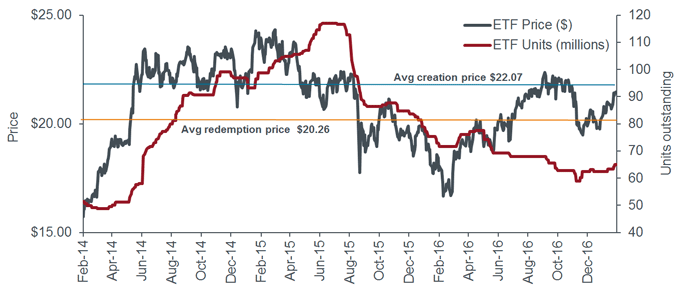 Source:Henderson Global Investors, Bloomberg, as at 31 January 2017. Chart shows price and units outstanding for the WisdomTree India Earnings Fund.[/caption]
Returning to the US – we can see that the number of units outstanding in a popular financial sector ETF was at a 15-month low prior to the US election. ETF investors had been consistently exiting bank stocks. The election result quickly changed the narrative, causing the number of units to jump over 50% since November.
[caption id=”attachment_72626″ align=”alignnone” width=”680″]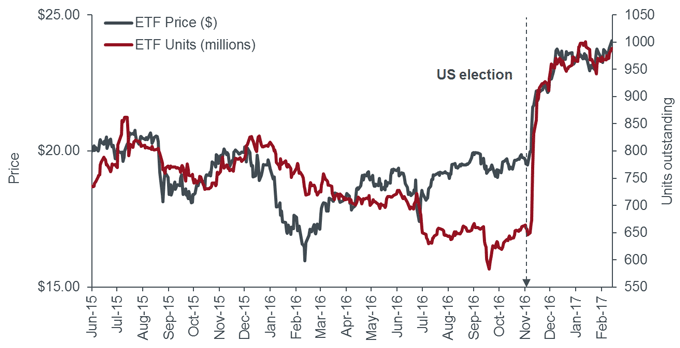 Source: Henderson Global Investors, Bloomberg, as at 13 February 2017. Chart shows price and units outstanding for the Financial Select Sector SPDR Fund.[/caption]
How this turns out remains to be seen, but this surge in appetite for financials ETFs is clearly an active bet, not a passive one. The main difference between this and “old-school” stock-picking is the absence of company analysis within the sector. ETF investors are making a “one-click” decision to buy banks while other stockholders are by definition selling to them – notably share sales by bank employees have risen recently. To be clear, this is not a fault of ETFs – rather that ETF investors can have the same behavioural biases as other investors. However, the ETF structure perhaps lulls some people into a false sense of security as it seems safer and “passive”. Unless you are buying the entire market (or a reasonable approximation of it) on a buy-and-hold basis, you are “active” regardless of your choice of asset vehicle.
ETFs are becoming the new stocks – the number of US-listed ETFs is rising even as the number of US-listed firms is falling (see chart below). This growth is creating more niche ETFs and encouraging frequent transactions. Crowding into a popular ETF theme is as problematic and “active” as chasing a hot stock.
[caption id=”attachment_72637″ align=”alignnone” width=”680″]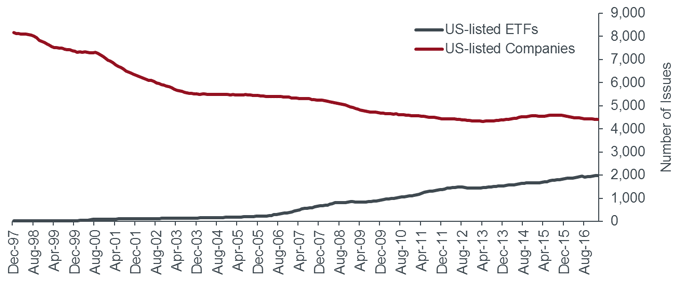 Source:Ned Davis Research, as at 31 January 2017.[/caption]