Subscribe
Sign up for timely perspectives delivered to your inbox.
Ben Lofthouse, Portfolio Manager of Henderson International Income Trust discusses the half-year results, including the key drivers of performance, changes made to the portfolio and the key risks to watch out for. Ben also provides his outlook for global dividends in the coming months.

Balance Sheet – A financial statement that summarises a company’s assets, liabilities and shareholders’ equity at a particular point in time. Each segment gives investors an idea as to what the company owns and owes, as well as the amount invested by shareholders. It is called a balance sheet because of the accounting equation: assets = liabilities + shareholders’ equity.
Cash flow – Cash that a company generates after allowing for day-to-day running expenses and capital expenditure. It can then use the cash to make purchases, pay dividends or reduce debt.
Net asset value (NAV) – The total value of a fund’s assets less its liabilities
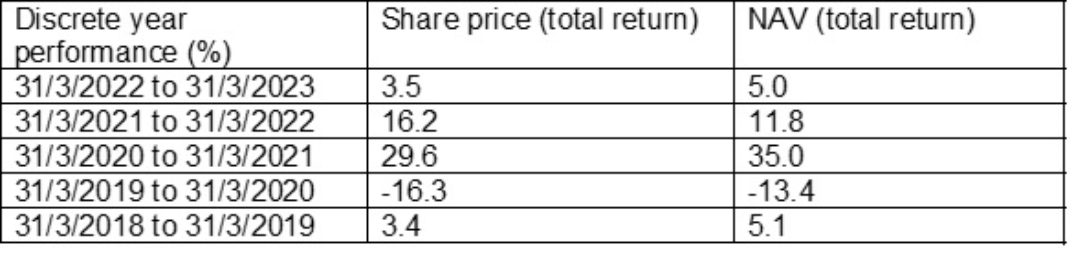
Discrete Performance
Not for onward distribution. Before investing in an investment trust referred to in this document, you should satisfy yourself as to its suitability and the risks involved, you may wish to consult a financial adviser. This is a marketing communication. Please refer to the AIFMD Disclosure document and Annual Report of the AIF before making any final investment decisions. Past performance does not predict future returns. The value of an investment and the income from it can fall as well as rise and you may not get back the amount originally invested. Tax assumptions and reliefs depend upon an investor’s particular circumstances and may change if those circumstances or the law change. Nothing in this document is intended to or should be construed as advice. This document is not a recommendation to sell or purchase any investment. It does not form part of any contract for the sale or purchase of any investment. We may record telephone calls for our mutual protection, to improve customer service and for regulatory record keeping purposes.
Issued in the UK by Janus Henderson Investors. Janus Henderson Investors is the name under which investment products and services are provided by Janus Henderson Investors International Limited (reg no. 3594615), Janus Henderson Investors UK Limited (reg. no. 906355), Janus Henderson Fund Management UK Limited (reg. no. 2678531), (each registered in England and Wales at 201 Bishopsgate, London EC2M 3AE and regulated by the Financial Conduct Authority) and Janus Henderson Investors Europe S.A. (reg no. B22848 at 2 Rue de Bitbourg, L-1273, Luxembourg and regulated by the Commission de Surveillance du Secteur Financier).
Janus Henderson, Knowledge Shared and Knowledge Labs are trademarks of Janus Henderson Group plc or one of its subsidiaries. © Janus Henderson Group plc
Sign up for timely perspectives delivered to your inbox.