

Subscribe
Sign up for timely perspectives delivered to your inbox.
Is there a statistical relationship between fund flows and market price moves? Portfolio Manager Aneet Chachra evaluates and quantifies the linkage between equity fund flows and simultaneous price moves in the S&P 500® Index.

A known but sometimes overlooked aspect of stocks is that the number of outstanding shares at any given moment is fixed. Someone, whether a person or institution, owns each share. Importantly, the vast majority of equity market transactions do not involve shares being created or destroyed but are instead just a transfer of ownership between buyers and sellers. New issuance of shares (such as initial public offerings or secondary offerings) or removal of shares (such as cash takeovers or stock buybacks) account for only a small percentage of trades.
This contrasts with other markets such as physical commodities. For example, it is not known precisely how many barrels of crude oil are currently outstanding. That number is also quickly changing as new oil is extracted and the existing stock of oil is permanently burned. Consequently, trading commodities is inherently difficult because this constant flow makes oil prices very sensitive to small shifts in production or consumption.
However, equity markets can also be quite volatile, even with the number of outstanding shares changing only slowly. Does buying or selling by funds contribute to this volatility or affect prices?
Thinking through this question highlights a paradox.
It seems obvious that “buying” should have a price impact. We see this effect in every other aspect of our life: more demand for anything leads to a higher price. On the other hand, every share buyer is matched with a share seller. For every market participant spending cash by buying shares, there is an offsetting market participant receiving cash by selling shares. Thus, the aggregate amount of cash and number of shares is normally unchanged by the transaction.
Fortunately, we can test for a price impact (or lack thereof) using aggregated fund flow data. The Investment Company Institute (ICI) publishes fund industry statistics. One particularly useful data set from ICI is weekly net money flows into U.S. equity funds; notably, this series includes both mutual funds and exchange-traded funds. Data is available from 2013 onward, corresponding to about 530 weekly data points.
We normalize these weekly net money flows (in dollars, whether positive or negative) into percentage of U.S. equity market capitalization figures to adjust for changes in market size through the last decade. We then compare these net equity fund flows to S&P 500 price change during the same week.
The results (Exhibit 1) show that fund flows do impact prices. Between January 2013 to February 2023, for weeks with net equity fund inflows, the S&P 500 averaged a +0.66% weekly gain. Additionally, the S&P 500 had a positive return in 72% of inflow weeks.
However, for weeks with net equity fund outflows, the S&P 500 averaged a -0.12% weekly loss. Further, the S&P 500 had a positive return in only 53% of outflow weeks.
|
|
1-week average S&P 500 change (%) | % of weeks where the S&P 500 went up |
| Net money inflow weeks | +0.66% | 72% |
| Net money outflow weeks | -0.12% | 53% |
Source: ICI, Bloomberg, Janus Henderson Investors, January 2013 to February 2023.
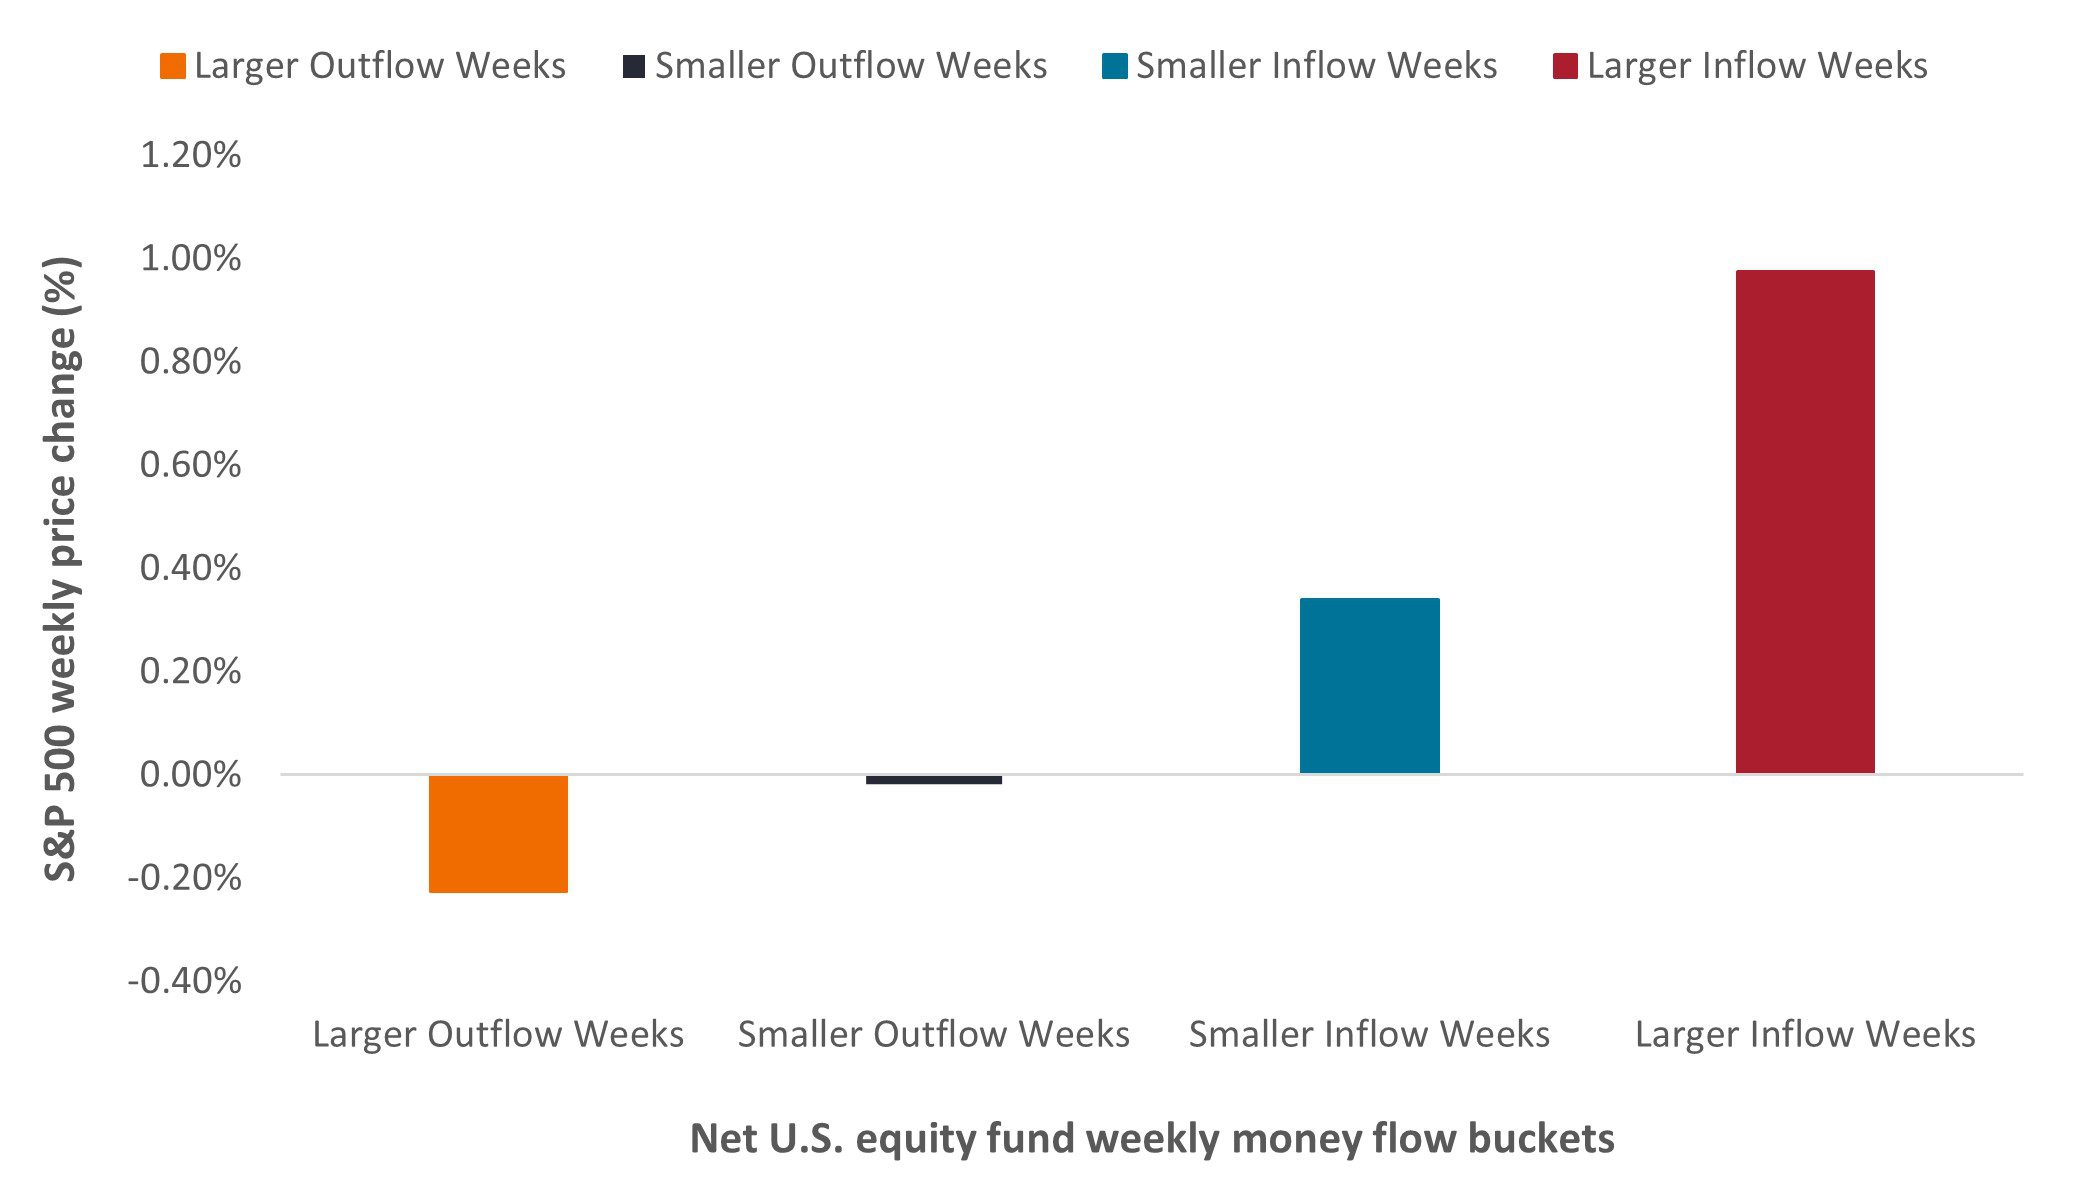
We can also study this relationship on a more granular level by filtering weeks into four buckets – large outflows, small outflows, small inflows, large inflows. If fund flows are impacting price, we would expect to see a positive correlation between flow direction/magnitude and price changes.
Exhibit 2 shows average weekly S&P 500 returns for each of these buckets. The result was as expected, with more flows (whether positive or negative) corresponding to a greater average price impact (up or down).
 Source: ICI, Bloomberg, Janus Henderson Investors, January 2013 to February 2023. Past performance is no guarantee of future results.
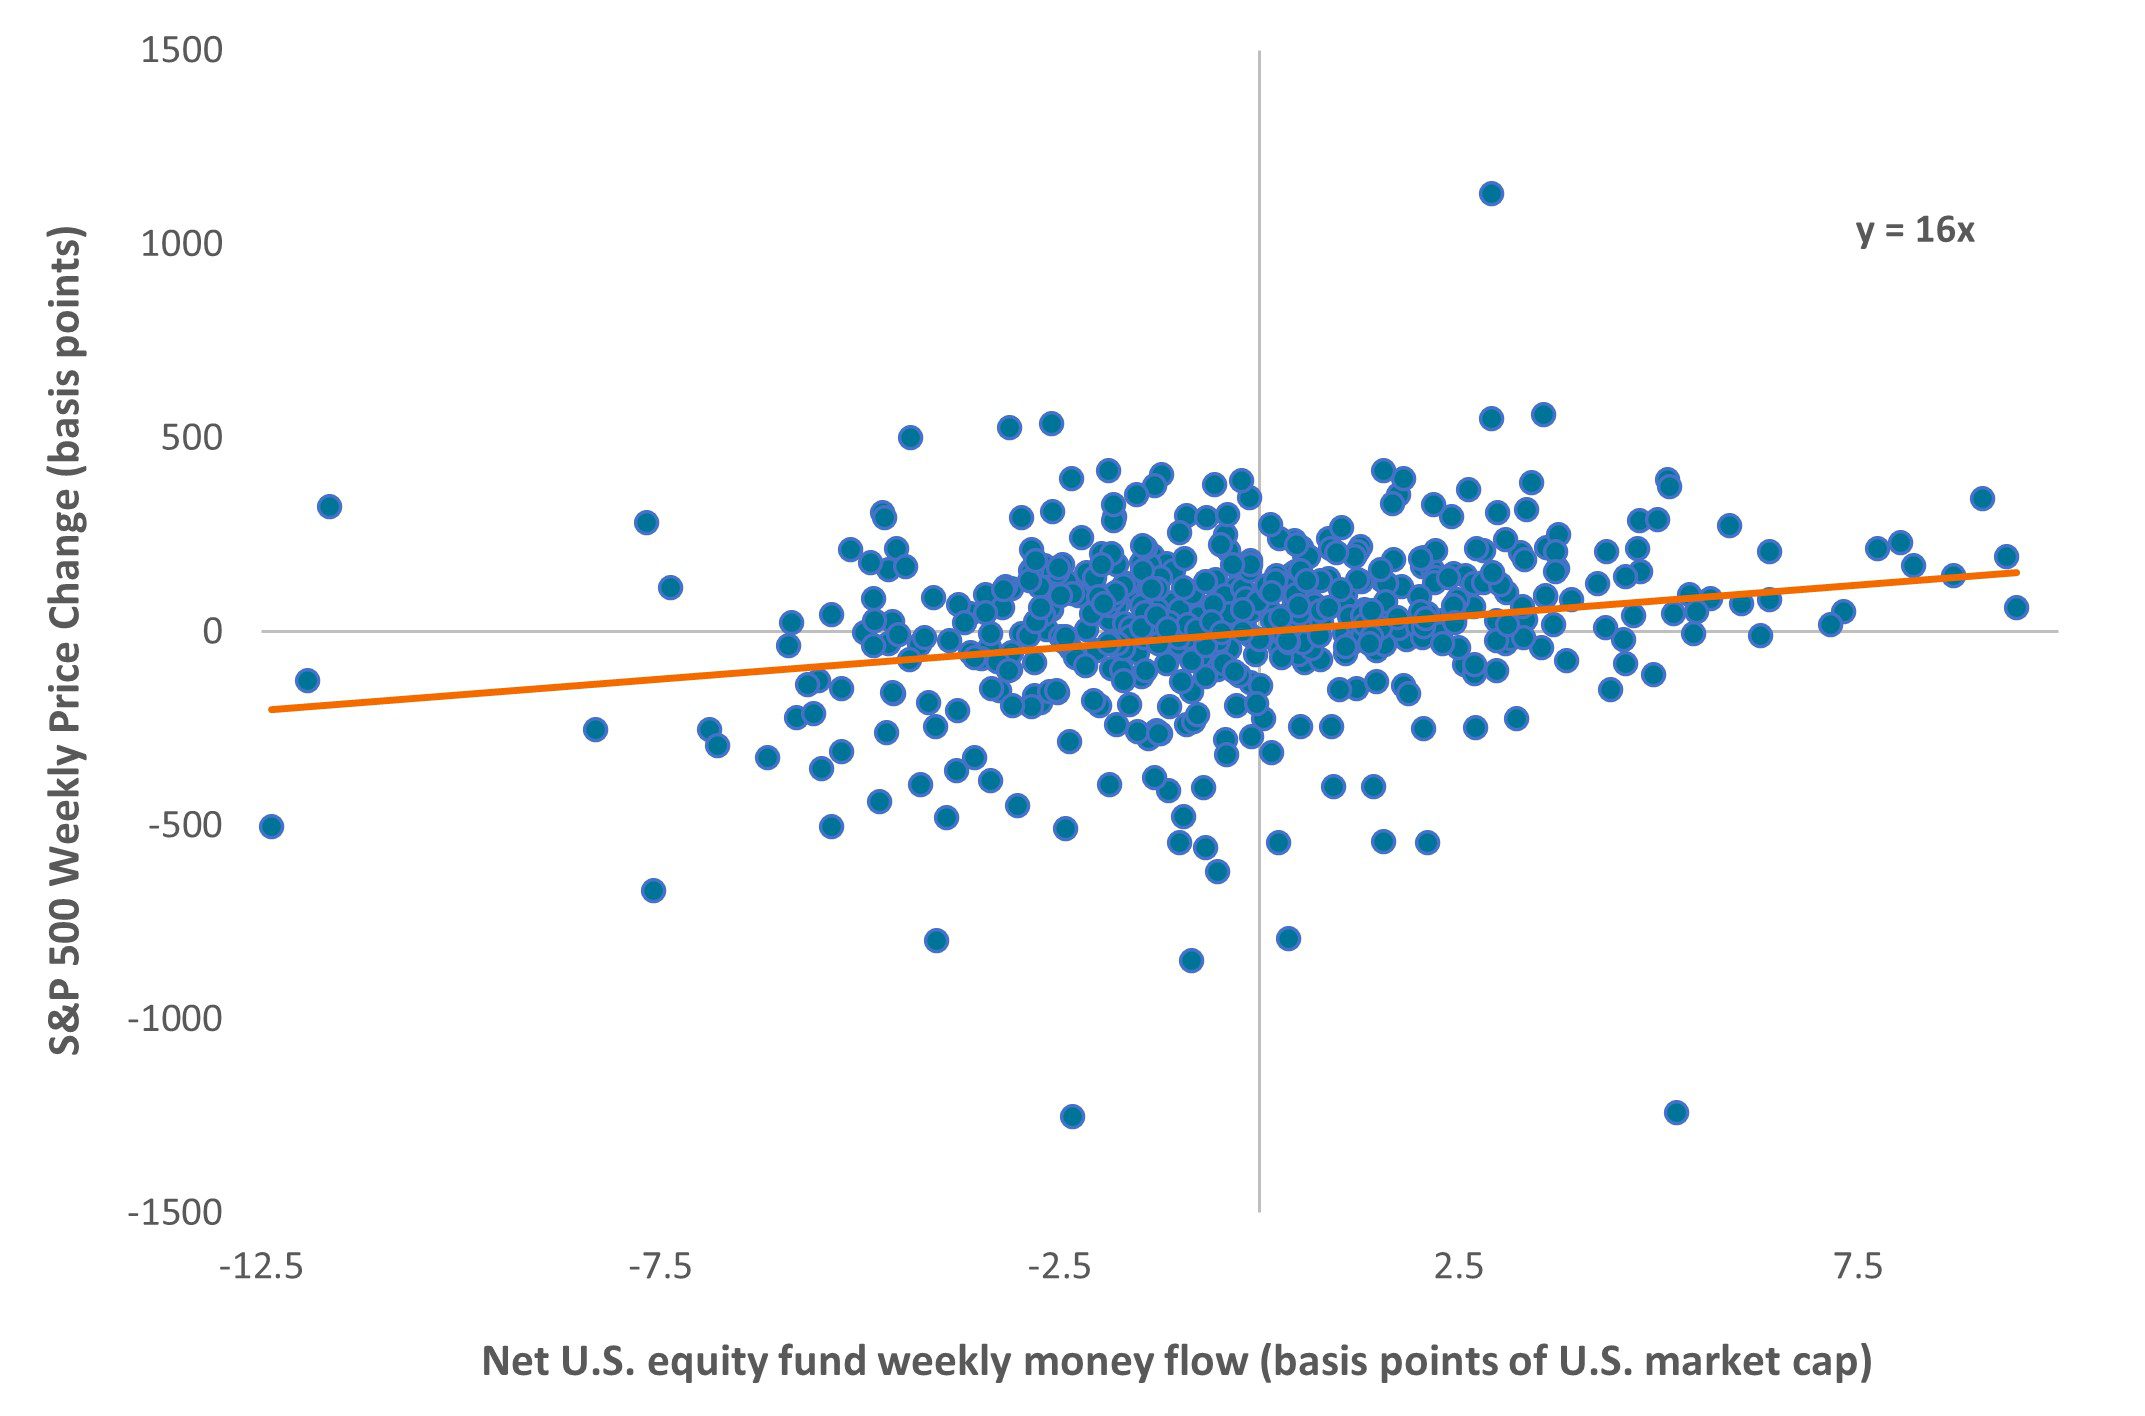
The above analysis focused on aggregated data because individual weekly data points for both fund flows and particularly for stock price moves can be quite choppy. Fund flows are important but are only one explanatory variable for why equity markets are volatile week to week. We calculate that the correlation between weekly fund flow and corresponding S&P 500 price move is about +0.23.
Nevertheless, plotting weekly net fund flows vs. S&P 500 price changes (Exhibit 3) is useful to roughly quantify the expected price impact of a given weekly fund flow. The slope of the regression (orange line below) provides an average estimate of this link. With the obvious caveat that there is wide variability as the plot shows, we calculate that the average flow-to-price multiplier is about 16x.
This flow-to-price multiplier means that, for example, 6 basis points (+0.06%) of net inflow (or outflow) in U.S. equity funds over a week is associated with a nearly 1% rise (or fall) in the S&P 500 that week.
 Source: ICI, Bloomberg, Janus Henderson Investors, January 2013 to February 2023. Past performance is no guarantee of future results.
To put this sort of flow into context, total U.S. market cap is currently about $42 trillion – thus a 6 basis point net inflow is about $25 billion of cash going into funds over a week. This demonstrates that even a relatively modest money flow can result in a meaningful S&P 500 price change even though buyers and sellers of stocks are, for the most part, matched up.
There may be other confounding factors, but the results above imply that fund inflows (on average) can push up prices materially to incentivize other investors to sell stock and take cash instead. Conversely, fund outflows (on average) can push down prices to incentivize other investors to buy stock and provide cash. Fund flows do appear to affect prices.
This example also illustrates that, despite “the same number of buyers and sellers,” market prices can still vary considerably due to different price sensitivities of various investors.
Conversely, any price-insensitive flow can provide attractive opportunities for active strategies that recognize impending flows and take the “other side” of these inflexible strategies. This is potentially a win-win outcome for both parties.
The inflexible investor pays a small average statistical cost for targeting a particular execution time, size, and security, while a more flexible and defter counterparty can potentially benefit by providing this service.
Basis point (bp) equals 1/100 of a percentage point. 1 bp = 0.01%, 100 bps = 1%.
Correlation measures the degree to which two variables move in relation to each other. A value of 1.0 implies movement in parallel, -1.0 implies movement in opposite directions, and 0.0 implies no relationship.
S&P 500® Index reflects U.S. large-cap equity performance and represents broad U.S. equity market performance.
IMPORTANT INFORMATION
Actively managed portfolios may fail to produce the intended results. No investment strategy can ensure a profit or eliminate the risk of loss.
Equity securities are subject to risks including market risk. Returns will fluctuate in response to issuer, political and economic developments.
Commodities (such as oil, metals and agricultural products) and commodity-linked securities are subject to greater volatility and risk and may not be appropriate for all investors. Commodities are speculative and may be affected by factors including market movements, economic and political developments, supply and demand disruptions, weather.
Sign up for timely perspectives delivered to your inbox.