
Subscribe
Sign up for timely perspectives delivered to your inbox.
Head of Equity Research Matt Peron explains how investors can navigate the disconnect between a slowing economy and a market rally by identifying quality companies capable of generating attractive returns in an era of higher capital costs.


At the end of last year, we released our 2023 Market GPS outlook highlighting what we viewed as the themes and potential scenarios that would likely impact financial markets over the coming quarters. We expected that inflation, central banks’ response to it, and these forces’ impact on the global economy would continue to heavily influence the trajectory of asset prices.
Since then, an array of new data has allowed investors to update their assessment of the economy and what that means for markets. What have we learned?
First, inflation’s torrid pace has slowed, but a tight labor market presents challenges for central banks seeking to stem persistent upward wage pressure. Second, the economy is cooling, but the jury is out on whether a material recession can be averted. And third, earnings expectations – despite being modestly revised downward – may not sufficiently reflect the threat to corporate profitability as the full brunt of hawkish policies’ long and variable lags become evident.
While these developments merit further monitoring, we believe another factor will likely take an increasingly prominent role in determining investment outcomes: individual company performance.
Last year’s historic surge in the cost of capital ended the free lunch that lent a veneer of promise to corporations with challenged business models and an inability to consistently generate free cash flow. Rather than attempting to divine how much the economy will slow, we believe we are reaching a point where excess investment returns will again be driven by identifying companies that are able to prove they can stand on their own in a more normalized rate environment.
Still, given the degree to which both equities and bonds have rallied – despite evidence of a cooling economy and a Federal Reserve (Fed) that appears resolute in its hawkishness – we believe the risk of the market being caught offsides has risen should future developments validate our view that downside risks are not fully reflected in asset prices.
Exacerbating matters (as we discussed in an October note) is the degree to which uncertain markets react to almost every new data point as investors seek direction in a period of high correlation among asset classes. Instead, they would be better served by focusing on the arc of macro developments to gain insight into economic trends.
To that end, highlighted below are a series of indicators that we believe should prove useful over the coming months in monitoring the ongoing tension between a tepid economy and optimistic investors.
The Institute for Supply Management’s Purchasing Manager’s Index (PMI) has spent three months in contraction territory. This aligns with other evidence of goods consumption having slowed. While comprising a relatively small share of the U.S. economy, the ebbs and flows of manufacturing can ripple across other economic segments. A notably forward-looking manufacturing subindex is new orders: It has signaled contracting activity for five months and, perhaps more telling, has been below the inventory subindex since May 2022. An inversion of this magnitude can portend looming recession as companies are saddled with products they are unable to move.
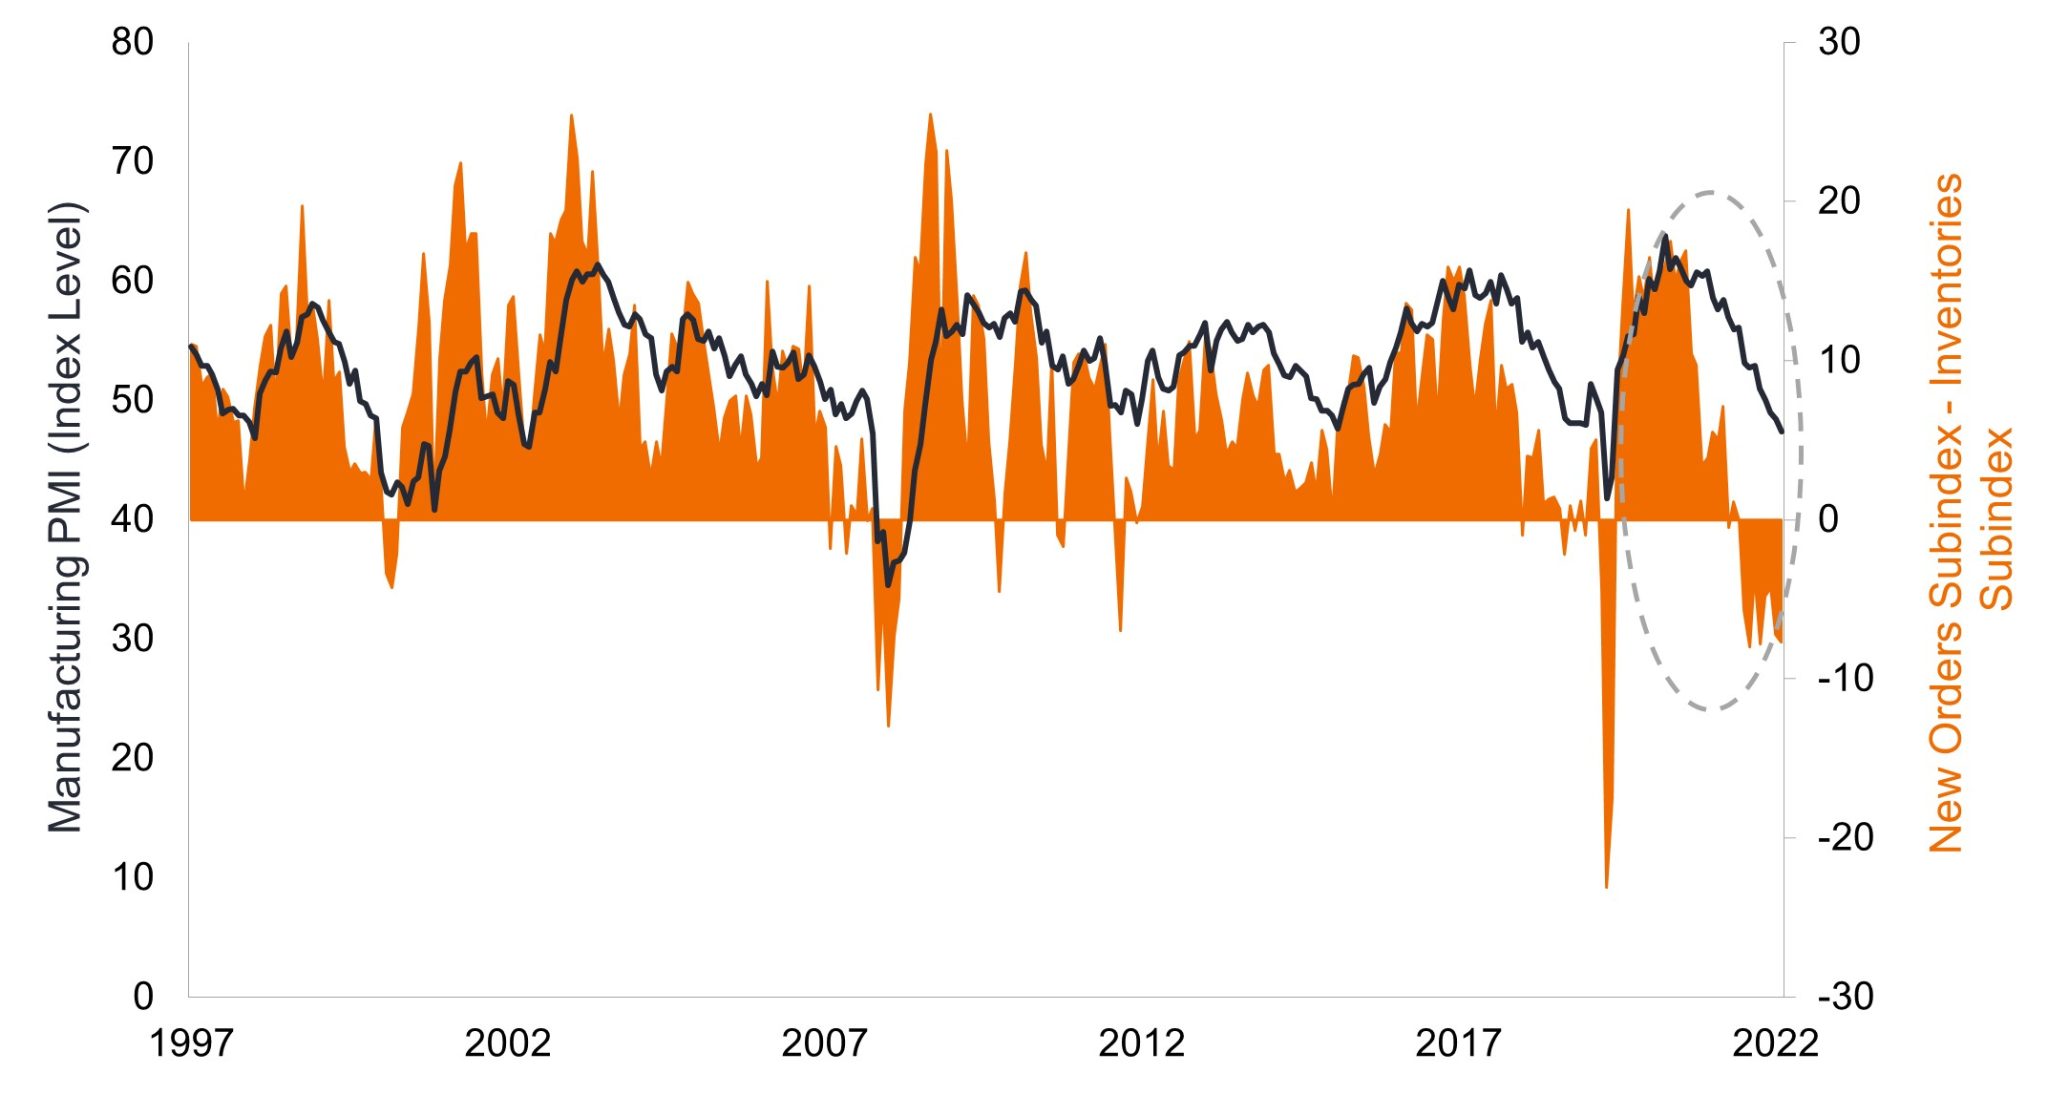
Source: Bloomberg, as of 31 January 2023.
The services PMI, on the other hand, illustrates the resilience of that – much larger – economic segment. After contracting in December, January’s reading of 55.2 (above 50 indicates expansion) exceeded expectations. While one should not pin too much on a single data point, a buoyant services sector hints at consumers still willing to open their wallets. This can be taken as a sign that they remain relatively confident in their employment and inflation hasn’t led to broad-based demand destruction.
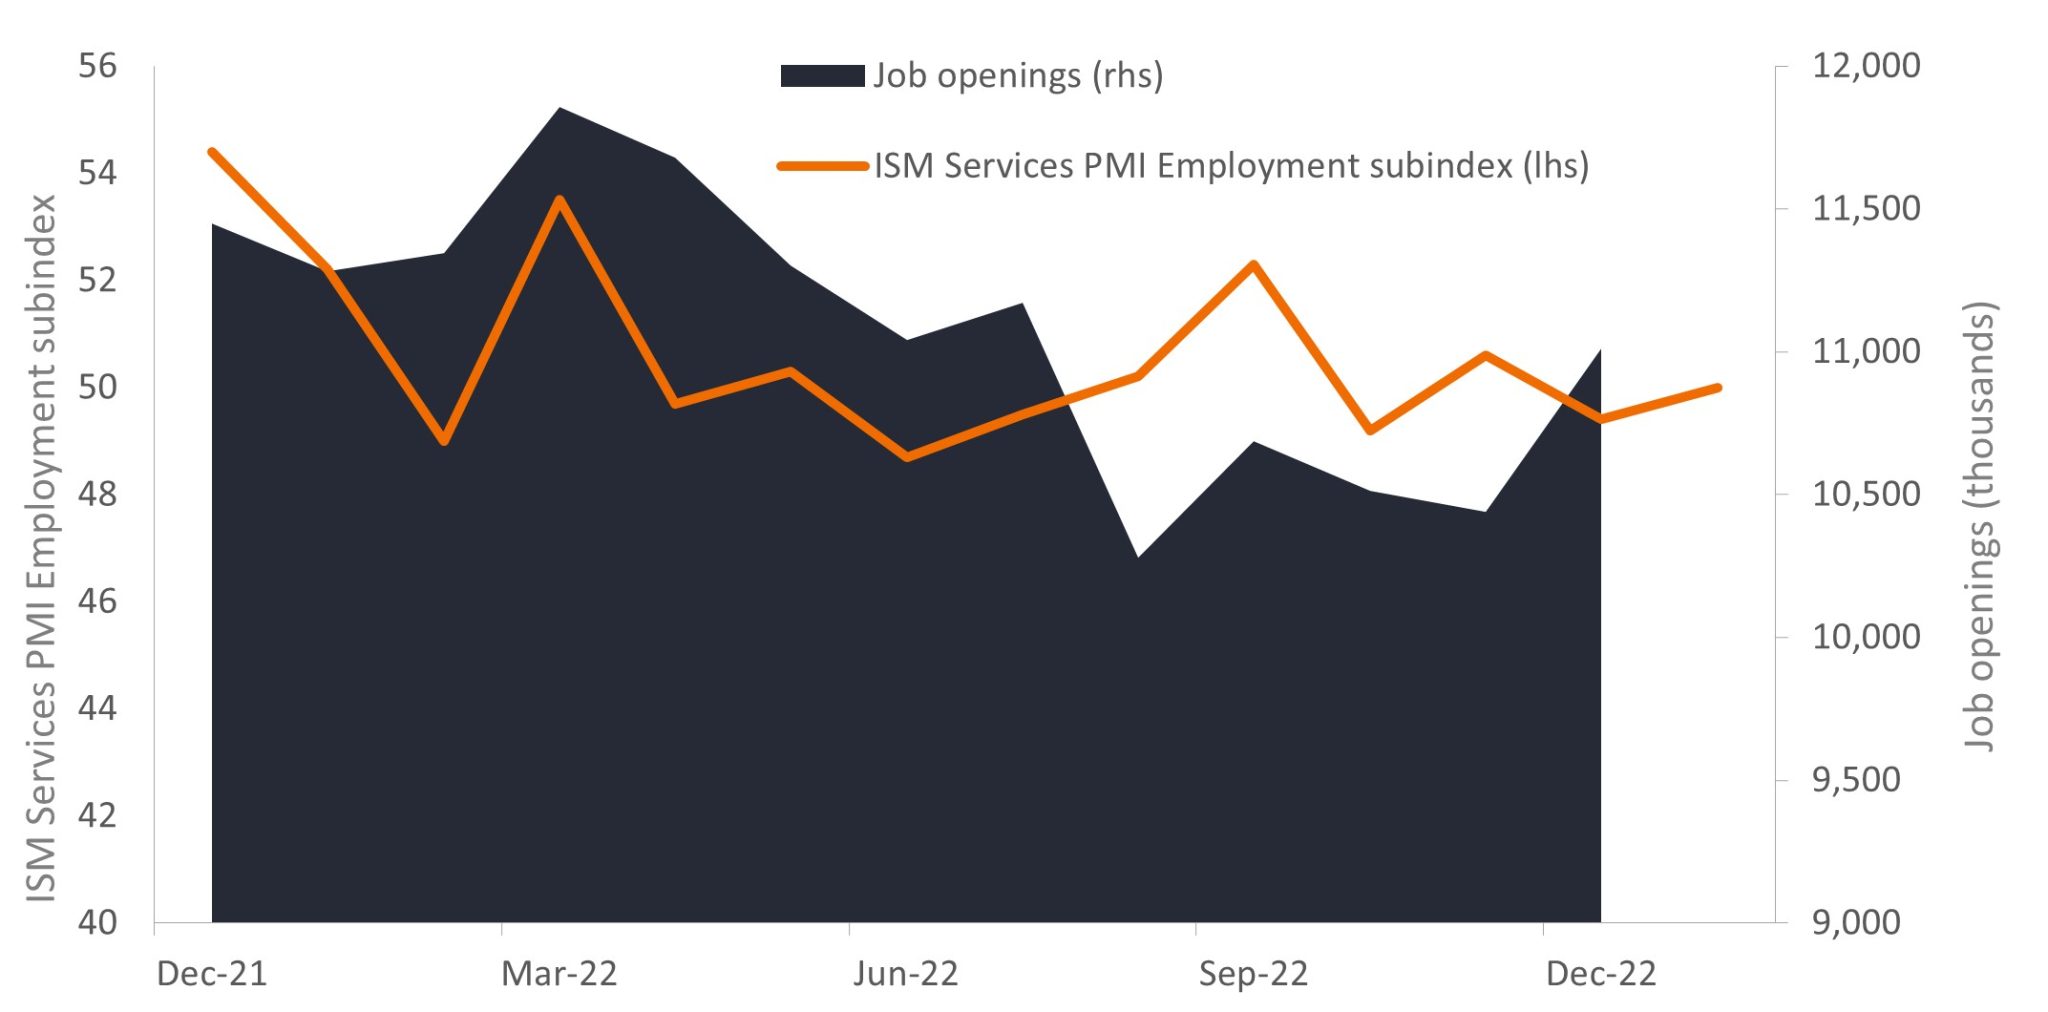
Source: Bloomberg, as of 31 January 2023.
Of note is the services employment subindex still treading water. We believe labor market strength will be particularly worrisome for the Fed in its quest to guide inflation toward its 2.0% target. The central bank itself has stated that the current unemployment rate of 3.4% – a record low – will need to climb in order to ease upward wage pressure. That’s easier said than done given the roughly 11 million positions on offer in the U.S. economy. With December’s year-over-year compensation of 5.1% barely ahead of headline inflation (5.0%) and seven-tenths of a percentage point above the Fed’s favored measure of core inflation, workers will likely continue to press for higher wages to maintain purchasing power.
The Fed’s fixation on service-sector wages appears justified by services’ rising contribution to overall inflation. The pandemic-era’s scramble for home items coupled with supply disruptions resulted in goods being a major contributor to inflation. Later, energy drove broader prices higher as Russia’s invasion of Ukraine upended commodities markets. As upward pressure linked to those categories has subsided, services’ role in inflation has grown more prominent. With wages comprising a material portion of services’ costs, pay will likely have to let off some steam for inflation’s moderating trajectory to continue.
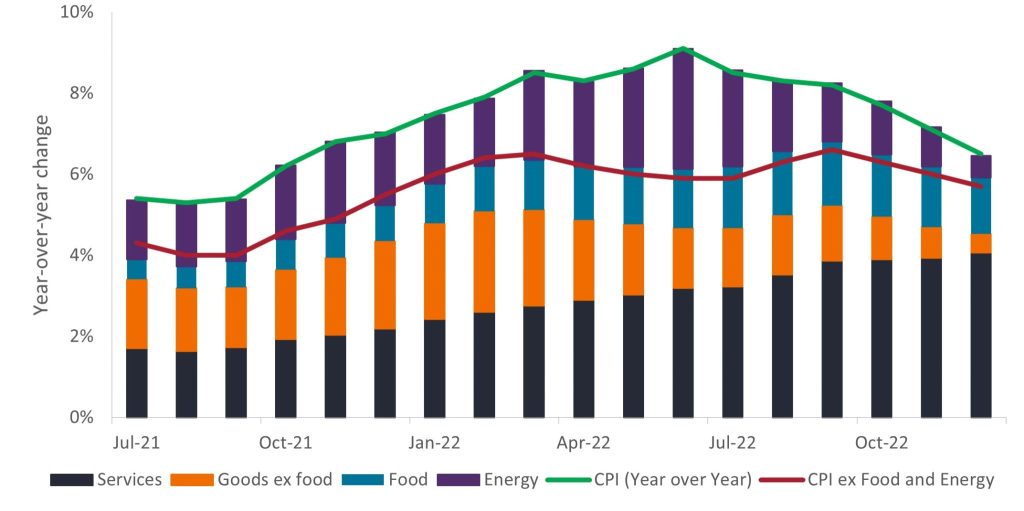 Source: Bloomberg, as of 31 January 2023.
The Fed continues to raise its policy rate, albeit at a slower pace than last year’s 75 basis-point (bps) increments. The European Central Bank is maintaining a more aggressive cadence of 50 bps, though it has more ground to make up. Equally important are central bankers’ comments telegraphing future actions. For its part, the Fed has been adamant in its bias toward additional rate increases. The market has been slow to get the message, interpreting that a moderating pace harkens an eventual pivot, perhaps as early as September – and this timeframe has only recently been extended. What had been a yawning gap in year-end rate levels between market expectations and the Fed’s internal survey has narrowed. This may lower the risk of a fierce correction should the Fed live up to its word by raising rates another 50 bps by year end.
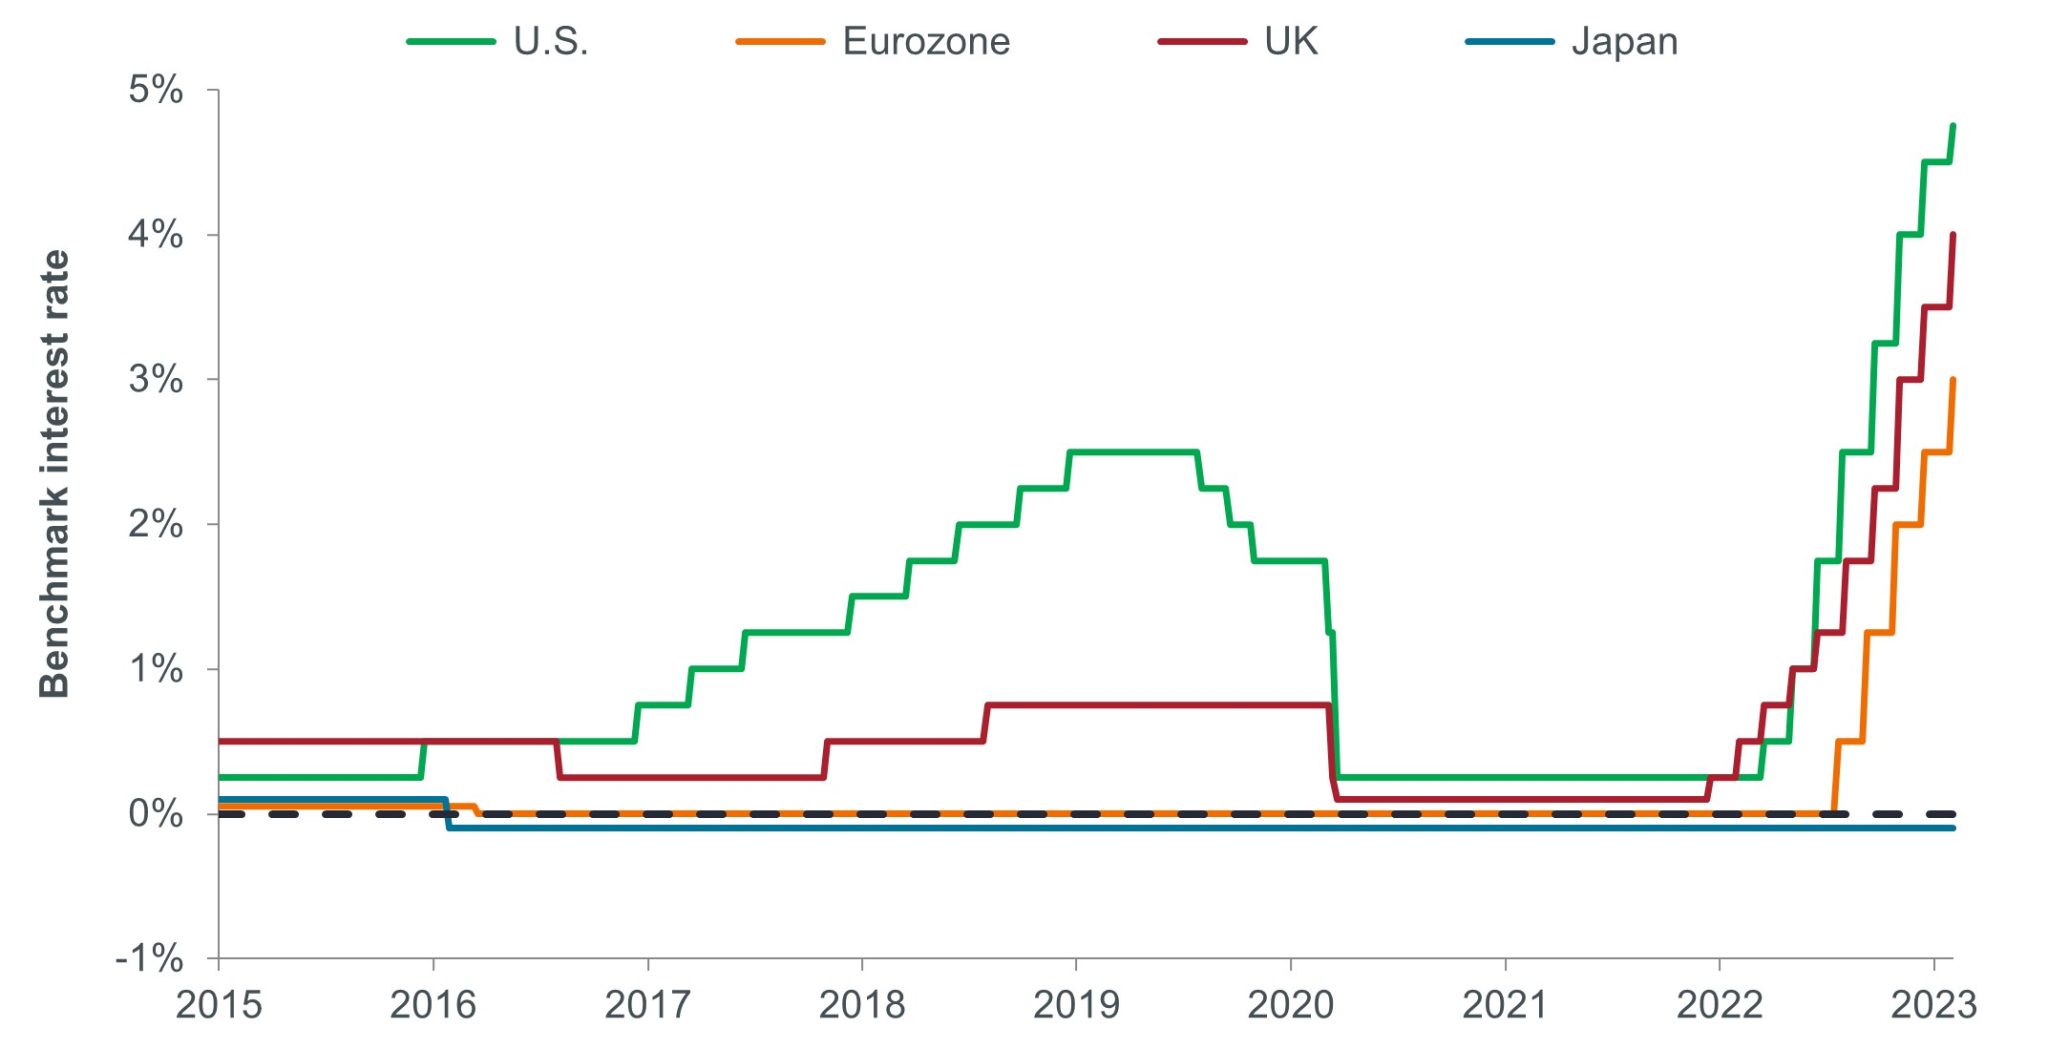
Source: Bloomberg, as of 31 January 2023.
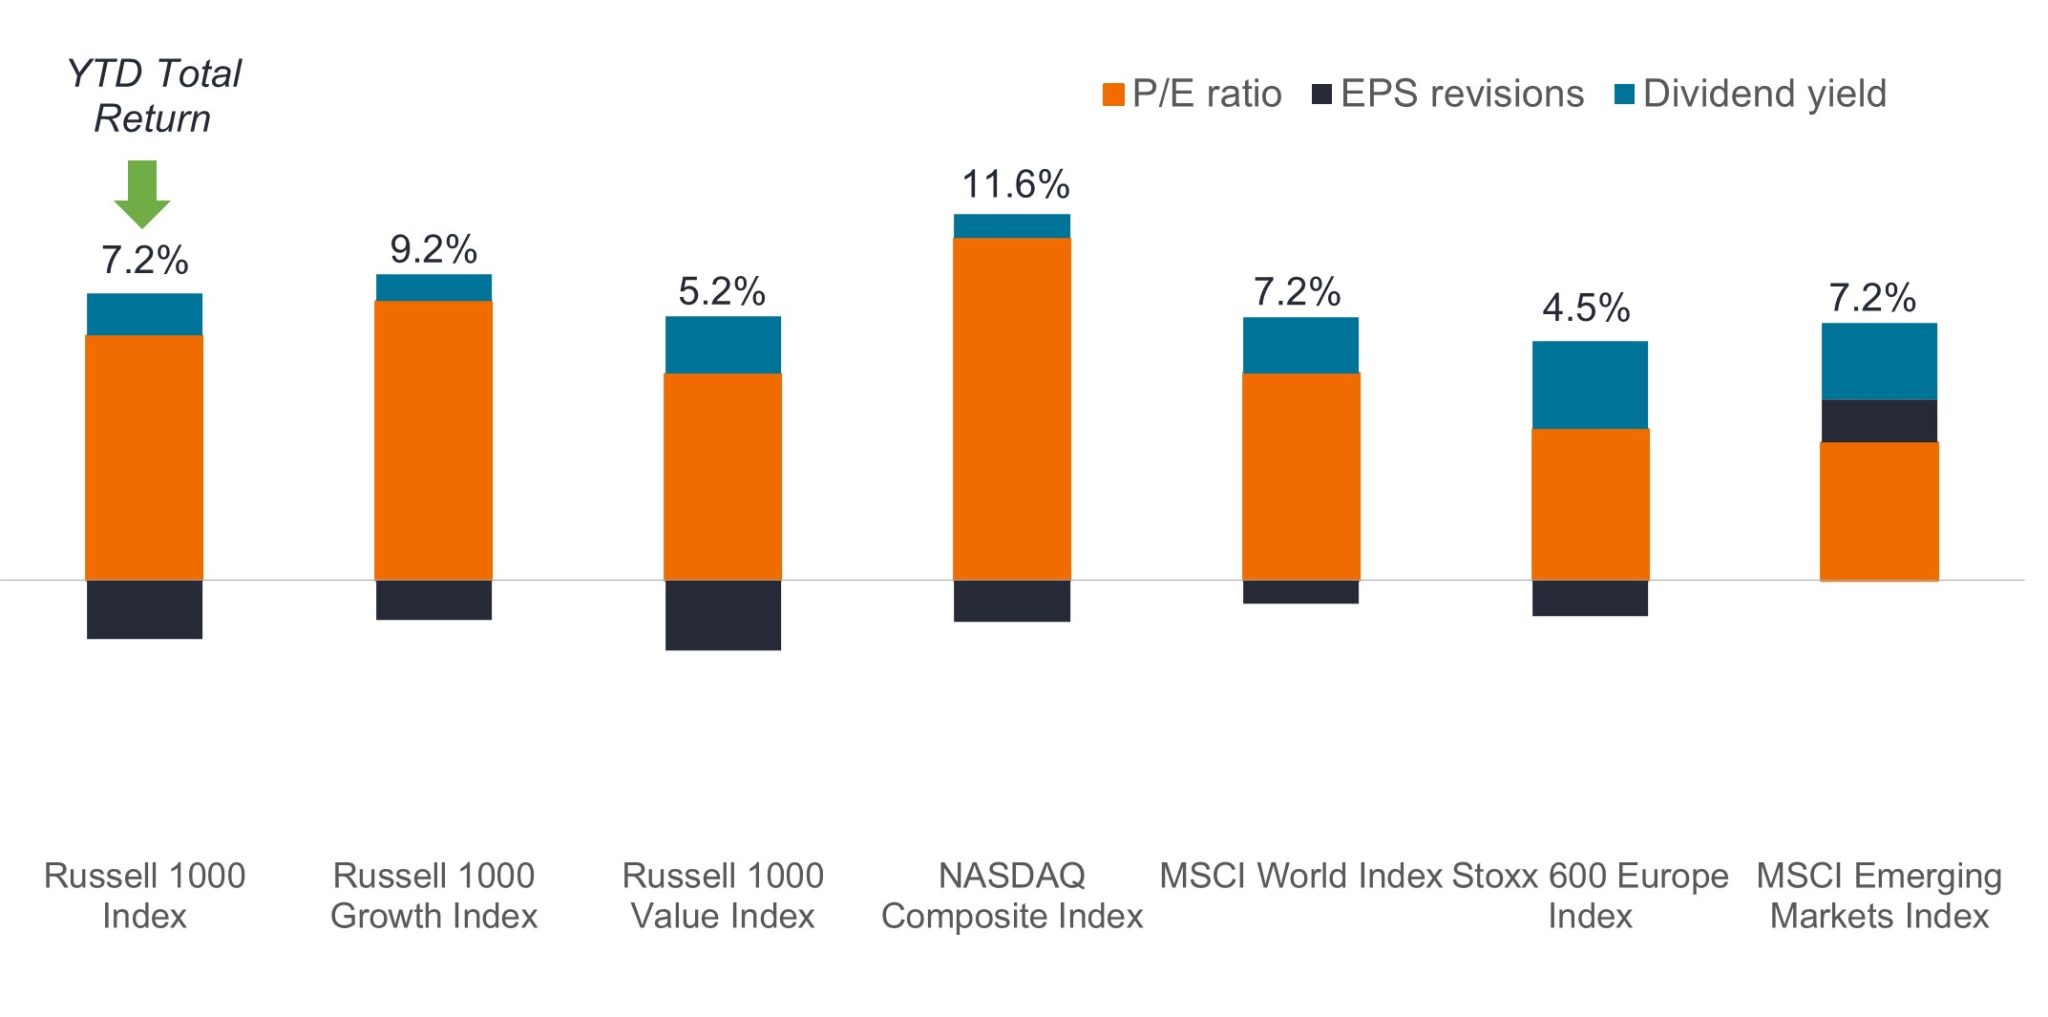
Despite mounting evidence of a slowing economy and policy rates staying higher than many expect, markets have rallied across the board year to date. Stocks have gained on expanding valuation multiples. Implicit in this is the expectation that a falling discount rate – itself driven by policy rates – will bolster valuations. We consider this a spurious assumption.
One factor that is clearly not behind equities’ gains are upward earnings revisions, which are negative. Given the gathering economic clouds, however, they have been revised downward less than we would have expected. For the Fed to cool wage growth by driving up unemployment, year-over-year earnings would, in our view, have to contract by 15% to 20% to compel companies to initiate layoffs. Thus far, full-year 2023 earnings estimates on the S&P 500® Index have only fallen by 2.3%.
Source: Bloomberg, as of 31 January 2023.
Justification for equities’ year-to-date multiple expansion, however, can be found in inflation’s recent downward trend. No longer are consumer prices increasing at a rate that is punitive to all asset classes. While still well above the levels experienced over the past decade, at 4.4%, core inflation is falling toward a range that is potentially supportive of equities, as companies can pass along higher input costs and – in contrast to fixed bond payments – increase dividends. Stocks’ fate over the next few quarters will likely be determined by the degree to which falling inflation can offset potentially weaker earnings and a higher cost of capital.
The underpinnings of bonds’ 2023 rally appear similarly delicate. After having peaked at 4.72% in November, the yield on the 2-year U.S. Treasury fell to as low as 4.08% as the market positioned itself for an imminent Fed pivot. The risk of this dovish positioning was exposed in recent sessions when yields across the Treasuries curve rose on recurrent hawkish messaging from Fed Chairman Jerome Powell.
Corporate bond gains have been driven by the narrowing of the difference (spreads) between their yields and those of their risk-free benchmarks. As with stocks, this optimism appears premised on the belief that the Fed would eventually blink and a rate-induced economic slowdown could be averted. Corporate balance sheets are healthy, but this is truer for investment-grade issuers than it is for companies with high-yield ratings, especially those with cyclical exposure. With bond spreads below their 10-year averages, a worse-than-expected slowdown could result in a pronounced repricing of securities with shaky fundamentals.
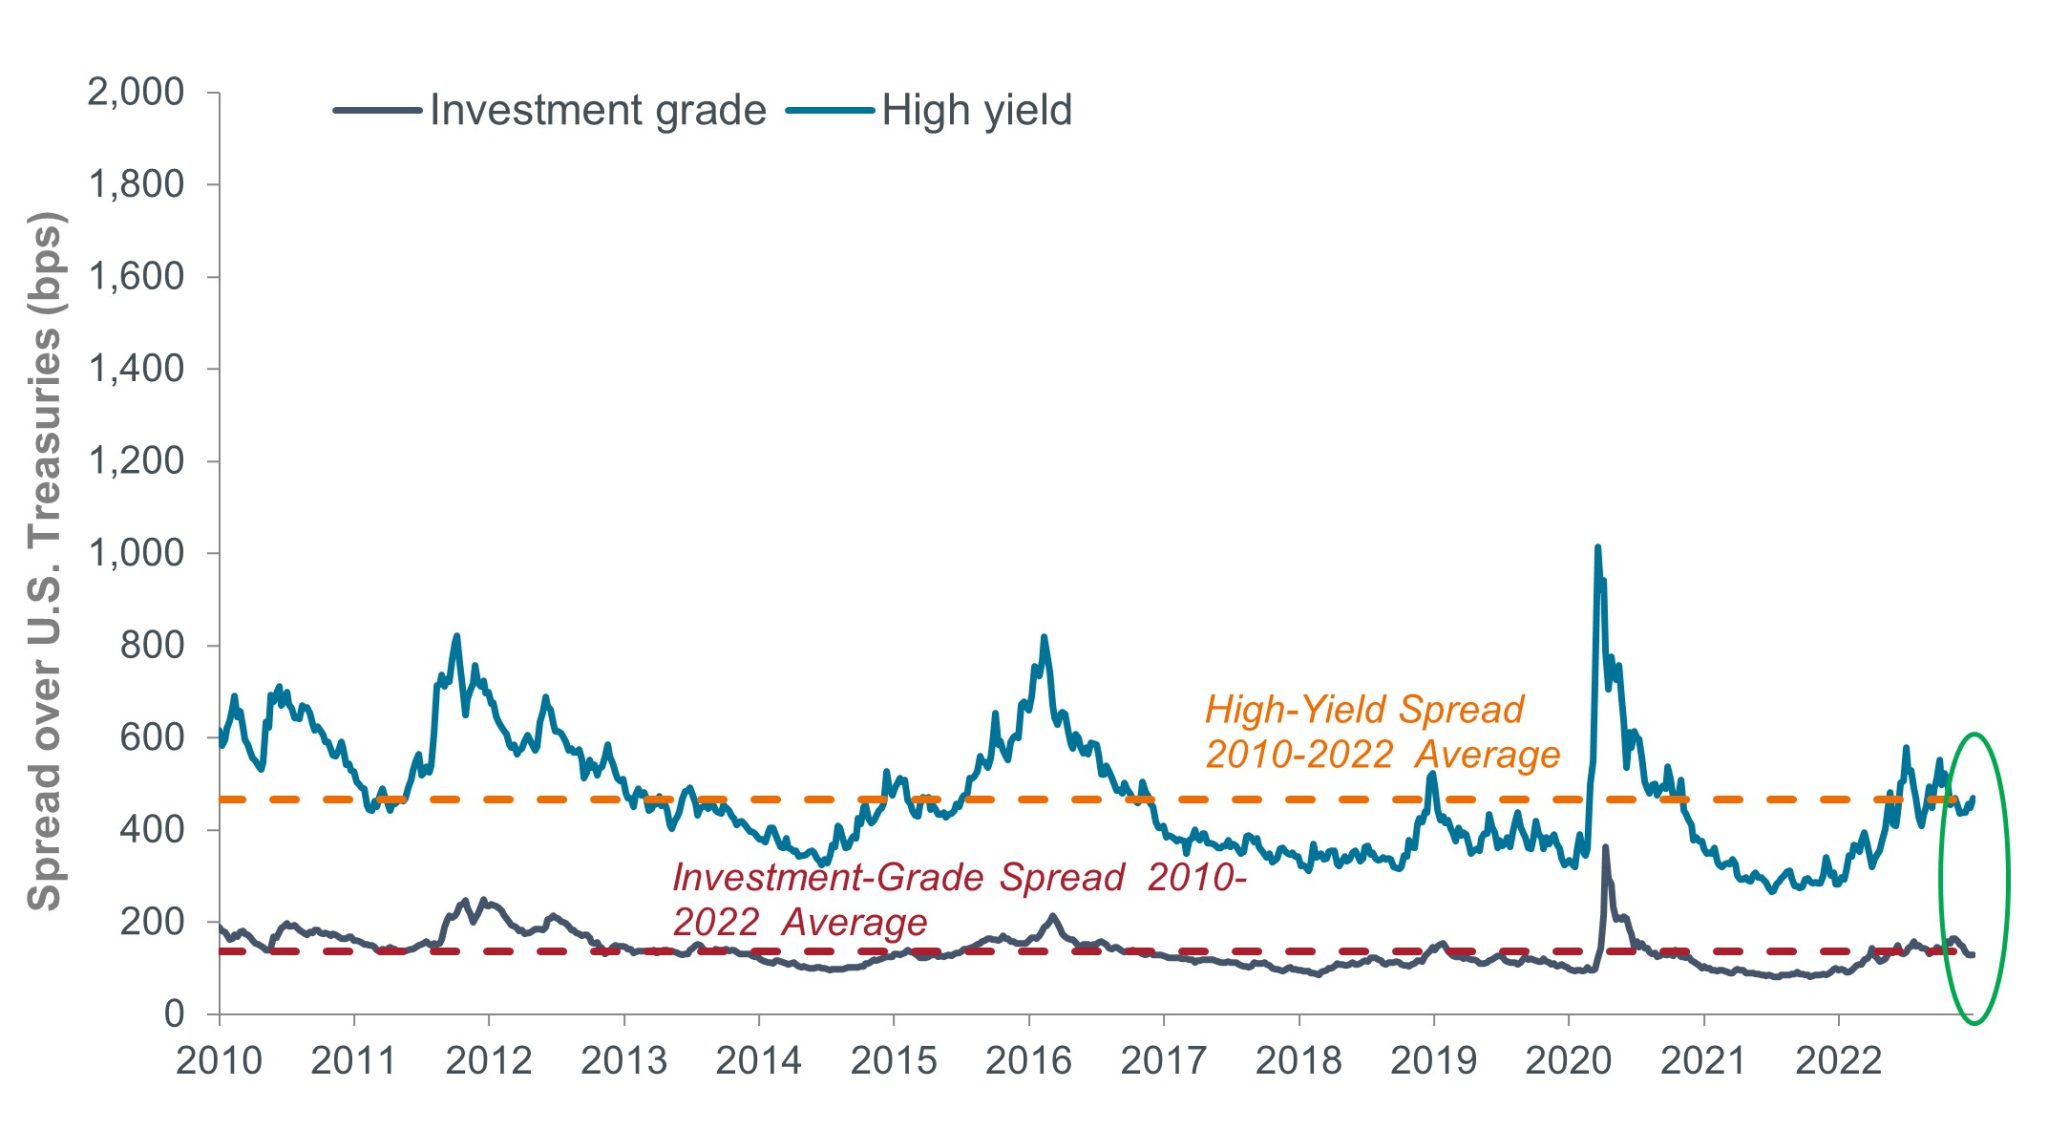 Source: Bloomberg, as of 31 January 2023.
Prior to the initiation of the tightening cycle, investors had grown accustomed to asset prices detaching from underlying economic and corporate fundamentals. One culprit was central banks’ support of markets with the aim of spurring economic growth. Those days are over; prices are now at risk of falling until they reach levels justified by reality. At present, we find it difficult to reconcile the host of bearish indicators with the current market rally.
Even though we see risks to the downside, we believe last year’s upward move in rates has resulted in investors being better equipped to weather market downturns. A higher cost of capital should, in our view, lead to capital flowing to companies that can generate returns well above this higher threshold. With consensus coalescing around a slowing economy, we believe quality companies will likely hold up better than the broader market. We define quality as those companies capable of delivering stable earnings throughout the economic cycle that have been prudent in their deployment of leverage.
Conversely, as the importance of macro drivers diminishes, a higher cost of capital will likely expose companies that survived on cheap financing throughout the era of extraordinarily accommodative monetary policy, as well as the propensity of yield-starved investors to overlook inconsistent – or even unsustainable – financial performance.
Basis point (bp) equals 1/100 of a percentage point. 1 bp = 0.01%, 100 bps = 1%.
Correlation measures the degree to which two variables move in relation to each other. A value of 1.0 implies movement in parallel, -1.0 implies movement in opposite directions, and 0.0 implies no relationship.
Dividend Yield is the weighted average dividend yield of the securities in the portfolio (including cash). The number is not intended to demonstrate income earned or distributions made by the portfolio.
A yield curve plots the yields (interest rate) of bonds with equal credit quality but differing maturity dates. Typically bonds with longer maturities have higher yields.
MSCI World Index℠ reflects the equity market performance of global developed markets.
MSCI Emerging Markets Index℠ reflects the equity market performance of emerging markets.
National Association of Securities Dealers Automated Quotation System (NASDAQ) is a nationwide computerized quotation system for over 5,500 over-the-counter stocks. The index is compiled of more than 4,800 stocks that are traded via this system.
Russell 1000® Index reflects the performance of U.S. large-cap equities.
Russell 1000® Growth Index reflects the performance of U.S. large-cap equities with higher price-to-book ratios and higher forecasted growth values.
Russell 1000® Value Index reflects the performance of U.S. large-cap equities with lower price-to-book ratios and lower expected growth values.
Price-to-Earnings (P/E) Ratio measures share price compared to earnings per share for a stock or stocks in a portfolio.
Quantitative Tightening (QT) is a government monetary policy occasionally used to decrease the money supply by either selling government securities or letting them mature and removing them from its cash balances.
S&P 500® Index reflects U.S. large-cap equity performance and represents broad U.S. equity market performance.
STOXX® Europe 600 Index represents large, mid and small caplitalization companies across 17 countries in the European region.
U.S. Treasury securities are direct debt obligations issued by the U.S. Government. With government bonds, the investor is a creditor of the government. Treasury Bills and U.S. Government Bonds are guaranteed by the full faith and credit of the United States government, are generally considered to be free of credit risk and typically carry lower yields than other securities.

Sign up for timely perspectives delivered to your inbox.