Subscribe
Sign up for timely perspectives delivered to your inbox.
Hard or soft landing? Pivot or pause? While prospects for the global economy remain in the balance, David Milward, Head of Loans, considers a more predictable element for fixed income investors.


Given 2022 was a poor year for fixed income, investors may be re-evaluating credit given the attractive yields on offer today versus history. Higher yields reflect both aggressive tightening by central banks and wider spreads. Such asset allocation decisions are being influenced by conviction towards a hard or soft landing for the global economy – with markets pricing in the optimistic scenario. It’s too early to make a call on this, in our view, and uncertainty lies ahead on growth, inflation and policy. The driver of returns in 2023 thus could be cash interest payments and investors should be cognisant of this arguably more predictable component.
While bond yields have risen, the underlying income (as measured by average coupon) generated in European high yield is at a post global financial crisis (GFC) low given the low yield environment seen for most of the last 15 years (Figure 1). By contrast, European secured loans, as floating rate assets, now generate coupons close to post GFC highs as rising short-term rates lift the cash coupons paid by borrowers.
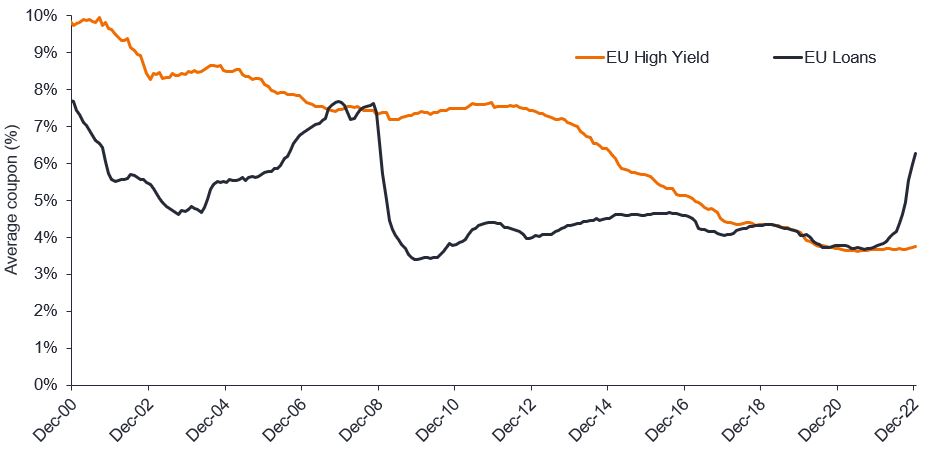
Source: Bloomberg, ICE BAML, Credit Suisse, as at 31 December 2022. ICE BofA Euro High Yield; Credit Suisse Western European Leveraged Loan Index (CS WELLI).
Cash yields in the European loan market now exceed 6% and are expected to increase further as expected central bank tightening is fully reflected in short-term cash rates (Figure 2). With European rates forecasted to rise by around 100bps this year, such income generated for a loan portfolio provides a significant cushion to returns if spreads widen from here.
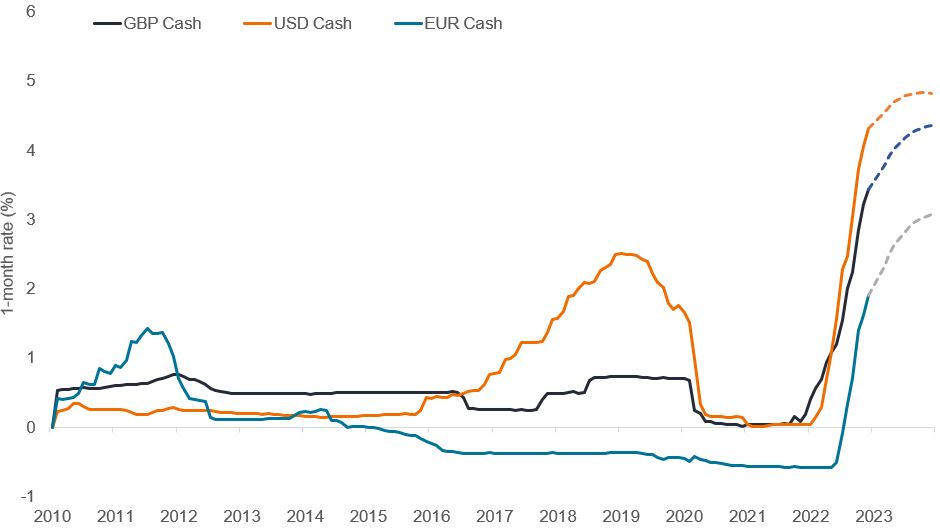
Source: Janus Henderson Investors, Bloomberg, ICE BAML.
Notes: Data is based on 1-month Libor up to 31 December 2020, then SONIA, ESTR, SOFR 1-month rates to 31 December 2022. Forward rates based on overnight index swap (OIS) curves as at 18 January 2023.
There is no guarantee that past trends will continue, or forecasts will be realised.
Investor concerns around rising defaults are understandable, but we’re not anticipating a material spike in defaults this year. Moody’s forecast sub-investment grade defaults to rise to 4% this year1 in Europe – which is in line with recent averages. While this is a notable increase, it’s certainly not a major negative for the market. It will be important to avoid companies with over-levered balance sheets and limited pricing power in this environment. It is also worth noting that both US and European loans have higher recovery rates2 than their equivalent high yield markets.
| US high yield | US loans | Western European high yield | Western European loans | |
|---|---|---|---|---|
| Trailling 12-month par default rate | 1.3% | 1.1% | 0.1% | 1.9% |
| Trailing 12-month recovery rate | 54.7% | 61.2% | 38.5% | 61.8% |
| Trailing 12-month default loss rate | 0.6% | 0.4% | 0.06% | 0.73% |
Source: Credit Suisse, 30 November 2022.
Spreads are offering adequate compensation for rising default risk, as reflected in current loan discount margins (DMs) – a type of yield-spread calculation designed to estimate the average expected return of a variable-rate security. For example, the 3-year DM of 6.61%3 for European loans offers a significant cushion against potentially rising defaults.
Moreover, defaults should be concentrated in the lower-rated cohorts of the loan and high yield markets. For loans specifically, a rise in downgrades to CCC among the lower-rated borrowers has raised concerns that collateralised loan obligations (CLOs) – a significant participant in the loan markets – may create price volatility if they sell these assets to meet over-collateralisation4 (OC) tests. However, CLO managers are not automatic forced sellers of these assets. Nevertheless, we’re mindful of any potential impact of downgrades within the asset class and, in our view, this means limiting exposure to low single B names.
Some strategists have high yield outperforming loans this year given it has a better average rating, as lower-rated credit is expected to underperform in a slowdown. When dissecting loan market composition by rating, however, the European and US loan markets have a much lower exposure to CCC-rated debt compared to high yield equivalents (Figure 3).
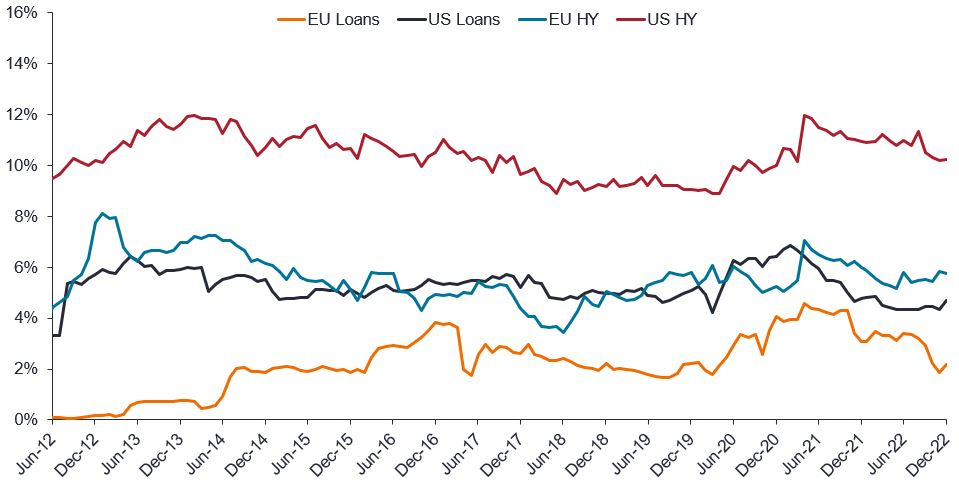
Source: Janus Henderson Investors, Credit Suisse, as at 31 December 2022. ICE BofA Euro High Yield; ICE BofA US High Yield Index; Credit Suisse Western European Leveraged Loan Index (CS WELLI); Credit Suisse US Leveraged Loan Index. HY = high yield
Note: Index data is for illustrative purposes only and not indicative of any actual investment.
Another concern is that cyclical sectors are also more vulnerable in an economic downturn. Reassuringly, loans have less ‘cyclical’ exposure versus HY, particularly in Europe with 35% exposure versus 62% in HY5. Generally, loans should therefore see less weakness in revenues if we enter a prolonged downturn.
While rising cash interest costs are positive for loan investors, the flip side is that this also means a deterioration in interest cover. It has been estimated that European loans’ interest coverage at the start of 2022 was 4.2x, but with rising short-term rates this is expected to dip below 3x over the next six to 12 months6. Most borrowers (but not all) have some form of interest rate hedging and so are cushioned from some of this. We also see this challenge being more problematic for US loans where the magnitude of the move in cash rates has been greater and hedging of interest costs appears to be less prevalent.
Whether a hard or soft landing is achieved, we believe companies will continue to see rising input costs pressure margins, which impacts cashflows also buffeted by rising debt service costs. Credit spreads tightened in the fourth quarter, but loan DMs continue to look attractive versus history and against other fixed income asset classes. As one example, loans are trading wider than their equivalently rated high yield index, as shown in Figure 4. Using 3-year DMs, BB-rated loans are trading at the 66% percentile, while B-rated loans are at 80%7. The cushion offered by the current yield in European loans (close to 7%, compared to a cash yield of 4.2% in European high yield8) is key to absorbing price volatility.
BB-rated discount margins/ spreads
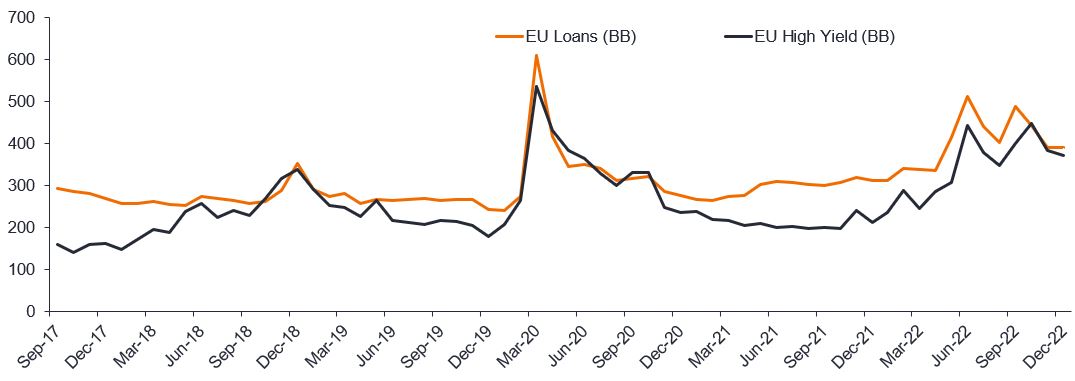
B-rated discount margins/ spreads
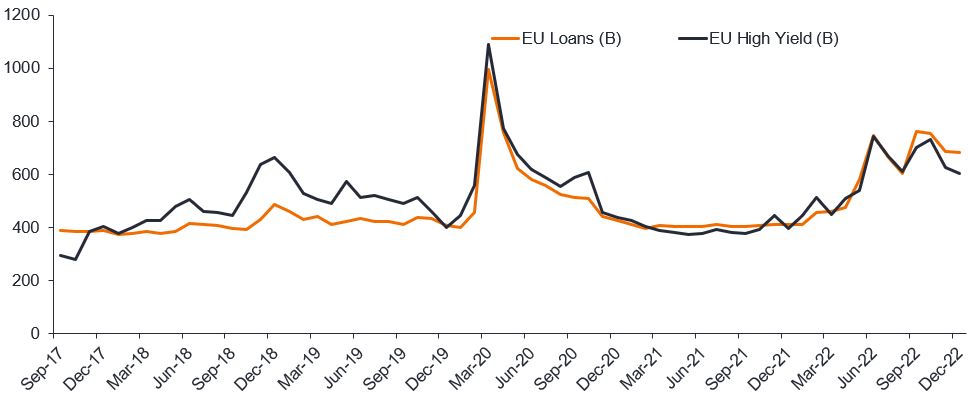
Source: BofA, Credit Suisse, Janus Henderson Investors Analysis, as at 31 December 2022.
Note: Indices are the Credit Suisse loans indices, 3-year DM and BofA Merrill Lynch single B High Yield indices option-adjusted spreads (OAS).
Clearly spreads in loans and high yield are not factoring in a deep recession in Europe, but that is not our – nor the market’s – base case for 2023. We’re likely to see some price volatility in the first half of this year given the near-term growth outlook, but provided that the downturn isn’t too severe or extended, spreads could end the year broadly in line with or perhaps slightly wider than opening levels. In such a scenario, we expect loans to generate a +6% total return purely based on the cash income being generated. Given the uncertainty facing the global economy, perhaps it is a year to focus on income?
1 As at 15 December 2022.
2 Recovery rate is the extent to which principal and accrued interest on defaulted debt can be recovered, expressed as a percentage of face value. HY = high yield.
3 A measure of the cushion available to absorb any defaults within the portfolio of loans for each tranche of CLO debt. The structures typically allow a portfolio to hold up to 7.5% CCC-rated assets with no consequence (ie. the loans continue to be valued at par for OC purposes). If this limit is breached, then the excess must be priced at market value for the OC tests.
4 Source: Credit Suisse, Janus Henderson Investors Analysis, as at 31 December 2022.
5 Source: Credit Suisse, CS WELLI Index and ICE BofA Euro High Yield EU members & Western Europe Issuers Index.
6 Source: UBS, 19 October 2022.
7 Source: Credit Suisse, CS WELLI Index, percentiles calculated between 30 January 1998 to 31 December 2022.
8 Source: Bloomberg, Credit Suisse, CS WELLI Index and ICE BofA Euro High Yield index.
Sign up for timely perspectives delivered to your inbox.