
Subscribe
Sign up for timely perspectives delivered to your inbox.
In this 2023 outlook, John Kerschner assesses various fixed income sectors on their 2022 performance and discusses what we can expect from them in 2023.


After six weeks of excitement, drama, and controversy, the 2022 FIFA World Cup has drawn to a close and teams, press, and spectators are headed home from Qatar. It is now time for soccer/football pundits to write the postmortems and rate players’ performances during the tournament – who excelled, who flopped, and who can we expect to shine when the World Cup arrives in North America in 2026? Along a similar theme, in this investment outlook we assess each of the U.S. fixed income “players,” or sectors, on their investment performance in 2022 and consider their prospects for 2023.
Figure 1 shows year-to-date performance for each of seven fixed income sectors through 9 December 2022, while Figure 2 shows current spread as a percentage of 10-year average spread.
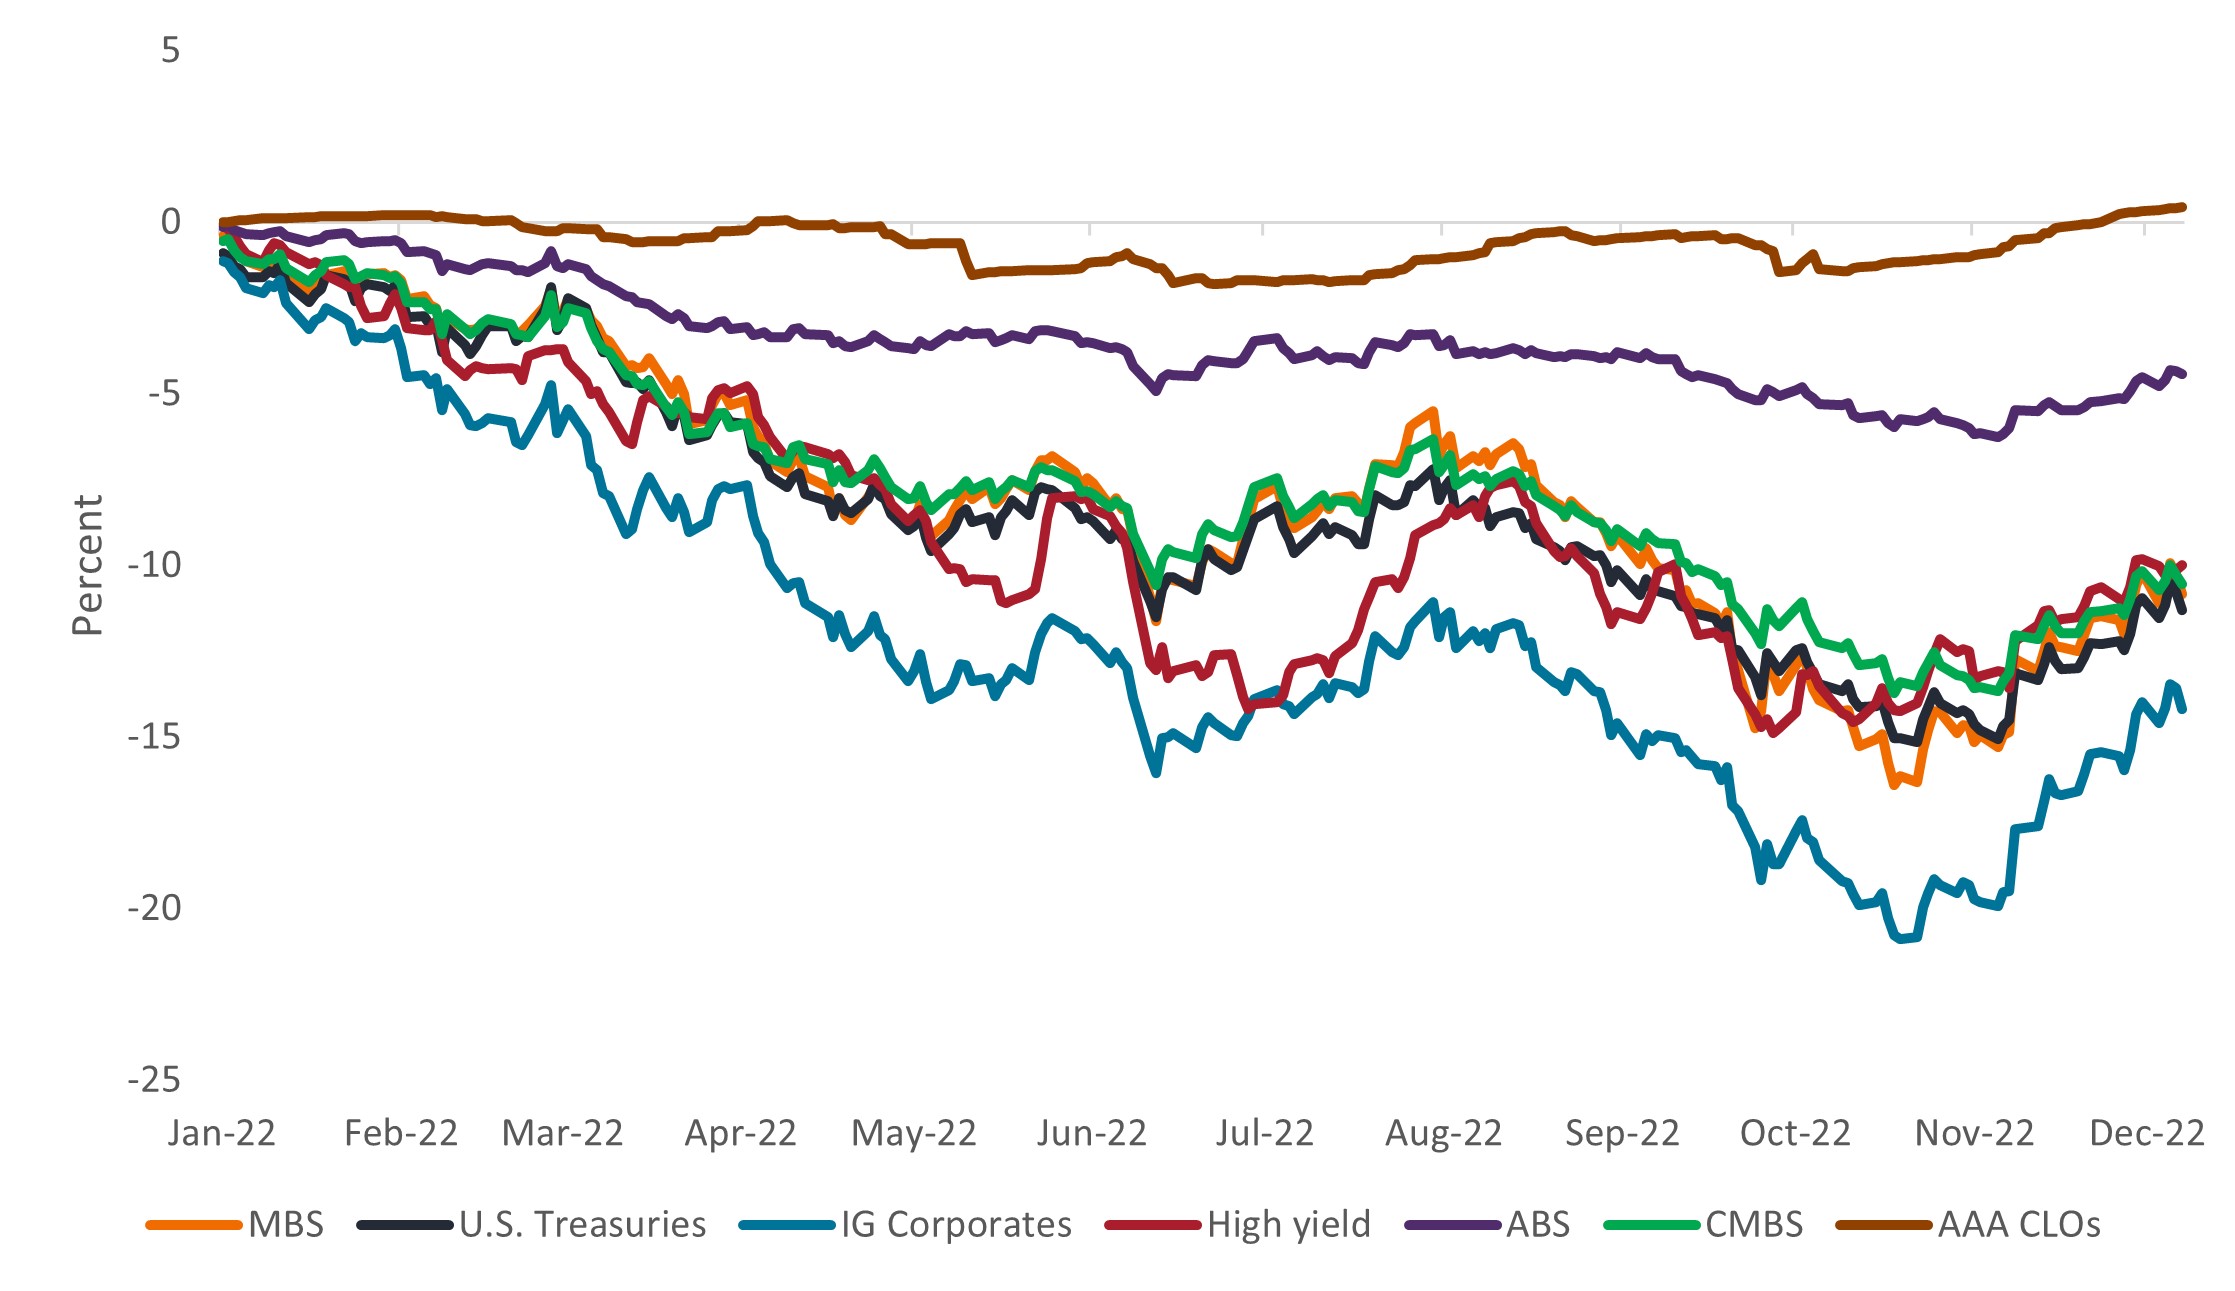
Source: Bloomberg, J.P. Morgan, as of 9 December 2022. Indices used to represent asset classes: MBS (Bloomberg U.S. Mortgage-Backed Securities Index), U.S. Treasuries (Bloomberg U.S. Treasury Index), IG Corporates (Bloomberg U.S. Investment Grade Corporate Bond Index), High yield (Bloomberg U.S. Corporate High Yield Bond Index), ABS (Bloomberg U.S. Aggregate Asset-Backed Securities Index), CMBS (Bloomberg U.S. Investment Grade Commercial Mortgage-Backed Securities Index), AAA CLOs (J.P. Morgan CLO AAA Index).
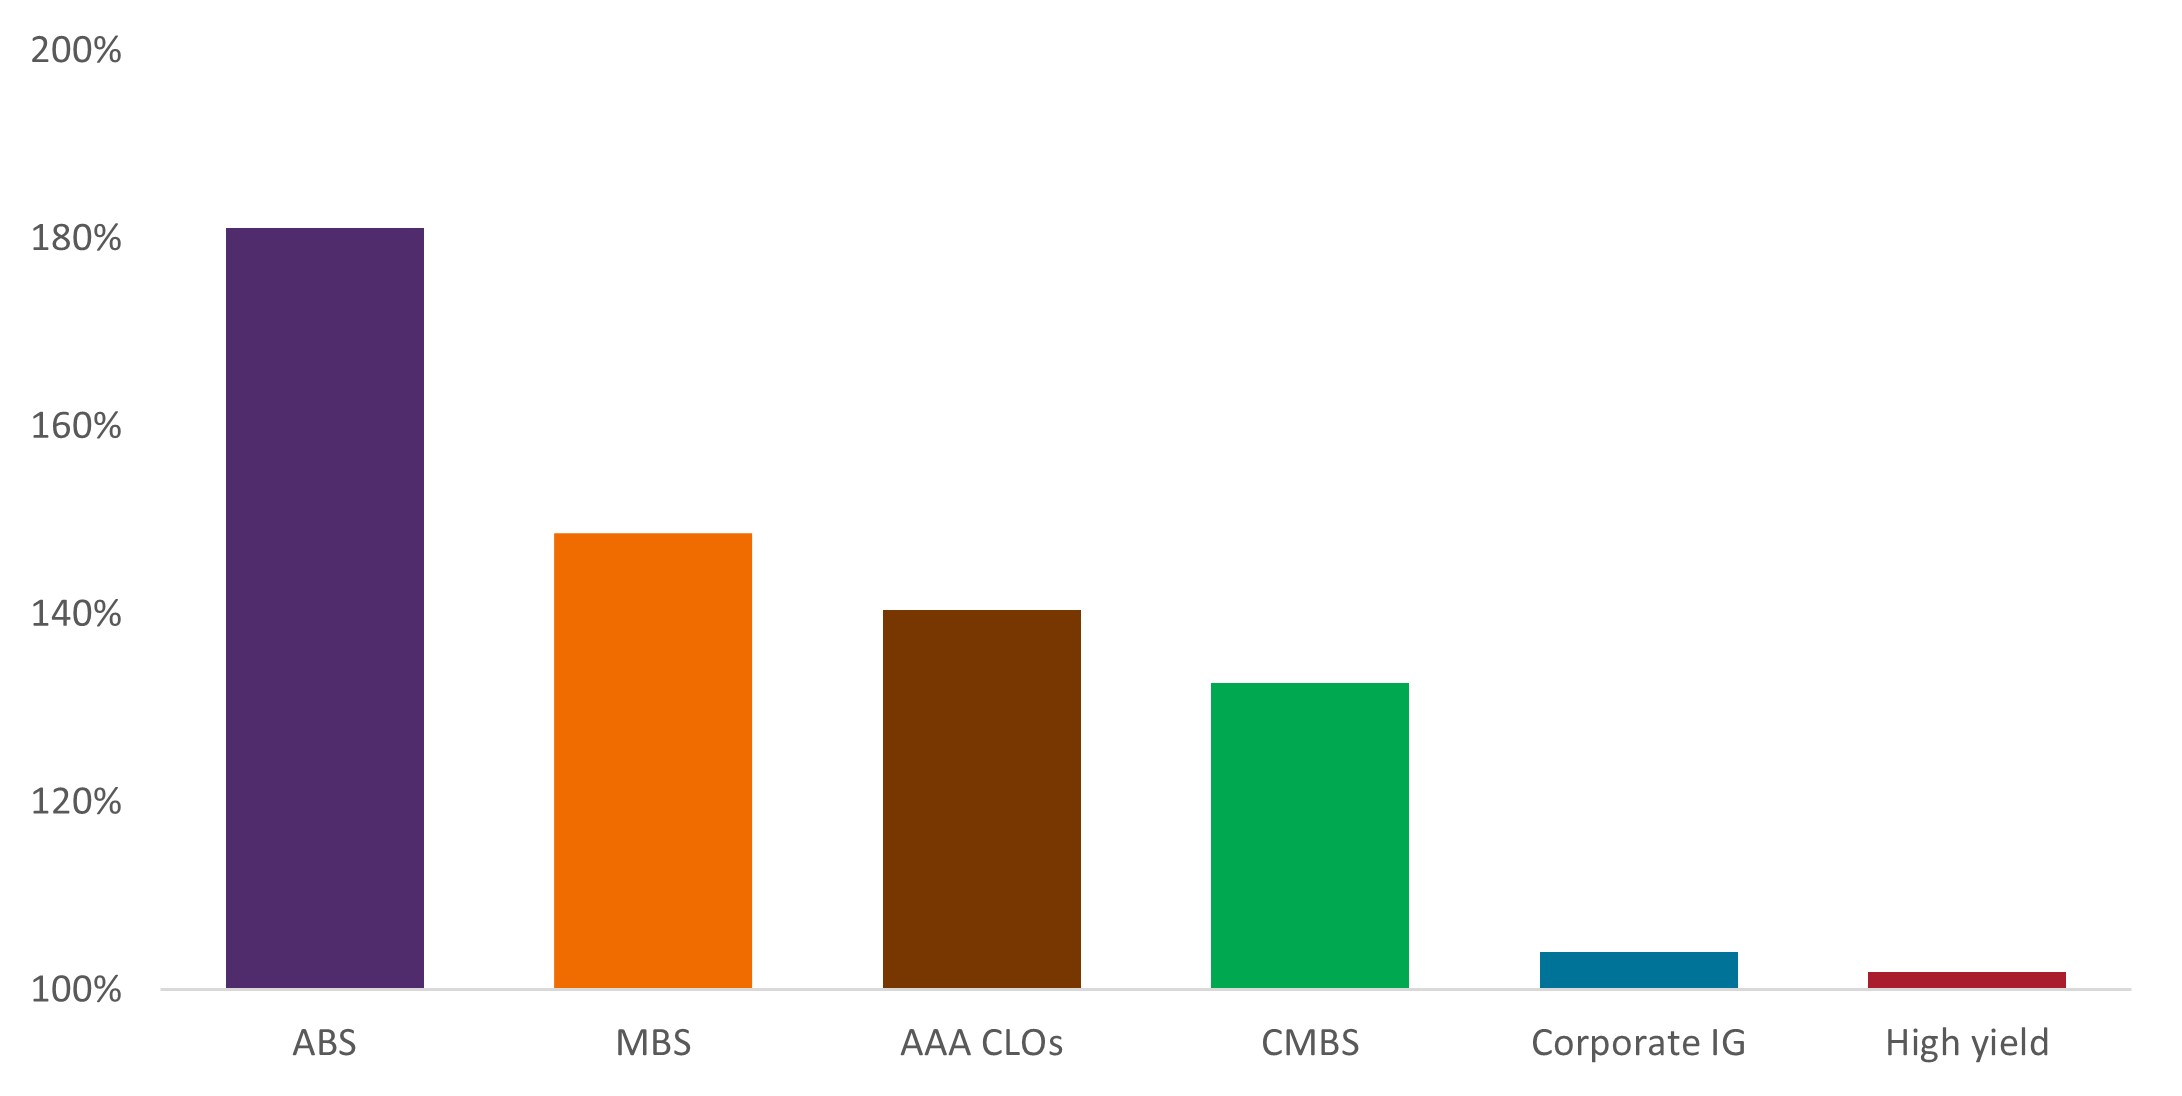
Source: Bloomberg, J.P. Morgan, as of 9 December 2022. Indices used to represent asset classes as per Figure 1.
It may come as a surprise to some, but corporate IG has been the worst-performing fixed income sector in 2022, with a year-to-date return of -14.2%.2 In a year that saw rates rise sharply, the sector’s 7.7 years of duration counted against it. While investors might consider an overweight to IG corporates in 2023 on account of it being beaten down, we would suggest caution. Corporate credit spreads widened somewhat in 2022, but they are still only trading slightly above their 10-year averages, as shown in Figure 2. There are concerns that an economic slowdown is on the horizon; if the U.S. enters a recession in 2023, credit spreads are likely to widen substantially from current levels – in our view, at least 50-75 basis points. In such a scenario, long-term rates are likely to fall. This would help to offset some spread widening, but not enough to compensate for the anticipated widening of spreads, in our view.
MBS weathered many storms in 2022 (arguably more than any other sector), returning -10.8% year to date. Rising interest rates, extremely high interest-rate volatility (which impacts MBS more than other fixed income sectors), and fears that the Federal Reserve (Fed) would flood the market with its MBS holdings as it started quantitative easing, all pressured returns. In October, MBS spreads blew out to 88 basis points and the sector’s 12-month excess return over U.S. Treasuries fell below -4.0%. (The only other time this measure has fallen below -4.0% was in 2008 during the Global Financial Crisis.)
Since October, MBS spreads have recovered some losses and excess returns are back in the -2.0% range. Still, we would expect a further reversal of the negative excess return over time. Additionally, as the Fed nears the end of its hiking cycle, rates and rate volatility are likely to come down, providing opportunities for MBS to deliver strong risk-adjusted returns in 2023.
While U.S. Treasuries struggled overall, returning -11.3% year to date, the aggregate return doesn’t tell the full story. Investors’ position on the duration curve would have impacted their experience greatly in 2022. Despite rates on the short end of the Treasury curve rising much more than rates on long end,3 investors witnessed the powerful effects of duration, or interest rate risk, on bonds. Long-term drawdowns far exceeded short-term drawdowns, with the ICE BofA 7-10 Year Treasury Index returning -13.7% year to date, versus -3.8% for the ICE BofA 1-3 Year Treasury Index.
We believe the interplay between inflation and slowing economic growth will impact relative performance for Treasuries in 2023. If inflation comes down quicker than expected, this will likely be good for Treasuries. Further, if a recession unfolds, long-term Treasuries are likely to outperform as safe-haven buying pushes rates down.
Considering the CMBS index has a AAA average credit rating and duration under five years, the sector perhaps underdelivered in 2022, with a year-to-date return of -10.5%. Concerns around the impact of higher mortgage rates on the real estate market, as well as an anticipated slowdown in commercial activities, weighed on performance. That said, spreads are trading in the 133% range of their 10-year averages, implying that the sector is relatively cheap. In addition, this is a space with highly divergent sub-sectors, some of which are better positioned than others. We maintain a positive outlook on multi-family, industrial, and high-end hospitality, but less so on office space and retail. We think the low level of homogeneity among subsectors in CMBS should provide opportunities for active managers in 2023.
While absolute performance was in line with other sectors, high yield impressed on a relative basis, outperforming corporate IG and the S&P® 500 Index by 4.2% and 6.2%, respectively, year to date. High yield benefited from its relatively low average duration of 4.1 years and was therefore less impacted by rate increases. Additionally, supply constraints supported prices, as only $99 billion of new bonds were issued in 2022, the lowest dollar value since 2008 ($49 billion). Fundamentals also held up well, with delinquency rates averaging less than 2% for the year.
Unfortunately, what served high yield well in 2022 might work against it in 2023. High-yield spreads are trading at their long-term averages and therefore look expensive relative to other sectors. Further, debt issuance and delinquencies are both likely to be higher in 2023, which would place upward pressure on spreads.
ABS performed admirably in 2022, outperforming most other sectors with its -4.4% return year to date. It benefitted from its characteristic low duration (2.3 years average in 2022), which shielded bond prices from rising rates. More impressive, however, was the fact that the sector achieved relative outperformance despite spreads widening to around 180% of their 10-year average. As a result, we believe ABS is one of the best value fixed income sectors going into 2023, as it is already priced for a deep recession while many other sectors are not. We especially like short-duration, seasoned, and de-levered ABS, particularly auto and marketplace lending. While the sector’s low duration means it won’t benefit to a large extent if rates fall in 2023, we think it has a lower degree of downside risk than other sectors due to its low duration and wide spread levels.
The AAA CLO sector was the standout performer in 2022, nudging out a slight positive gain of 0.4% against otherwise deeply negative returns from other sectors. 2022 was the year to be ultra-low duration, and floating-rate CLOs took advantage of the environment that suits them best. With each increase in rates, coupons on floating-rate CLOs continued to reset higher, translating into higher income for investors.
Looking ahead to 2023, if investors believe the Fed will keep rates higher for longer as it has said it will, then AAA CLOs should continue to offer income from a high-quality asset with virtually no interest rate risk. One risk to the sector is a spike in leveraged loan defaults, which could result in some spread widening and credit impairment, particularly in lower-rated bonds. We therefore prefer the AAA tranche of CLOs. In addition, CLO spreads stand to benefit from some tightening, as they are trading at 140% of their 10-year average.
Fixed income performed in line with the U.S. men’s national team at the World Cup – some highs, some lows, but mostly underwhelming. However, just as U.S. soccer fans look forward to more success playing on home soil in 2026, we believe fixed income investors have more to look forward to in 2023. We expect the Fed to be done raising rates, rate volatility to decrease, technical factors to turn positive, and spreads on securitized sectors to hold up or tighten in the new year –all positive factors for bonds going forward, in our view. While 2022 was dominated by interest rate risk and macro factors, we believe quality, fundamentals, and valuations are likely to be the key drivers of returns in 2023.
1 All references to fixed income sectors are based on indices used to represent asset classes as per Figure 1.
2 All year to date returns and quoted spreads are as of 9 December 2022, unless otherwise noted.
3 Year to date through 9 December 2022, U.S. Treasury rates in the 1-month to 2-year tenor range rose between 3.6% and 4.5%, while the 10-year tenor rose a comparatively smaller 2.1%.
Basis point (bp) equals 1/100 of a percentage point. 1 bp = 0.01%, 100 bps = 1%.
Correlation measures the degree to which two variables move in relation to each other. A value of 1.0 implies movement in parallel, -1.0 implies movement in opposite directions, and 0.0 implies no relationship.
Credit Spread is the difference in yield between securities with similar maturity but different credit quality. Widening spreads generally indicate deteriorating creditworthiness of corporate borrowers, and narrowing indicate improving.
Credit quality ratings are measured on a scale that generally ranges from AAA (highest) to D (lowest).
Duration measures a bond price’s sensitivity to changes in interest rates. The longer a bond’s duration, the higher its sensitivity to changes in interest rates and vice versa.
Bloomberg U.S. Mortgage Backed Securities (MBS) Index measures the performance of U.S. fixed-rate agency mortgage backed pass-through securities.
Bloomberg U.S. Treasury Index measures US dollar-denominated, fixed-rate, nominal debt issued by the US Treasury. Treasury bills are excluded
Bloomberg U.S. Investment Grade Corporate Bond Index is a rules-based market-value-weighted index engineered to measure the investment-grade, fixed rate, global corporate bond market.
Bloomberg U.S. Corporate High Yield Bond Index measures the US dollar-denominated, high yield, fixed-rate corporate bond market
Bloomberg U.S. Aggregate Asset-Backed Securities Index measures the performance of U.S. investment-grade asset-backed securities
Bloomberg U.S. Investment Grade Commercial Mortgage-Backed Securities Index measures the investment-grade market of US Agency and US Non-Agency conduit and fusion CMBS deals with a minimum current deal size of $300mn. The index includes both US Aggregate eligible (ERISA eligible) and non-US Aggregate eligible (non-ERISA eligible) securities.
ICE BofA 1-3 year Treasury Index is an unmanaged index that tracks the performance of the direct sovereign debt of the U.S. Government having a maturity of at least one year and less than three years.
ICE BofA 7-10 year Treasury Index is an unmanaged index that tracks the performance of the direct sovereign debt of the U.S. Government having a maturity of at least seven years and less than ten years.
J.P. Morgan CLO AAA Index is designed to track the AAA-rated components of the USD-denominated, broadly syndicated CLO market.
S&P 500® Index reflects U.S. large-cap equity performance and represents broad U.S. equity market performance.
Quantitative Easing (QE) is a government monetary policy occasionally used to increase the money supply by buying government securities or other securities from the market.
Quantitative Tightening (QT) is a government monetary policy occasionally used to decrease the money supply by either selling government securities or letting them mature and removing them from its cash balances.
Volatility measures risk using the dispersion of returns for a given investment.
IMPORTANT INFORMATION
Actively managed portfolios may fail to produce the intended results. No investment strategy can ensure a profit or eliminate the risk of loss.
Collateralized Loan Obligations (CLOs) are debt securities issued in different tranches, with varying degrees of risk, and backed by an underlying portfolio consisting primarily of below investment grade corporate loans. The return of principal is not guaranteed, and prices may decline if payments are not made timely or credit strength weakens. CLOs are subject to liquidity risk, interest rate risk, credit risk, call risk and the risk of default of the underlying assets.
Fixed income securities are subject to interest rate, inflation, credit and default risk. The bond market is volatile. As interest rates rise, bond prices usually fall, and vice versa. The return of principal is not guaranteed, and prices may decline if an issuer fails to make timely payments or its credit strength weakens.
High-yield or “junk” bonds involve a greater risk of default and price volatility and can experience sudden and sharp price swings.
Mortgage-backed securities (MBS) may be more sensitive to interest rate changes. They are subject to extension risk, where borrowers extend the duration of their mortgages as interest rates rise, and prepayment risk, where borrowers pay off their mortgages earlier as interest rates fall. These risks may reduce returns.
Securitized products, such as mortgage- and asset-backed securities, are more sensitive to interest rate changes, have extension and prepayment risk, and are subject to more credit, valuation and liquidity risk than other fixed-income securities.
U.S. Treasury securities are direct debt obligations issued by the U.S. Government. With government bonds, the investor is a creditor of the government. Treasury Bills and U.S. Government Bonds are guaranteed by the full faith and credit of the United States government, are generally considered to be free of credit risk and typically carry lower yields than other securities.
Sign up for timely perspectives delivered to your inbox.