
Subscribe
Sign up for timely perspectives delivered to your inbox.
As we move closer to the end of the US hiking cycle, the outlook for emerging markets (EMs) looks brighter in 2023. The Emerging Markets Debt (EMD) Hard Currency (HC) team explore whether EMD HC could become the silver lining amid the global slowdown.


The fortunes for EMs next year are largely dependent on the path of inflation, US Federal Reserve (Fed) hawkishness and the depth of the global slowdown. As risk appetite is a key driver of capital flows and thus EMD HC performance, this really matters for investors and is largely defined by the global environment. As US CPI appeared to have peaked in October, this saw a widespread rally across risk assets as optimism was revived – perhaps too much so – for a long-awaited pivot. Overly gloomy markets reversed as global risk aversion halved in November, according to our proprietary JHI Risk Aversion Index (RAI). The EMD HC asset class therefore saw the strongest monthly return since the 1990s1 .
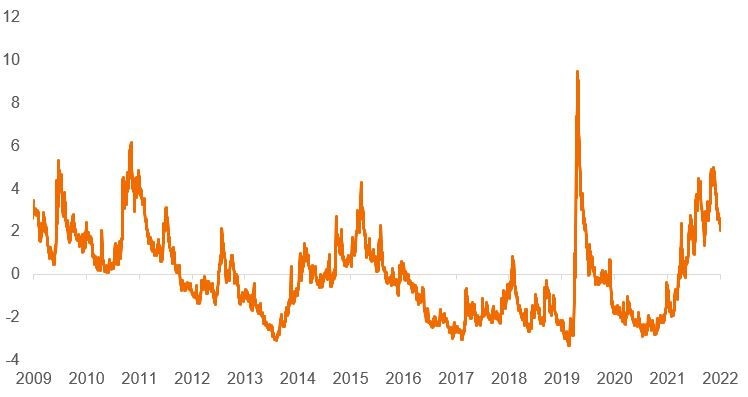
Source: Janus Henderson Investors, Macrobond, 30 November 2009 to 30 November 2022. First principal component of a broad set of asset prices, i.e. a commonly shared risk component that is not asset class specific which we interpret as a broader representation of market sentiment. A lower score indicates risk aversion has fallen across global assets.
Surpassing peak US inflation was pivotal for markets as it signalled that the end of the US hiking cycle could be on the horizon (in our view by the middle of next year). US Treasury yields tend to hit cycle highs when the Fed pauses hiking2 and so a peak in yields also comes with less risk of a strong dollar in 2023. Such strength has hampered EM performance – given economies’ exposure to dollar-denominated debt. This is because a stronger dollar has predominantly been accompanied by wider EMD HC spreads. A more constructive environment for the asset class could therefore materialise next year, as risk appetite tends to lift once the hiking is over and uncertainty subsides. The interplay between inflation and economic growth will be key to how investors perceive EM – and ergo valuations – and whether the Fed manages to orchestrate the soft landing it hopes for.
As the storm clouds amass for the global slowdown in 2023, investors will likely be considering where to seek shelter. According to the IMF/WEO projections, the EM-US growth differential is set to grow in 2023 and 2024 as EM emerges as relatively unscathed in the broader global slowdown (Figure 2). Structural drivers for EM growth – such as technology and demographics – are more favourable relative to developed markets (DMs). The latter also face the more difficult retracement from years of very loose monetary and fiscal policies. In contrast, EM economies did not have the same firepower to spend while they are also generally ahead in their tightening cycles. This suggests EMs may have monetary policy buffers to draw on in a slowing global economy. The rising EM-US rate differential could be a positive tailwind for tighter EMD spreads as it makes EM relatively attractive from a fundamental perspective.
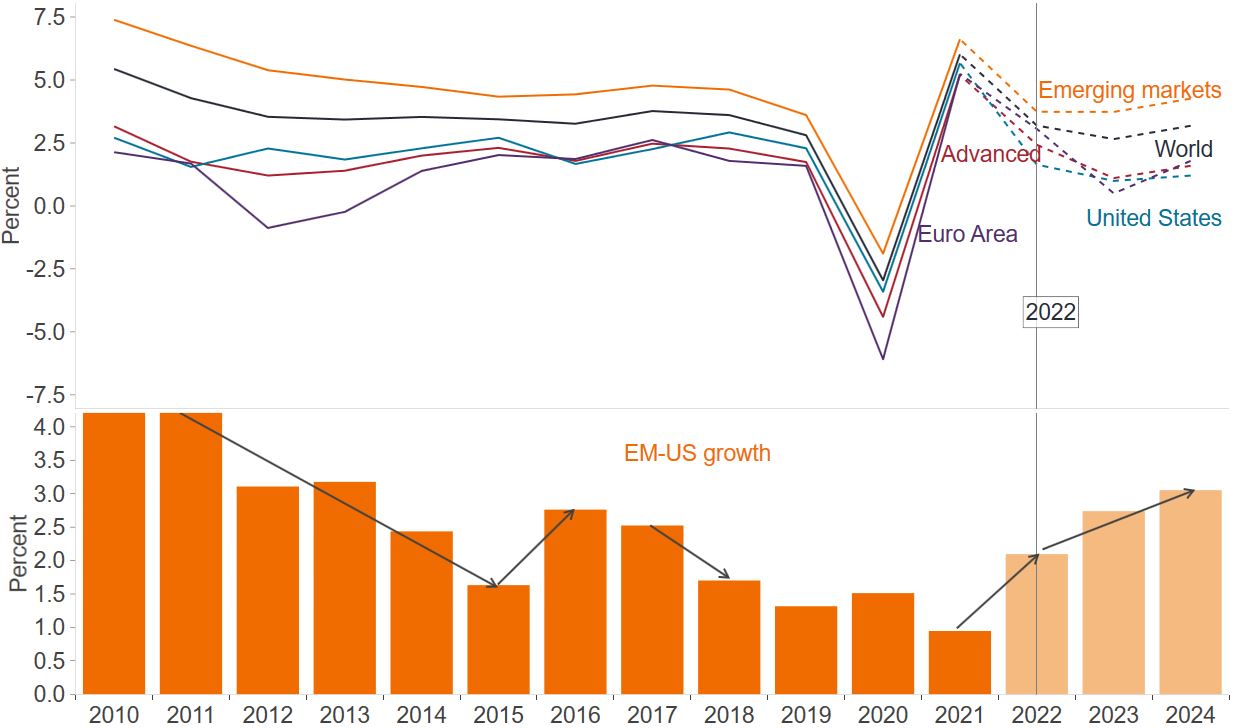
Source: International Monetary Fund (IMF) and World Economic Outlook (WEO) projections, October 2022, Macrobond. There is no guarantee that past trends will continue or forecasts will be realised.
US and EM real GDP has shown negative correlation in recent decades3. This decoupling of EM from the US could spell opportunity for investors looking to diversify their portfolios. Trade within EM has expanded, and China’s growth is a significant part of this story. China could be a stabiliser for EM amid increasing signs of loosening Covid restrictions and increased support to stabilise the ailing property sector. We expect China GDP to grow 4-5% next year, aided by low base effects. According to JP Morgan October forecasts, including China boosts the EM-DM differential in year-on-year 2023 GDP growth to 2.1% from 1%4. However, there is a risk a deeper slowdown than anticipated – in particular in the US and Europe – could emerge. Markets are pricing in a ‘soft’ economic landing for the global economy and therefore a deeper recession (or economic ‘hard’ landing) is a risk to EMD HC spreads.
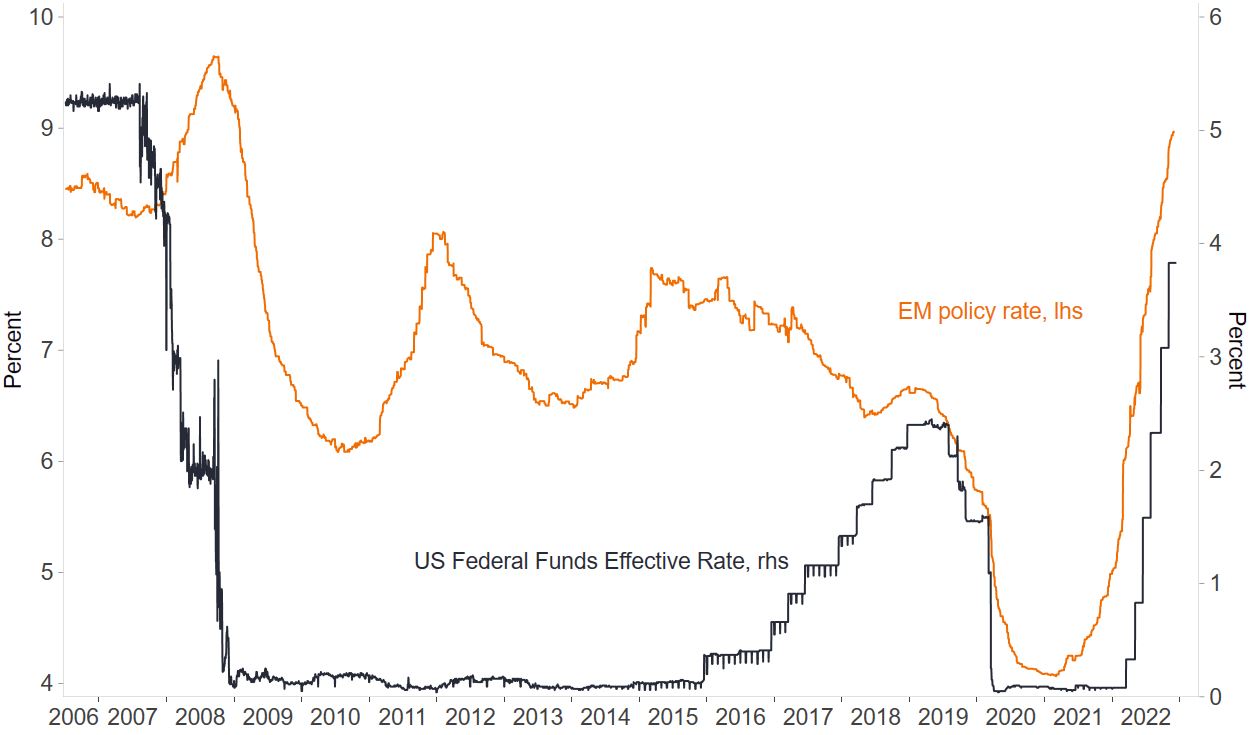
Source: Janus Henderson Investors, Macrobond, EM policy rate is based on 31 countries including the major EM economies such as Brazil, Russia, India and China, Indonesia and Saudi Arabia, 8 December 2022.
It is possible, therefore, that EM could lead global monetary policy easing as inflation subsides and so be first to stabilise or rebound in the second half of 2023. This will be positive for credit fundamentals, while in our view the growth slowdown will not be significant enough to impede credit quality. Relative growth dynamics are improving for EM which also typically leads to capital inflows.
So after a deluge of outflows in 2022, could sunshine be on the horizon as money returns to EM? With the retreat of less dedicated EM capital, a cleaner supply and demand picture has emerged. Debt issuance is expected to pick up once markets improve, but in 2023 more deeply negative net sovereign issuance (gross supply less cashflows) compared to 2022 is expected5. This indicates a tighter supply-demand picture that could be positive for spreads.
Ultimately, for investors it is the starting point that counts. The EMD HC asset class is priced at attractive spread levels, although it requires more granularity to fully appreciate the underlying dispersion. Distressed issuers are trading at deeply discounted valuations and so losses have already been booked in 2022 – even if the restructuring process of these distressed names lasts all of 2023. This creates a buffer against further bad news next year as the global slowdown bites.
Non-distressed high yield countries, however, are an interesting group to watch. An improving global market environment is likely to lead to regained market access to raise debt for some better-positioned economies – such as Mongolia, Kenya, Angola, Ivory Coast, Senegal, Benin and Jordan – which would reduce investment risk. Some of these countries in Africa, like Mozambique, Angola and Senegal, also benefit from strong European ambitions to diversify energy needs away from Russia and obtain a more diversified energy supply.
Disrupted supply chains have also encouraged near-shoring or friend-shoring and US-China tensions are shifting manufacturing away from China. This creates more opportunity for the EM universe, but also flags to investors the importance of diversification of trade exposure within portfolios. Opportunities abound in EM despite the storm clouds ahead. As yields have repriced higher, carry provides some cushion and should offer attractive total return prospects for next year.
1 Source: Bloomberg, monthly total returns according to the J.P. Morgan EMBI Global Diversified Index (EMBIGD), 30 November 2022.
2 Source: Goldman Sachs Investment Research, Haver Analytics, 28 November 2022.
3 Source: Tellimer research, IMF, WEO, correlation between annual US and EM real GDP growth from 2010 to 2019.
4 Source: JP Morgan forecasts, 22 November 2022. There is no guarantee that past trends will continue or forecasts will be realised.
5 Source: JP Morgan forecasts, as at 18 November 2022. There is no guarantee that past trends will continue or forecasts will be realised.
Fundamental analysis: The analysis of information that contributes to the valuation of a security, such as a company’s earnings or the evaluation of its management team, as well as wider economic factors. This contrasts with technical analysis, which is centred on idiosyncrasies within financial markets, such as detecting seasonal patterns.
Distressed debt: A security issued by a company that is either in default or in high risk of default and involves significant investment risk.
Credit spread: The difference in the yield of corporate bonds over equivalent government bonds.
Dispersion: Dispersion: This refers to the range of possible returns on an investment. It can also be used to measure the risk inherent in a particular security or investment portfolio.
Yield: The level of income on a security, typically expressed as a percentage rate. For equities, a common measure is the dividend yield, which divides recent dividend payments for each share by the share price. For a bond, this is calculated as the coupon payment divided by the current bond price.
Consumer price index (CPI): A measure that examines the price change of a basket of consumer goods and services over time. It is used to estimate ‘inflation’. Headline CPI or inflation is a calculation of total inflation in an economy, and includes items such as food and energy, in which prices tend to be more prone to change (volatile). Core CPI or inflation is a measure of long-run inflation and excludes transitory/volatile items such as food and energy.
Real GDP: Real GDP is a macroeconomic statistic that measures the value of the goods and services produced by an economy in a specific period, adjusted for inflation.
Gross domestic product (GDP): The value of all finished goods and services produced by a country, within a specific time period (usually quarterly or annually). It is usually expressed as a percentage comparison to a previous time period, and is a broad measure of a country’s overall economic activity.
Correlation: How far the price movements of two variables (eg, equity or fund returns) match each other in their direction. If variables have a correlation of +1, then they move in the same direction. If they have a correlation of -1, they move in opposite directions. A figure near zero suggests a weak or non-existent relationship between the two variables.
Diversification: A way of spreading risk by mixing different types of assets/asset classes in a portfolio. It is based on the assumption that the prices of the different assets will behave differently in a given scenario. Assets with low correlation should provide the most diversification. Diversification neither assures a profit nor eliminates the risk of experiencing investment losses.
Monetary policy: The policies of a central bank, aimed at influencing the level of inflation and growth in an economy. It includes controlling interest rates and the supply of money. Monetary stimulus refers to a central bank increasing the supply of money and lowering borrowing costs. Monetary tightening refers to central bank activity aimed at curbing inflation and slowing down growth in the economy by raising interest rates and reducing the supply of money. See also fiscal policy.
Debt issuance is an approach used by both the government and public companies to raise funds by selling bonds to external investors.
Near-shoring: The transfer of business processes to companies in a nearby country, where both parties expect to benefit from this.
Hawkish: Restrictive monetary policy that favours higher interest rates in order to curb inflation.
Risk assets: Financial securities that can have significant price movements (hence carry a greater degree of risk). Examples include equities, commodities, property and bonds.
Carry: The excess income earned from holding a higher yielding security relative to another.
IMPORTANT INFORMATION
Emerging market investments have historically been subject to significant gains and/or losses. As such, returns may be subject to volatility.
High-yield or “junk” bonds involve a greater risk of default and price volatility and can experience sudden and sharp price swings.
The J.P. Morgan Emerging Market Bond Index Global Diversified (EMBIGD) is a uniquely weighted USD-denominated emerging markets sovereign index. It tracks liquid, US dollar emerging market fixed and floating-rate debt instruments issued by sovereign and quasi sovereign entities.
Sign up for timely perspectives delivered to your inbox.