
Subscribe
Sign up for timely perspectives delivered to your inbox.
In their 2023 outlook, Portfolio Managers Seth Meyer and John Lloyd discuss the historical implication of an inverted yield curve for fixed income returns relative to equities.


In 1986, professor Campbell Harvey of Duke University published a dissertation in which he argued that there was a link between yield curve inversion1 and recessions. In the four recessions2 he studied, each instance was preceded by an inversion of the yield spread between the 10-year U.S. Treasury and the 3-month U.S. Treasury (i.e., the 10y-3m Treasury yield spread). Since publication of his dissertation, four more recessions3 have been experienced in the U.S. and each one of these was also presaged by an inversion of the 10y-3m Treasury yield spread.
For many investors, an inverted yield curve has become the key bellwether of an economic downturn. Professor Harvey has argued that yield curve inversion does not necessarily cause recessions, but rather it is an indicator of sentiment about the future of the economy. In his view, as investors become concerned about the prospects for the economy, they tend to buy safe-haven assets such as the 10-year U.S. Treasury. If sentiment is poor enough, buying pressure on the 10-year Treasury can intensify to such an extent that its yield falls below that of the 3-month Treasury, resulting in an inverted yield curve. Figure 1 shows the four most-recent U.S. recessions and their preceding yield curve inversions, as well as the present-day inversion.
Figure 1: Inversion of the 10y-3m Treasury yield spread has been a reliable predictor of U.S. recessions
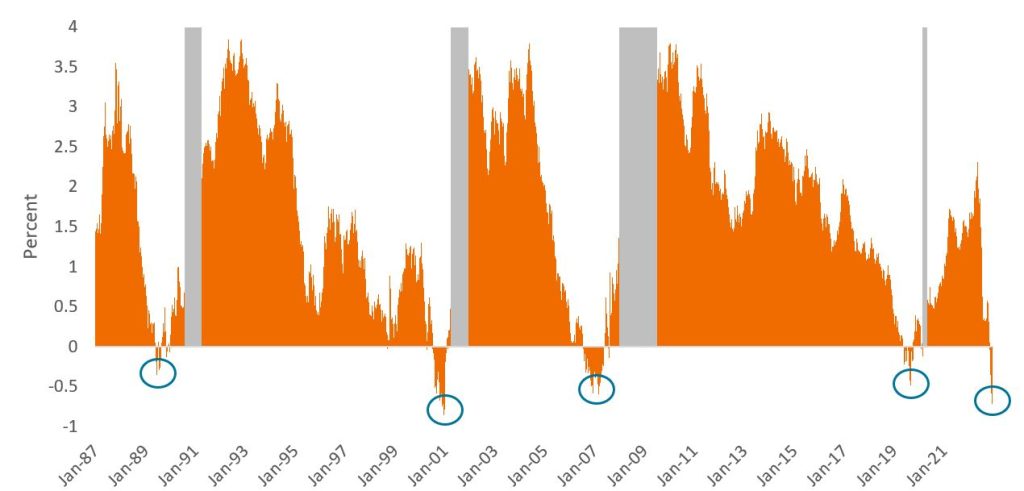
Source: Bloomberg, as of November 30, 2022.
While inversion of the 10y-3m Treasury yield spread has predicted each of the last eight U.S. recessions, it is important to note that there is no guarantee that the present-day inversion will lead to a recession. Nevertheless, investors may find it useful to review the historical relationship between inversion, recession, and returns on financial assets as they consider how to position their portfolios. In addition, knowing the indicator’s limitations might help investors place the appropriate level of confidence in the signals it may be giving.
Figure 2 shows that, for the four most recent recessions, the average time elapsed from peak yield-curve inversion until the start of a recession was eight months. Further, in all cases, the equity market bottomed months after the official start of the recession. (This is an important point to note as investors contemplate whether they believe the lows are already in for equity markets in the current cycle.) In summary, the sequence of events has historically been as follows: Inversion followed by recession followed by an equity market bottom.
Figure 2: Historical relationship among U.S. yield curve inversion, recessions, and equity market bottoms
The U.S. equity market has historically bottomed months after recession has started.
| Early 1990s recession | 2000 dot-com bubble | Global Financial Crisis | COVID | 2022 | Average | |
| Month of peak inversion | June 1989 | Dec 2000 | Mar 2007 | Aug 2019 | Nov 2022* | – |
| Peak inversion level | -0.35% | -0.86% | -0.59% | -0.48% | -0.71%* | -0.57% |
| Months elapsed from peak inversion to official start of recession | 13 | 3 | 9 | 6 | ? | 8 |
| Months elapsed from peak inversion to equity market bottom | 16 | 22 | 24 | 7 | ? | 17 |
Source: Bloomberg, Janus Henderson Investors, as of 30 November 2022. *Date and level of peak inversion in the current cycle is as of 30 November 2022, but eventual peak inversion will not be known until post-cycle. Equity market bottom based on maximum cycle drawdown on S&P 500 Index.
While an inverted yield curve has historically predicted the events that would follow, as well as their sequence, it has been limited in its ability to predict other variables, such as the peak level of inversion, when the recession would start, how long it would last, and how far – or for how long – equity markets would fall. Therein lies the challenge for investors: how long it takes for these cycles to play out remains unpredictable. Therefore, investors should exercise caution in making assumptions regarding the timing of expected events.
In late October 2022, the 10y-3m Treasury yield curve inverted for the first time since 2019 and continued to invert further through November. This has left investors contemplating a recession and wondering how to position their portfolios going into 2023. In our view, inversion has historically been a signal to favor fixed income over equities until the equity market reaches a bottom, as shown in Figure 3.
Figure 3: Returns from date of peak inversion to U.S. equity market bottom
Bonds have historically outperformed equities following peak inversion.
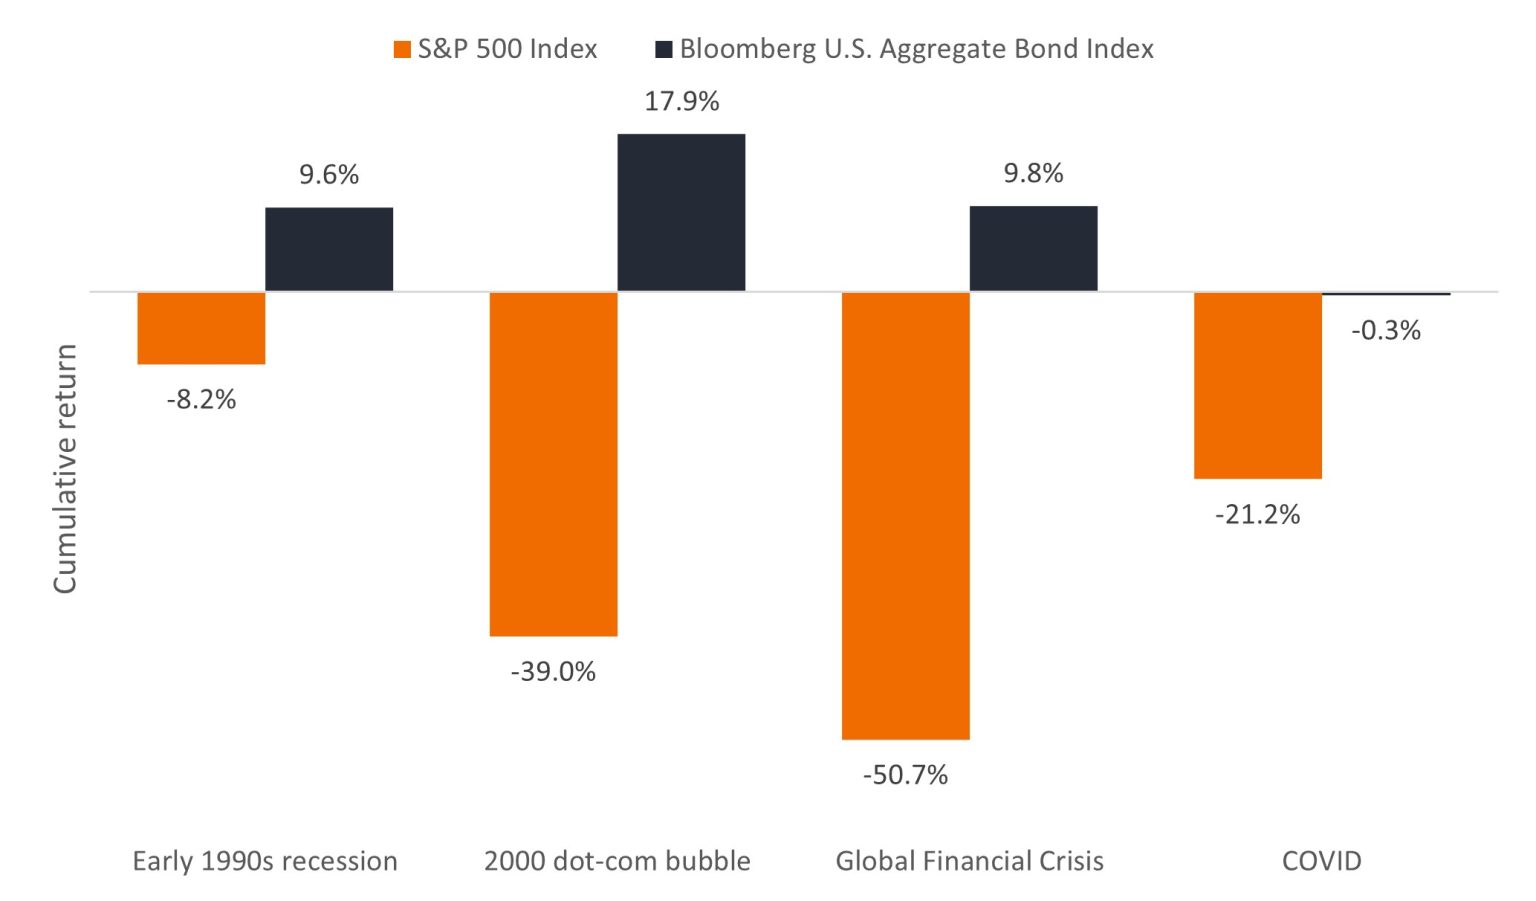
Source: Bloomberg, Janus Henderson Investors, as of 30 November 2022. Return periods run from date of peak inversion of the 10y-3m U.S. Treasury yield curve to the date of equity market bottom. Return periods are as follows: Early 1990s recession (June 1989 to October 1990), 2000 dot-com bubble (December 2000 to October 2002), Global Financial Crisis (March 2007 to March 2009), and COVID (August 2019 to March 2020). Equity market returns are represented by the S&P 500 Index and bond market returns are represented by the Bloomberg U.S. Aggregate Bond Index. Past performance is no guarantee of future returns.
Considering the yield curve is presently deeply inverted, we believe there may be opportunities for core investment-grade fixed income to outperform equities as the economic cycle unfolds. While timing requires careful navigation, we believe investors would do well to pay attention to the signposts that identify where we are in the cycle and begin thoughtfully positioning their portfolios accordingly. We would consider the present deep inversion a signpost that we’re entering the next phase in the cycle when bonds have typically outperformed. Therefore, we think investors might consider a tactical overweight to core investment-grade fixed income in their portfolios.
In addition to rotating into bonds, investors might also want to pay attention to positioning within their fixed income allocations. In a nutshell, we favor high-quality investment-grade bonds at this time. We also favor securitized sectors – particularly agency mortgage-backed securities (MBS), commercial mortgage-backed securities (CMBS), asset-backed securities (ABS), and collateralized loan obligations (CLOs) – over corporate bonds due to the generally stronger average credit ratings of these securitized sectors.
Additionally, securitized sectors are trading at spreads that we believe are already pricing in a recession, whereas corporate bonds (both investment grade and high yield) are still trading at spreads near their long-term averages and are pricing in either a low chance of a recession or a very shallow one. If the U.S. does enter a recession in 2023, corporate spreads are likely to widen to reflect the risks that securitized assets are already pricing in, thereby offering an opportunity for securitized sectors to outperform on a relative basis.
1 Typically, long-term interest rates are higher than short-term rates. On rare occasions, this relationship is flipped, where short-term rates exceed long-term rates, resulting in an inverted yield curve.
2 The four recessions before publication of Harvey’s dissertation took place in 1969-1970, 1973-1975, 1979-1980, and 1981-1982.
3 The four recessions since publication of Harvey’s dissertation took place in 1989-1991 (Early 1990s recession), 2001 (2000 dot-com bubble), 2007-2009 (Global Financial Crisis), and 2020 (COVID).
Bloomberg U.S. Aggregate Bond Index is a broad-based measure of the investment grade, US dollar-denominated, fixed-rate taxable bond market.
Credit spread is the difference in yield between securities with similar maturity but different credit quality. Widening spreads generally indicate deteriorating creditworthiness of corporate borrowers, and narrowing indicate improving.
Investment grade bond is a bond typically issued by governments or companies perceived to have a relatively low risk of defaulting on their payments. The higher quality of these issuers is reflected in their higher credit ratings when compared with bonds thought to have a higher risk of default, such as high yield bonds.
S&P 500® Index reflects U.S. large-cap equity performance and represents broad U.S. equity market performance.
Yield curve is a graph that plots the yields of similar quality bonds against their maturities. In a normal/upward sloping yield curve, longer-maturity bond yields are higher than shorter-dated bond yields. For an inverted yield curve, the reverse is true.
IMPORTANT INFORMATION
Diversification neither assures a profit nor eliminates the risk of experiencing investment losses.
Equity securities are subject to risks including market risk. Returns will fluctuate in response to issuer, political and economic developments.
Fixed income securities are subject to interest rate, inflation, credit and default risk. The bond market is volatile. As interest rates rise, bond prices usually fall, and vice versa. The return of principal is not guaranteed, and prices may decline if an issuer fails to make timely payments or its credit strength weakens.
High yield or “junk” bonds involve a greater risk of default and price volatility and can experience sudden and sharp price swings.
Securitized products, such as mortgage- and asset-backed securities, are more sensitive to interest rate changes, have extension and prepayment risk, and are subject to more credit, valuation and liquidity risk than other fixed-income securities.
Sign up for timely perspectives delivered to your inbox.