
Subscribe
Sign up for timely perspectives delivered to your inbox.
The Global Property Equities Team discuss the opportunities in listed real estate now and the key considerations for investors in the year ahead.


This time last year, we wrote that 2021 was a year of relief given what had happened in 2020. That relief did not last very long as the predicted ‘speedbumps’ turned out to be one very large inflation-shaped hump, which has been difficult for markets to traverse.
2022 looks to be the worst year in more than two centuries for US 10-year government bond returns.1 Equities usually provide some counterbalance to weaker bond markets, but this has not been the case this time round. The MSCI World Index is down 16% at the time of writing, resulting in the worst annualised year-to-date returns for a balanced 60/40 portfolio in a hundred years.2
Truly, there has been nowhere to hide – real estate equities have not been spared either. While historically, listed REITs have demonstrated that they can perform well in periods of rising inflation, 2022 proved to be different. Global real estate investment trusts (or REITs, as measured by the FTSE EPRA Nareit Developed Total Returns Index) fell almost 24%3. But what has caught most investors off guard has been the magnitude and stubbornness of inflation, coupled with the US Federal Reserve’s response, increasing rates at the fastest pace since 1988-89.4
While the overall listed global property market suffered in 2022, there are some important distinctions within regions. Asia proved somewhat more defensive, down only 14% partly due to already distressed valuations and lagged response in some reopened economies post pandemic. To achieve its inflation target, the region’s largest market, Japan, is limiting the 10-year Japanese government bond yield to a maximum of 0.25%. This is in contrast to higher bond yields elsewhere resulting from aggressive rate hiking by other major central banks. On the other hand, European property has fallen by 40% in US dollar terms as the market quickly re-priced off its low interest rate level and now trades at an unprecedented discount to net asset value (NAV), including during the Global Financial Crisis. Meanwhile, the US-listed REIT market returned -23% to 18 November.5 Here, hotels and single tenant property were among the best performers, while both growth and non-growth sectors industrial and office respectively, have been the weakest.
However, the overall story has been one of rising rates, so while share prices have fallen, resulting in higher EBITDA/EV yields (a helpful way of thinking about market implied debt-adjusted real estate yields), bond yields rose faster. This led to the spread (difference between global REITs and 10-year government bond yields) narrowing to the long-term average – ie. the blue line and green line in figure 1 are now at a similar level.
In terms of global real estate yields (dark grey line), they rose from 4.3% at the end of 2021 to 5.7% at end October 2022, so clearly equity markets have done a lot of heavy lifting downwards in response to the movements in bond markets.
Global property markets EBITDA/EV yield (%) and US 10-year Treasury yield
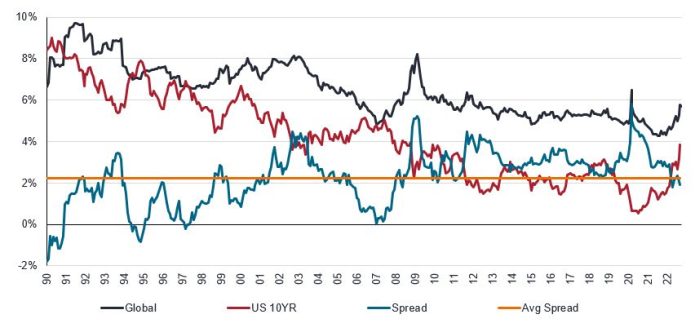
Source: UBS, Janus Henderson Investors analysis as at 31 October 2022. Past performance does not predict future returns. Global real estate=UBS coverage universe.
We have already started to see some of this yield expansion reflected in some direct property markets. The UK in particular has been very swift to act, with valuers moving quickly to reflect this new reality. UK prime commercial yields rose by around 50 basis points (bps) over the last 12 months, while prime logistics sector yields are up 175bps since May 2022. 6 Clearly not all markets will move by this magnitude, and indeed valuers may have slightly jumped the gun a little. But the fact that listed global real estate equities have priced in on average 160bps of yield expansion tells us a more constructive view of the market has already been factored into listed REIT share prices, gives us some comfort.
Another aspect to consider as the cost of debt rises, is the financial health of companies, particularly if balance sheets are well capitalised, and the impact on cash flow stability. On this front, things look better than at any time in recent history. US-listed REITs’ current weighted average term to maturity is more than seven years, and debt levels are also low. Listed REITs also have only around 17% variable debt, compared to circa 60-70% for the largest private real estate managers.7
One final aspect to consider when looking at real estate fundamentals is what is happening to rental levels and how will they be impacted in an economic slowdown?
So far, top line fundamentals have remained strong. No doubt as recessions begin to bite, some of the shine may come off, but with supply relatively muted due to COVID-19 fallout and certain sectors of structural growth such as logistics, data centres, and single tenant residential still enjoying robust demand, there is potential for overall rental growth to remain positive in 2023.
This income durability is a key consideration for our team in the year ahead. We continue to believe a focus on areas of structural growth and undersupply can help cushion against negative cyclical forces.
We have discussed what equity markets are implying for listed property values and what some valuers are already starting to reflect in property valuation write downs. But one area that we have highlighted to investors, and which has so far remained relatively immune, has been private real estate.
According to the most recent returns for the ODCE Index, which reflects the performance of US private real estate, private fund valuations are up 12% year-to-date to 30 September 2022 – a stark contrast to listed US REITs, which are down by almost 30% over the same period. 8 Looking at figure 2, we can see that while past performance does not predict future returns, buying listed REITs at current valuation levels, relative to private real estate has proved to be a smart move for investors over the longer term.
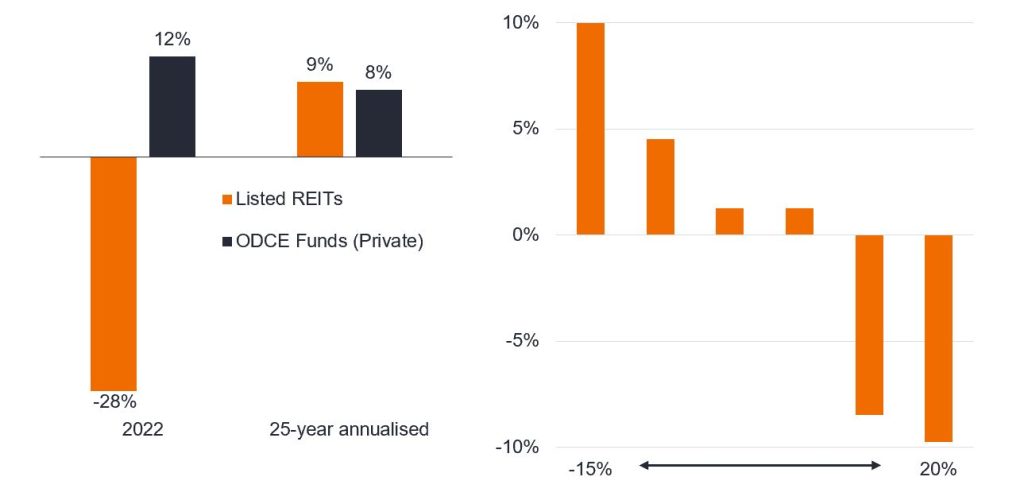
Source: Bloomberg, NCREIF, Green Street, Janus Henderson Investors analysis, as at 30 September 2022. LHS: Public= US-listed REITs YTD total return as at 30 September 2022. Private property= ODCE Index. Past performance does not predict future returns.
In our view, there can be little real doubt that private real estate valuations are likely to have to adjust in 2023. This year has been painful, but thankfully for listed real estate “the band aid has been ripped off.” While 2023 will bring further challenges, we believe the starting point today is more reflective of the reality to come.
1,2 Refinitiv Datastream, US 10-year government bond returns and MSCI World Total Return Index year-to-date to 18 November 2022; BofAML Global Research: The Flow Show dated 23 October and 13 October 2022.
3 Goldmans Sachs Europe Real Estate 15 September 2022. Refinitiv Datastream, Haver Analytics, Kenneth French, Goldman Sachs Global Investment Research. Data from 1950, inflation based on US CPI (Consumer Price Index) and US REITs= FTSE Nareit All Equity REITs Index. Global REITs returns: Refinitiv Datastream: FTSE EPRA Nareit Developed Total Returns Index in USD terms from 31 December 2021 to 18 November 2022. Past performance does not predict future returns.
4 Comparing the Speed of U.S. Interest Rate Hikes (1988-2022) (visualcapitalist.com)
5 FTSE EPRA Nareit Developed Europe Index, FTSE EPRA Nareit Developed Asia Index and FTSE Nareit All Equity REITs Index, total returns in USD terms, year-to-date to 18 November 2022.
6 UK prime yields. Savills: Markets in Minutes: UK Commercial 1 November 2022.
7 Variable and fixed debt: Citi Research: Viewpoint, theHunter Express & Lodging Valuation Tool, 19 September 2022. Thomas R Arnold, David C Ling, Andy Naranjo. “Private Equity Real Estate Fund Performance: A Comparison to REITs and Open-End Core Funds.” The Journal of Portfolio Management Special Real Estate Issue 2021, October 2021.
8 ODCE Index year-to-date returns to 30 September 2022.
Balance sheet: an indicator of a company’s financial health. It is a financial statement that summarises a company’s assets, liabilities and shareholders’ equity at a particular point in time. Each segment gives investors an idea as to what the company owns and owes, as well as the amount invested by shareholders.
Bond yield: the level of income on a security, typically expressed as a percentage rate. For a bond, this is calculated as the coupon payment divided by the current bond price.
Discount to NAV: occurs when the REIT’s market price is lower than the most recent NAV. A discount often indicates the market is generally bearish on the investments in the portfolio. Net Asset Value is the value of the portfolio’s assets at market close, minus liabilities, divided by the total number of shares outstanding.
Leverage: in the context of this article, we refer to the amount of debt that a REIT carries. The leverage ratio is measured as the ratio of debt to total assets.
EBITDA/EV yield: a financial valuation ratio that measures a company’s return on investment (ROI) NAV. It seeks to value similar companies using the same financial metrics. Cash flows are used to evaluate the value of a company, one with a healthy cash flow will have a high EBITDA/EV value and vice versa.
Weighted average maturity (WAM): the average time remaining until the maturity of a debt portfolio.
MSCI World Index℠ reflects the equity market performance of global developed markets.
ODCE Index is a core capitalisation-weighted index that includes only unlisted open-end diversified core strategy funds with at least 95% of their investments in US markets.
IMPORTANT INFORMATION
REITs or Real Estate Investment Trusts are an investment vehicle that invests in real estate, through direct ownership of property assets, property shares or mortgages. As they are listed on a stock exchange, REITs are usually highly liquid and trade like a normal share.
Real estate securities, including Real Estate Investment Trusts (REITs) may be subject to additional risks, including interest rate, management, tax, economic, environmental and concentration risks.
Foreign securities are subject to additional risks including currency fluctuations, political and economic uncertainty, increased volatility, lower liquidity, and differing financial and information reporting standards, all of which are magnified in emerging markets.
Sign up for timely perspectives delivered to your inbox.