

Subscribe
Sign up for timely perspectives delivered to your inbox.
In his 2023 equities investment outlook, Matt Peron explains why tighter financial conditions should lead to a mid-cycle adjustment in the U.S. rather than recession and how investors – by focusing on quality growth companies – can dampen headwinds posed by softer earnings.


Throughout 2022, equities investors have had difficulty reconciling the corporate sector’s sturdy financials with the expectation that aggressive monetary tightening will lead to materially slower economic growth. Complicating matters are investors’ thus-far unanswered prayers that the Federal Reserve (Fed) and other central banks may not be fully committed to their hawkish path and could either pivot at the first sign of inflation easing or get cold feet when facing recession. This unfounded optimism has been on display during a series of ephemeral rallies of at least 6% during the course of the year while stocks’ downward trend remained intact.
We believe investors must come to grips with the fact that the era of ultra-low rates providing a tailwind for equities is coming to an end. And although the path toward policy normalization will continue to be bumpy – especially while inflation remains elevated – there are signs that the most dire predictions of a sustained bear market and economic gloom, particularly in the U.S., are overblown. After having capitalized on low rates and pandemic-era stimulus, both consumer and corporate balance sheets are in good shape, earnings have proven surprisingly resilient, and the U.S. labor market continues to show strength.
Given this backdrop, we expect that additional rate increases – albeit at a possibly slower pace – should result in the U.S. experiencing a mid-cycle adjustment rather than a steep economic downturn. This possibility alone is an indication of the Fed’s diminished role in supporting asset prices. Consequently, investors would be well served to reference their market-cycle playbooks when determining how to position their equity allocations.
Inevitably, a slowing economy and higher cost of capital will weigh on corporate prospects. To weather this period, we believe investors should prioritize companies that exhibit quality. These businesses, with their sound balance sheets and ability to generate stable earnings throughout the market cycle, should prove more resilient than weaker peers and could propel them to emerge from a downturn in a stronger competitive position.
The negative equity returns of 2022 were largely driven by multiple compression as previously elevated price-to-earnings (P/E) ratios were brought back to earth. Much of this was due to the math of higher discount rates decreasing the present value of a company’s expected earnings streams. The pace at which rates reset was startling, but the result was not. During a decade of suppressed interest rates, equity valuations soared as companies borrowed on the cheap and investors bid up riskier asset classes in the search for yield and growth. But by October, the full-year 2022 P/E ratio of the S&P 500® Index had slid 30% to 16. This level, however, aligns with what we would expect with the cost of capital – as represented by the yield on the 10-year U.S. Treasury – at 4.0%, which is roughly the midpoint of its recent range.
Figure 1: Relationship between 10-year U.S. Treasury yield and S&P 500 P/E ratio
Over the longer term, a 4.0% yield on the 10-year Treasury tends to align with a forward P/E ratio of roughly 16.
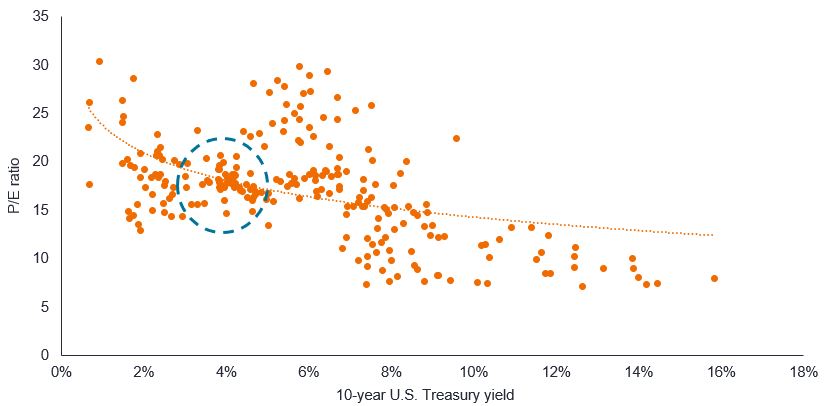
Source: Bloomberg, as at 10 November 2022. Regression based on monthly data of 10-year U.S. Treasury yields and trailing 12-month P/E ratios of S&P 500, which is highly correlated with forward-looking multiples.
With valuation multiples having fallen to – and in some cases below – historical averages and the 10-year yield seemingly finding a ceiling, we believe the headwind of P/E compression has mostly run its course. That does not mean stocks are out of the woods, however. Aggregate S&P 500 earnings estimates for 2022 and 2023 have only been revised downward by 3.4% and 5.0%, respectively. With the economy slowing, we believe these estimates will likely come down further. The story is similar for global equities – perhaps even more so, given the additional headwinds of Europe’s acute energy crunch and, in the case of Asia, persistent rolling COVID-related lockdowns in China.
While the U.S. economy grew at a 2.6% annualized rate in the third quarter, signs of softening have emerged. Higher borrowing costs resulted in both goods purchases and residential construction weighing on growth, with inventories also detracting. This may portend the type of drawdown of completed goods that occurs during economic downturns. Reinforcing this is the Institute for Supply Management’s new orders subindex of its manufacturing index having remained below the inventory subindex since May.
Other indicators also signal a weakening economy. A leading measure of broader money has contracted by 1.0% since its March peak as liquidity is slowly drained from the system. Additionally, the yield on the 2-year U.S. Treasury has been higher than that of the 10-year since July. While such yield curve inversions don’t guarantee an economic slowdown, the more recent 3-month/10-year inversion is unsettling, as these often precede an imminent economic contraction.
The labor market has yet to flash caution, but with the Fed committed to taming inflation, we believe that unemployment will eventually have to rise. Payroll gains in goods-producing industries have already begun to soften, likely due to the combination of the hangover from extensive purchases during the pandemic and rising borrowing costs acutely hitting big-ticket items. Services payrolls, however, have yet to show meaningful slowing. Given that wages are a major contributor to the services sector, which accounts for 80% of the U.S. economy, we doubt the Fed can achieve its inflation goals without reducing the upward wage pressure that has seen year-over-year hourly earnings growth average above 5.0% in 2022.
It may be uncomfortable to fathom, but even after 2022’s roughly 20% losses on U.S. and global equities indices, investors should likely brace for more near- to mid-term volatility. The question is, what could drive stock losses to extend from -20% to -30%? There are myriad possibilities, most of which would be manifested through weaker earnings. Although consumption has been buoyant, as flush household savings are drawn down – especially if a slowing labor market impedes workers’ ability to demand higher wages – the U.S. economy could lose the incremental bump provided by this important driver. Reduced household spending would likely aggravate the current inventory buildup, further causing goods producers to curtail output. We’ve seen this in the past as the race to catch up with post-recession demand leads to intense production just as central banks begin to tap the brakes on an overheating economy.
Figure 2: 2022 S&P 500 Index P/E ratios and earnings per share (EPS) estimates
Falling P/E multiples have been quicker to price in a higher-rate, lower-growth environment than earnings estimates, and we believe that additional downside risk to stocks will likely come from investors having to tone down their 2022 and 2023 profits expectations.
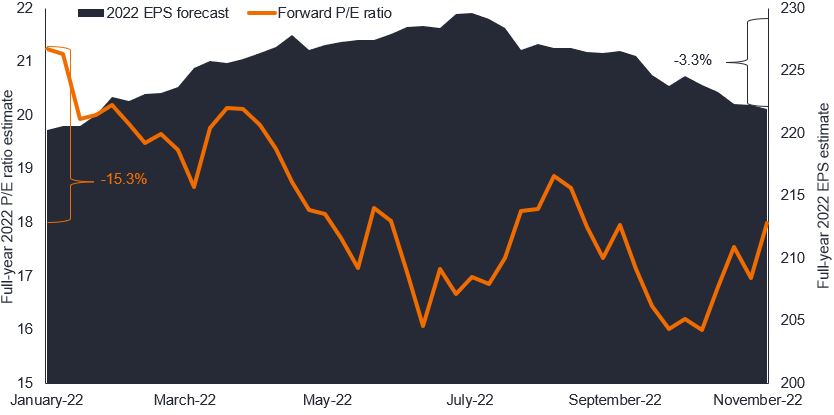
Source: Bloomberg, as at 10 November 2022.
Many economies are already facing an inventory-driven slowdown. At worst, we believe this may result in a mild inventory recession. But in our view, it is more likely that, with much of the economy still on sound footing, the U.S. and other countries that have exhibited economic resilience will likely experience a mid-cycle adjustment in 2023. Importantly, we don’t foresee a more ferocious balance-sheet recession as there are no obvious potential sources of systemic vulnerability.
Downside risks to our outlook do exist. Chief among them is policy error on behalf of monetary authorities. The Fed understands that leading indicators have already rolled over. This is likely behind the market expecting rate hikes to occur at a slower cadence through mid-2023. Still, should a supply-side shock – e.g., energy or food – emerge or the wage-price spiral prove difficult to break, the Fed may have to increase its policy rate higher than the roughly 5.0% now priced in by futures markets. On some level, higher rates would assure at least a mild recession. Other central banks are in a more precarious situation as they face the stagflationary environment of high prices and a contracting economy.
While we believe downward earnings revisions could result in additional equities losses, our view that a recession is not imminent means that investors would not necessarily need to completely avoid risky assets. As revenues fall and margins are squeezed, we think investors should seek companies with steady earnings streams and low levels of debt. These are the hallmarks of “quality” that, in our view, should outperform the broader market in times of economic weakness.
Figure 3: Equity factor peak-to-trough returns in recent recessions
In recent recessions, quality has outperformed other factors.
| Event | Peak | Trough | Value | Growth | Quality | Momentum | Minimum volatility |
|---|---|---|---|---|---|---|---|
| 1990-1991 recession | Jul 1990 | Mar 1991 | -3.9% | -0.8% | 5.0% | 0.3% | -4.6% |
| Tech bubble & 9/11 | Mar 2001 | Nov 2001 | -7.3% | -2.9% | 1.6% | -9.1% | -1.7% |
| Global Financial Crisis | Dec 2007 | Jun 2009 | -38.3% | -35.8% | -28.2% | -44.0% | -29.2% |
| COVID-19 pandemic | Feb 2020 | Apr 2020 | -9.5% | 1.5% | 1.5% | -1.0% | -3.4% |
Source: Bureau of Economic Analysis, Janus Henderson Investors. Peak-to-trough returns measured on factor-based components of the MSCI World Index.
While quality is considered a factor in its own right, we believe the concept of steady cash flows and fortified balance sheets is style- and market cap-agnostic; these companies exist across the equities universe. Companies with unstable fundamentals were able to hide during the era of low rates as they could roll over debt and yield-starved investors indiscriminately bought the market. With the full amplitude of the market cycle returning as central banks step away from supporting asset prices, a company’s inability to generate sufficient cash flows to fund existing operations and future investment is at risk of being exposed. And although many stocks can exhibit “quality” characteristics, we believe this trait is naturally aligned with the growth category. High-quality growth companies tend to prioritize the organic growth – and thus cash flow generation – that enables them to invest in promising initiatives throughout the business cycle. In contrast, companies that rely on debt to finance future growth are vulnerable in periods of rising rates and slowing growth. Not surprisingly, highly-levered businesses whose valuations rest on far-off cash flows have been among the year’s worst performers.
Focusing on quality companies is likely a prudent tactic until the future path of inflation and interest rates becomes more visible. At some point over the mid-term, however, investors will have the opportunity to look past the turbulence and assess which businesses are likely to thrive on the other side. For that to occur, we believe a clearing event will be necessary. A prime candidate would be capitulation by the retail investors who have been a force in markets over the past two years. These investors have been committed to stocks, largely bullish, and likely behind the bear-market rallies of 2022. But their enthusiasm may change should earnings expectations be revised materially downward. As stated, we expect this to occur in coming months as the market, in our view, has yet to fully price in the ramifications of higher borrowing costs, an inventory drawdown, and – quite possibly – rising unemployment.
For active investors, such clearing events present the opportunity to identify companies whose flagging stock prices have become disconnected from their promising long-term prospects. Given the forward-looking nature of markets, this disconnect can occur well before the economy – or earnings – finds a bottom. As illustrated in Figure 4, P/E ratios have the tendency to diverge from the downward trajectory of earnings as investors begin to see signs of a recovery once inventory overhangs start to ease and lending conditions loosen.
Figure 4: Months to forward P/E ratios and earnings troughs in recent recessions
With the exception of the dotcom bubble, when high valuations took considerable time to compress, S&P 500 forward-looking P/E ratios tend to find a bottom before downwardly revised earnings as investors begin to position themselves for recovery.
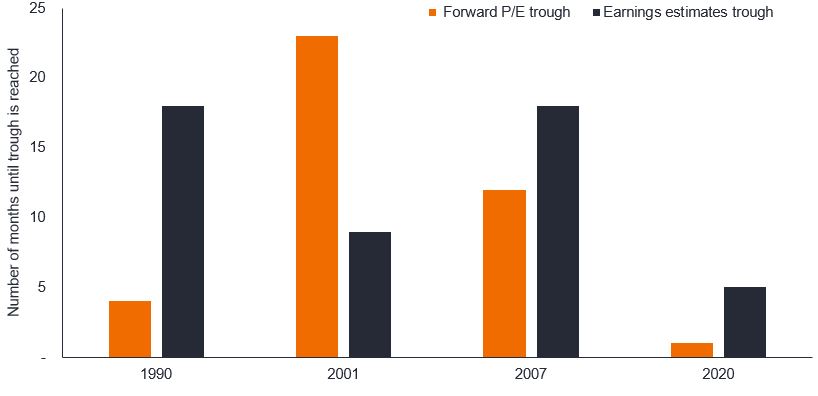
Source: Bloomberg, Janus Henderson Investors, as at 10 November 2022. S&P 500 Index data. Months to trough based on when previous cycle peak was reached.
Even with our relatively sanguine view that we are facing a mid-cycle adjustment rather than recession, it’s clear that the economy is slowing. And given the oft-cited long and variable lags of monetary policy, we believe the slowdown will continue for the next several months. As the market seeks a bottom, investors should be on the lookout for names whose valuations have already dipped to attractive levels but that still exhibit the characteristics of quality and sustainable growth over the longer term. This is analogous to the investment philosophy of growth at a reasonable price (GARP). Such names, in our view, should prove more resilient in a downturn and also in the new era that likely awaits investors.
As for that era, we believe it will look different than the past 15 years. Inflation-adjusted, or “real,” interest rates will likely stay positive. A higher cost of capital means corporate managers must act more judiciously when making investment decisions. Investors, too, will have to adapt by focusing on companies with the potential to consistently grow earnings and generate positive cash flows rather than those that survive only by rolling over cheap debt. Valuations will matter more as well; it won’t be a pure “value” market, but rather “value aware.” Consequently, investors may want to keep the concept of GARP at the ready – not only in 2023, but beyond.
Unless otherwise noted, all data sourced from Bloomberg as at 11 November 2022.
10-year Treasury yield: the interest rate on U.S. Treasury bonds that will mature 10 years from the date of purchase.
Bear market: A financial market in which the prices of securities are falling. A generally accepted definition is a fall of 20% or more in an index over at least a two-month period. The opposite of a bull market.
Clearing event: The market is cleared when the price brings demand and supply into balance. A clearing event occurs when supply and demand are equal.
The Fed, or Federal Reserve: the central banking system of the United States.
The Institute for Supply Management (ISM’s) manufacturing index or Purchasing Managers’ Index is considered a key indicator of the state of the U.S. economy. It indicates the level of demand for products by measuring the amount of ordering activity at the nation’s factories.
Growth at a reasonable price (GARP) investors seek companies that are undervalued (value investing) with solid sustainable growth potential (growth investing).
MSCI World Index℠ reflects the equity market performance of global developed markets.
Monetary policy: The policies of a central bank, aimed at influencing the level of inflation and growth in an economy. It includes controlling interest rates and the supply of money. Monetary tightening refers to central bank activity aimed at curbing inflation and slowing down growth in the economy by raising interest rates and reducing the supply of money. Monetary stimulus refers to a central bank increasing the supply of money and lowering borrowing costs.
Multiple: A metric that measures some aspect of a company’s financial well-being, in this case, how much investors are willing to pay per dollar of earnings, as computed by the price-to-earnings (P/E) ratio.
Price-to-earnings (P/E) ratio: A popular ratio used to value a company’s shares, compared to other stocks, or a benchmark index. It is calculated by dividing the current share price by its earnings per share. The Forward P/E ratio uses the forecasted earnings per share of the company over the next 12 months for calculating the price-earnings ratio.
Risk assets: Generally refers to assets that have a significant degree of price volatility, such as equities, commodities, high-yield bonds, real estate, and currencies.
S&P 500 Index reflects U.S. large-cap equity performance and represents broad U.S. equity market performance.
Stagflation: A relatively rare situation where rising inflation coincides with anemic economic growth.
Systemic risk: The risk of a critical or harmful change in the financial system as a whole, which would affect all markets and asset classes.
Valuation multiple is a ratio that reflects the valuation of a company in relation to a specific financial metric. Valuation multiples and the use of standardized financial metrics allow for comparisons of value among companies with different characteristics, most notably size.
Yield: The level of income on a security, typically expressed as a percentage rate. For equities, a common measure is the dividend yield, which divides recent dividend payments for each share by the share price. For a bond, this is calculated as the coupon payment divided by the current bond price.
Yield curve: A graph that plots the yields of similar quality bonds against their maturities. In a normal/upward sloping yield curve, longer maturity bond yields are higher than short-term bond yields. A yield curve can signal market expectations about a country’s economic direction.
Yield curve inversion: A yield curve inverts when long-term interest rates drop below short-term rates, indicating that investors are moving money away from short-term bonds and into long-term ones.
IMPORTANT INFORMATION
Equity securities are subject to risks including market risk. Returns will fluctuate in response to issuer, political and economic developments.
Sign up for timely perspectives delivered to your inbox.