


Subscribe
Sign up for timely perspectives delivered to your inbox.
Director of Equities Research Matt Peron explains how the path of inflation and interest rates could influence future economic and financial market developments.


Within weeks, a dramatic year for financial markets will be behind us. Accelerating inflation, a historic pace of interest rate hikes, and market volatility have compelled investors to heighten their senses with the aim of determining how these interconnected forces will impact the trajectory of the global economy and financial markets. Recognizing that an image can more effectively convey the magnitude of recent economic and market developments than words alone, we want to share with our readers a few key data points that we’ll be closely monitoring in the months ahead.
Central banks’ missed call on transitory inflation let the genie out of the bottle. With the converging forces of a reopening economy, supply-chain dislocations – remember the scramble for semiconductors and used cars? – an energy crunch, and massive fiscal stimulus in the U.S., inflation recently reached multi-decade highs in many developed markets. And while goods prices may have peaked in the U.S., those for services – with their considerable wage component – continue to climb at a worryingly fast pace. Inflation across Europe continues to climb as well. This may persist as the demand for a curtailed supply of energy increases during the colder months.
While the surge in prices is expected to subside in 2023, with the exception of Japan, inflation is still anticipated to average above most central banks’ policy targets.
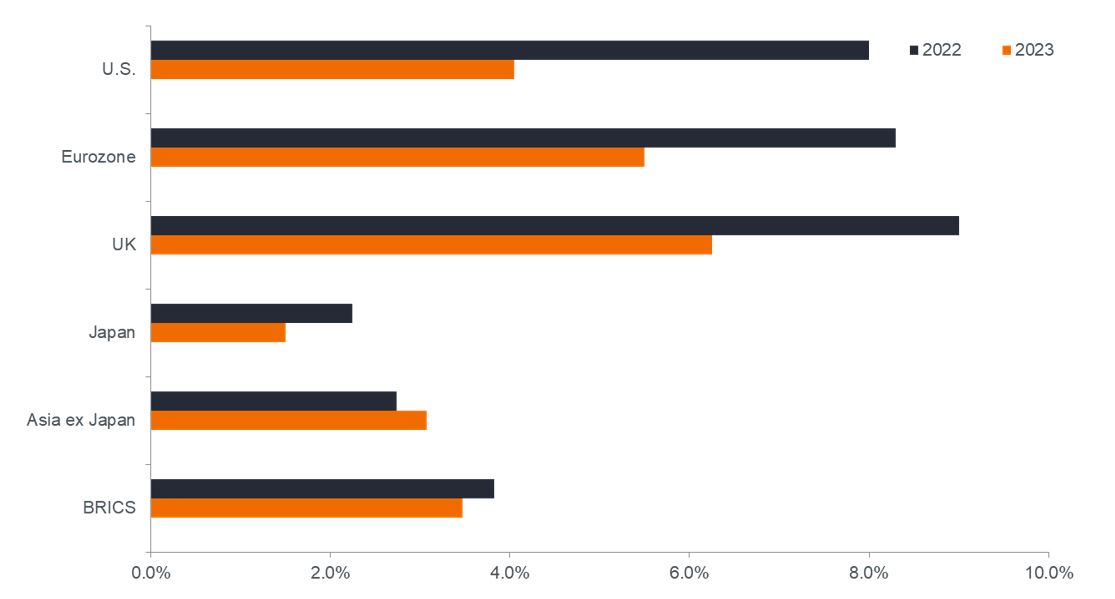
Source: Bloomberg, as of 31 October 2022.
Across most regions, inflation is expected to cool in 2023. The degree to which it does will affect – well, everything. At 4.0%, the Federal Reserve’s (Fed) benchmark policy rate sits 1.1 percentage points below the bank’s preferred inflation measure – the year-over-year change in the personal consumption expenditure core price index. Historically, inflation is not typically reined in until policy rates exceed inflation. For that to occur, either inflation needs to fall considerably, or the Fed must continue to hike, albeit possibly at a slower pace. This dynamic holds true in other regions as well. Within the eurozone, the October estimate for headline inflation is 10.7%, egregiously above the European Central Bank’s (ECB) main refinancing rate of 2.0%.
Last December, futures markets implied that the fed funds rate would finish 2022 below 1.0%. (It’s currently 4.0% and the market anticipates at least another 50 basis-point (bps) hike in December.) Faced with similar inflationary forces and the added pressure of a plummeting pound injecting imported inflation into the mix, the Bank of England was even quicker to the punch than the Fed. Belatedly, the ECB has turned former President Mario Draghi’s maxim of doing whatever it takes on its head and is now applying the same zeal to stemming rising prices.
The pace of rate hikes has been historic and forward-looking derivatives markets expect additional hikes across most major economies.
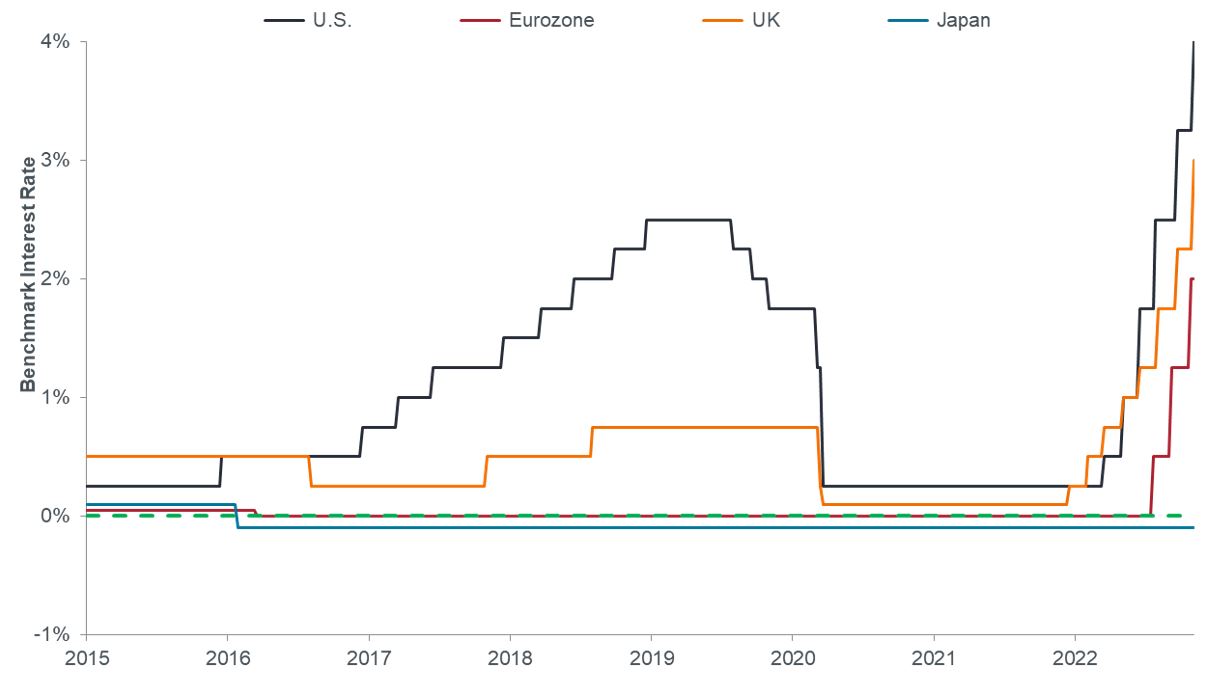
Source: Bloomberg, as of 4 November 2022.
With a global economy beginning to slow and inflation – often driven by supply factors – remaining persistent, central banks have a narrow needle to thread to bring down prices without (materially) worsening economic conditions. For some regions, the unfortunate tandem of a weak economy and high prices – aka, stagflation – will be unavoidable. How central banks manage this balancing act over the next several months will go a long way toward determining what type of landing – soft or hard – is in store for the global economy.
Already the global economy is showing signs of slowing. In March, consensus forecasts for 2022 global and U.S. gross domestic product (GDP) growth were 4.0% and 3.5%, respectively. At the end of October, 2022 global growth was expected to reach only 2.9% and 1.8% for the U.S. Projections for 2023 are even more dire as U.S. growth is expected to be barely above 0.0%, while both the UK and eurozone potentially face a year of economic contraction. These estimates factor in the notorious long and variable lags of monetary policy that either have already occurred or are expected to be implemented. Should inflation force central banks to be even more restrictive or demand destruction in the face of high prices take hold, economic forecasts may again have to be revised.
According to forward-looking indicators, tighter policy is already beginning to bite. Global, eurozone, and China purchasing manager indices (PMI) have all entered contraction territory and the U.S. manufacturing PMI is barely above water.
Not only have several regions seen purchasing manager indices dip into contraction territory, but forward-looking subindices also present even greater evidence of a slowing economy.
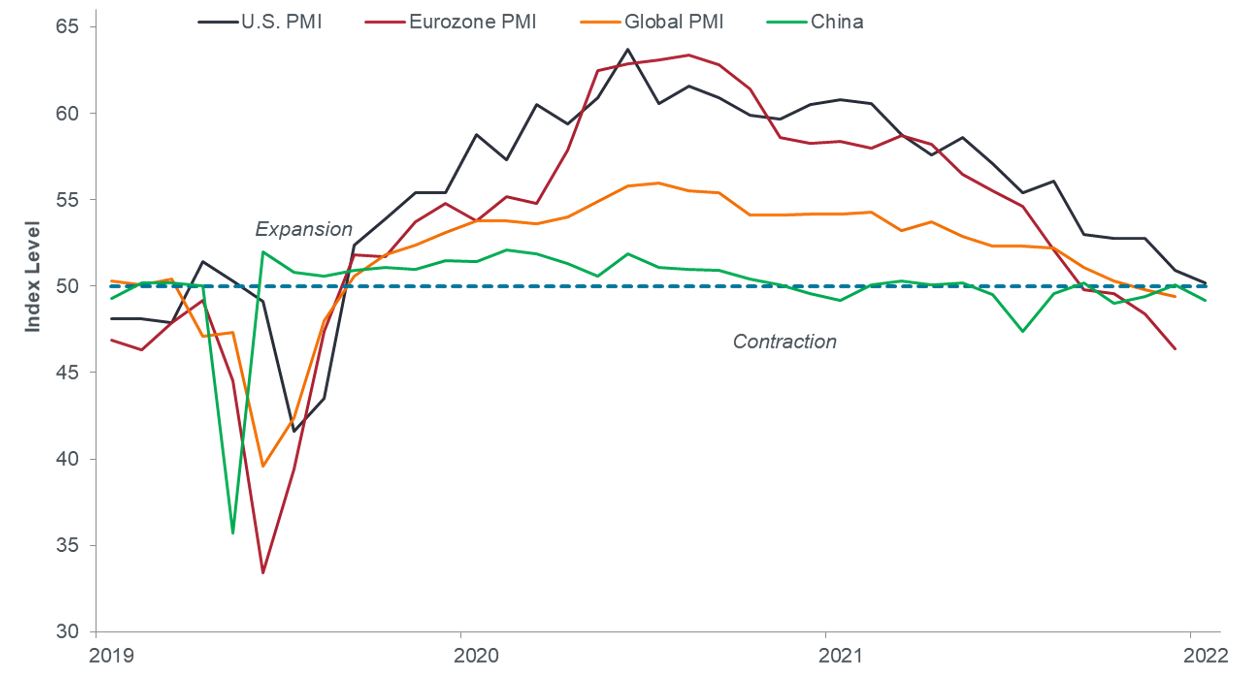
Source: Bloomberg, as of 31 October 2022.
Going a layer deeper, the U.S. manufacturing PMI’s new orders subindex has clocked in beneath the inventory subindex since May. This portends the type of inventory build-up that can lead to recessions as businesses are forced to draw down completed goods in the face of slowing demand – typically the consequence of higher financing costs. Comparing the six-month change in new orders to the six-month change in Treasury yields tells a similar story. These metrics tend to diverge – as they have now – only when an inventory-led slowdown is imminent.
Other leading indicators strike the same tune. Not only have the yields between the 10-year and 2-year U.S. notes been inverted since July, but for a brief period in early November, the yields of the 3-month T-Bill crested that of the 10-year note. If the 10-2 spread flashes “caution”, a 3-month/10-year inversion represents an even more acute concern. Recession is not a certainty, but monitoring a series of reliable leading indicators can help investors position themselves for any unforeseen turns the economy may take.
For asset allocators resting their hopes on the benefits of diversification, 2022 has been especially difficult. The Bloomberg Aggregate Bond index, a benchmark for the U.S. fixed income market, has fallen more than 15% – only modestly less than equities, as measured by the S&P 500 Index. The driving force behind bonds’ tribulations was the one-two punch of high inflation and rising rates. Compounding this downdraft with respect to the absence of diversification was extraordinarily accommodative policy across jurisdictions that left bond yields nowhere to go but up. With policy rates near the zero-bound, bonds simply did not have the room to rally – except for the rare foray into negative-yield territory – when sentiment toward riskier assets soured.
Yet the resetting of yields – both those of fixed income and heretofore frothy growth stocks – to more attractive levels stands to provide investors with myriad benefits that have recently been lacking. Foremost, the current yield on the 10-year U.S. Treasury – 4.11% – means this traditional “safe-haven” asset has room to appreciate in risk-off environments. Indeed, during this year’s upward path in yields, the 10-year note has occasionally rallied in the wake of bearish economic developments.
Another benefit to higher yields is higher yields themselves. Bond investors have been thirsting for attractive income for over a decade; its absence has led to the tendency of investors reaching for yield in riskier asset classes. Last month, for the first time since 2009, the ratio of the 10-year Treasury’s yield to the S&P 500’s earnings yield climbed above its long-term average, indicating that bonds could again present an attractive complement – and, in some cases, alternative – to an equities allocation.
While both equity earnings and bond yields have risen, the latter’s more rapid increase has resulted in increased relative attractiveness and presents the potential for capital appreciation and diversification to riskier assets.
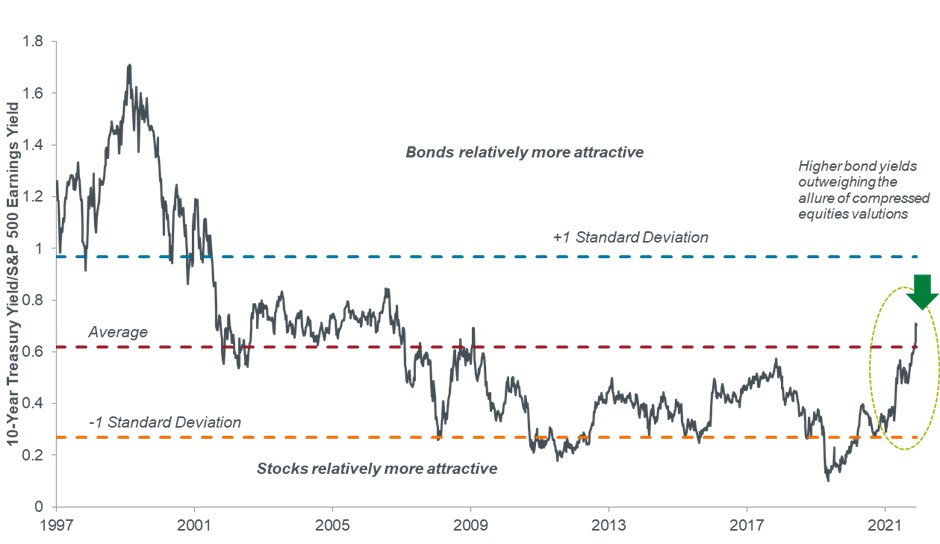
Source: Bloomberg, as of 31 October 2022.
What has perhaps been lost in the dramatic rise in bond yields is the improving earnings yield on stocks. Even prior to the pandemic, growth stocks, with their higher price-to-earnings (P/E) ratios, were a driving force in markets. Implicit in a high-valuation multiple is a low earnings yield, as these ratios are each other’s inverse. The more one “pays” now for a stock’s earnings streams, the less they yield over time, all things being equal. So while both bond and equity yields have risen, the former has done so at more rapid clip.
Three forces behind the high P/E ratios of recent years were investors buying growth where they could find it in a low-growth environment, the tailwind provided by rapid tech adoption during the pandemic, and the effect of low discount rates on valuation multiples. The latter two have receded and the former depends upon the economy’s ability to stave off recession.
The upshot of this year’s sell-off has been equity valuations falling to – and in some cases below – long-term averages. This presents “price-aware” investors with opportunities. Indiscriminate sell-offs have likely left many individual stocks below their intrinsic value. Furthermore, we expect market gyrations to continue, resulting in even more pronounced price dislocations in many cases.
After years of residing well above long-term averages – due in part to low interest rates – equity valuation multiples have dipped toward long-term averages, potentially presenting investors with the opportunity for upside participation once risk sentiment improves.
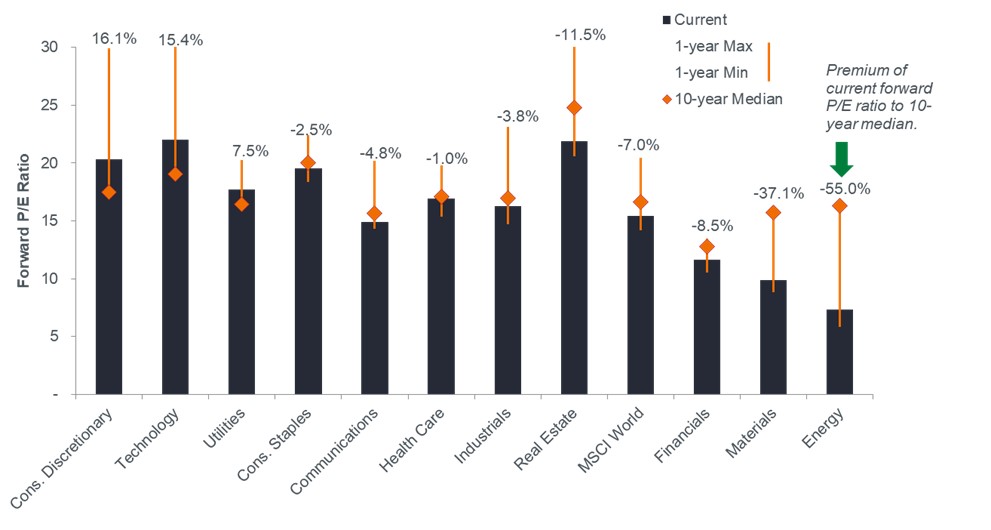
Source: Bloomberg, as of 31 October 2022.
We do not expect market volatility to subside until investors have greater visibility into the path of inflation and interest rates. These undulations could further rattle investors’ confidence, thus resulting in additional multiple compression. Worse-than-expected earnings results in coming quarters may be the “clearing event” that causes valuations to find a bottom. While it’s a fool’s errand to try to predict when that could occur, especially with the amount of economic and geopolitical complexities roiling markets, the forward-looking nature of equities means that investors should, at some not-far-off point, balance their priorities of valuation discipline and attractive returns by seeking growth at a reasonable price.
Given the macro-driven backdrop, most of the eventualities discussed here hinge on the future path of monetary policy. The question is, how high will rates have to rise? Also, will policymakers blink when faced with a materially weaker economy? Australia and Canada may have already stepped back from maximum hawkishness. Near term, investors must acknowledge the real risk of policy error – either in the form of inflation expectations becoming imbedded or a deep recession.
We believe a yardstick worth monitoring is the path of inflation-adjusted – or real – interest rates. As mentioned, the real yield of the fed funds rate remains mired in negative territory. More progress is being made on longer-dated tenors. The real yield on the 2-year U.S. note has climbed to 1.78% and that of the 10-year has reached as high as 1.74% – its highest level since 2009.
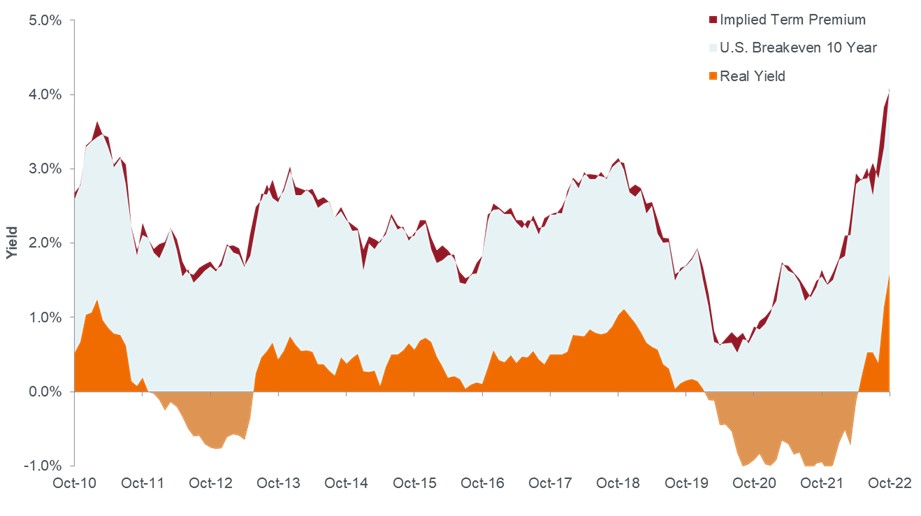
Source: Bloomberg, as of 31 October 2022.
This matters because real yields represent the economy’s true cost of capital. Their recent surge dampens the demand for big ticket items typically financed with credit. Among these are houses and automobiles on the consumer side and structures and equipment on the corporate side. In the third quarter, a slowdown in residential investment detracted 1.37 percentage points from the annualized 2.6% change in GDP.
We would expect the real yield on the 10-year note to roughly match expected annual real GDP growth over a 10-year period. This has not been the case in years, however, given the Fed’s outsized influence in fixed income markets. The rapid ascent of the 10-year real yield is a clear illustration that the era of hyper-accommodative monetary policy is behind us, but the remaining difference suggests that the Fed’s work may not be done.
Although a painful path, we believe the march toward higher real rates will benefit investors over the long term as shorter-duration, lower-risk securities can finally generate income. At the same time, riskier assets such as equities and corporate bonds can discover their own prices rather than being unduly influenced by artificially low discount rates and desperate investors reaching for yield.
IMPORTANT INFORMATION
Diversification neither assures a profit nor eliminates the risk of experiencing investment losses.
Inflation-linked bonds feature adjustments to principal based on inflation rates. They typically have lower yields than conventional fixed-rate bonds and decline in price when real interest rates rise.
10-Year Breakeven represents a measure of expected inflation derived from 10-Year Treasury Bond and 10-Year Treasury Inflation Protected Securities (TIPS).
Basis point (bp) equals 1/100 of a percentage point. 1 bp = 0.01%, 100 bps = 1%.
Bloomberg U.S. Aggregate Bond Index is a broad-based measure of the investment grade, US dollar-denominated, fixed-rate taxable bond market.
Consumer Price Index (CPI) is an unmanaged index representing the rate of inflation of the U.S. consumer prices as determined by the U.S. Department of Labor Statistics.
The discount rate is the interest rate charged to commercial banks and other depository institutions on loans they receive from their regional Federal Reserve Bank’s lending facility.
Forward price-to-earnings (forward P/E) Ratio uses forecasted earnings for the P/E calculation.
Gross Domestic Product (GDP) represents the value of goods sold over a specific time by countries.
An inverted yield curve occurs when short-term yields are higher than long-term yields.
Price-to-Earnings (P/E) Ratio measures share price compared to earnings per share for a stock or stocks in a portfolio.
Purchasing Managers Index (PMI) measures economic activity represented by a survey of purchasing managers at manufacturing firms and is a gauge of the state of the economy.
S&P 500® Index reflects U.S. large-cap equity performance and represents broad U.S. equity market performance.
Term premium represents the compensation that investors require for bearing the risk that interest rates may change over the life of the bond.
A yield curve plots the yields (interest rate) of bonds with equal credit quality but differing maturity dates. Typically bonds with longer maturities have higher yields.
Sign up for timely perspectives delivered to your inbox.