Subscribe
Sign up for timely perspectives delivered to your inbox.
The Global Property Equities Team questions and examines the dispersion in returns between private and public real estate, which strengthens the case for listed property.


2022 has thus far been a brutal year for investors in just about every corner of the public capital markets be it debt, equity, or real estate investment trusts (REITs) with year-to-date total returns to 30 September (US markets) of approximately -15%, -24%, and -28% respectively.1 Persistently high inflation, a dramatic shift in central bank monetary policy, and increasing probability of recession are largely to blame for weak investor sentiment and disappointing returns.
However, private property managers seem to be operating above the fray and impervious to current headwinds, reporting strong returns of 9-13% thus far.2 An astute observer might ask, how is this returns dispersion between public (listed) and private real estate possible?
One potential explanation for the dispersion in public versus private real estate returns could be a difference in underlying asset exposure either by geography, asset quality, or property type. Very little collective data on private real estate is publicly available. That’s why it is difficult to draw conclusions when it comes to the quality characteristics of private assets. But we do know that listed REITs typically own high quality assets concentrated in major population centres and agree with a recent statement in the Journal of Portfolio Management that “REITs generally engage in low-risk core real estate investment strategies focused on high-quality stabilised properties.” 3
Our experience in real estate markets tells us that most public or private market participants would agree that listed REITs on average, own higher-quality assets than their private counterparts. Given their transparent and detailed quarterly reporting, we can also observe that listed REITs continue to have strong operating fundamentals. In fact, Q2 2022 was the strongest quarter of reported results compared to expectations in 15 years according to Citi Research.4
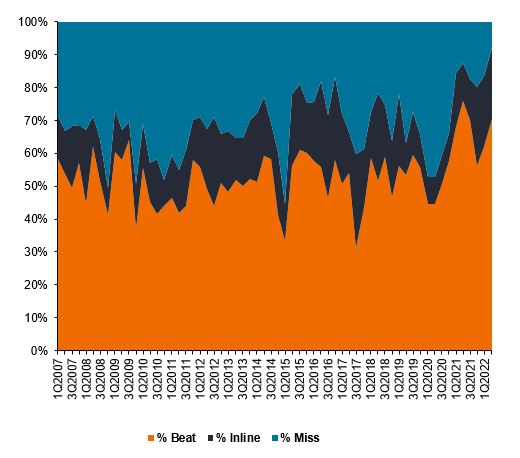
Source: Citi Research: Weekly REIT and Lodging Strategy, 12 August 2022. Past performance does not predict future returns.
In terms of property type exposure, there are some observable differences between public and private real estate as shown in figure 2. Private core funds are nearly 50% allocated to office and retail which are traditional core property types experiencing long-term structural headwinds associated with new approaches to working from home and the proliferation of ecommerce. Public real estate on the other hand, offers specialist property types such as manufactured housing, self-storage, life science offices, and tech real estate, that are being driven by powerful, secular long-term trends such as demographics, digitalisation, convenience lifestyle and sustainability. These differences appear to once again favour listed REITs.
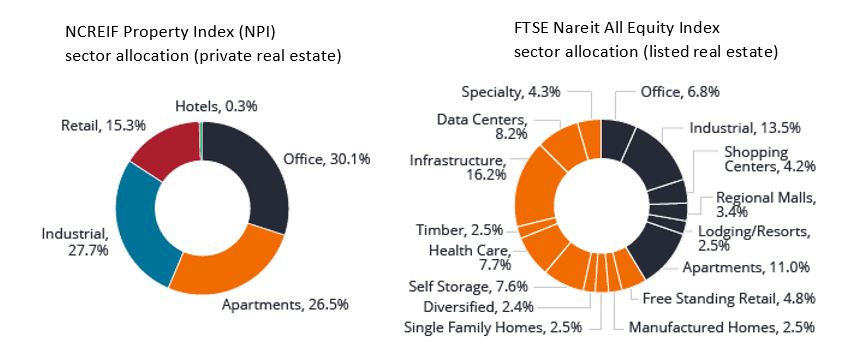
Source: NCREIF, FTSE as at 31 December 2021.
Perhaps listed REITs operate with higher leverage and riskier balance sheets than private managers, and in a world of rising rates that is an explanation for the vast gulf in year-to-date performance? Once again, this argument doesn’t hold water. US listed REITs currently employ around 30% leverage (the ratio of debt to total assets) and only circa 17% of this debt is tied to floating rates.5 In contrast, private real estate managers may use up to 60-70% leverage6 and can have more than 50% floating rate debt.7
So, if we accept that listed REITs’ property quality and fundamentals are at least ‘on par’ with private real estate, and that listed REIT property type exposure is at least as favorable as private real estate, and that listed REIT balance sheets are less risky than private real estate, again, how can we explain a gap in reported year-to-date returns of over 30%?8
We believe what we are witnessing is a real time, very extreme, example of private valuation lag. Listed REITs are traded daily, as such they tend to ‘price in’ new information like higher interest rates and recession risk in a matter of days or weeks. In contrast, there is no third-party market for private real estate funds, and the managers of these funds instead rely on appraisals and desktop analysis to report a valuation to their investors on a monthly or quarterly basis.
When considering the timeliness of private real estate valuations, there are some important nuances to understand:
We believe private real estate valuation methodology is designed to move slowly and smooth reported returns rather than to express the most current ‘on the ground’ values. It can take 18 months or longer for changes in market conditions to become fully reflected in reported private real estate valuations, as expressed in the hypothetical illustration (figure 3).

Source: Janus Henderson Investors analysis. For illustrative purposes only. CRE= commercial real estate, PE= private real estate.
To put the current situation in context, we believe it is informative to look at the discount to Net Asset Value (NAV). NAV is a proxy for private market real estate value at which listed REITs currently trade. Over the long term, listed REITs have traded in line with the private market value of their assets (historically 0.7% discount on average), according to analysis from Green Street Advisors. As at 30 September, listed REITs traded at a 28% discount to NAV. This is a rare occurrence and discounts of this level or greater are statistically expected to occur less than 1% of the time (see figure 4).
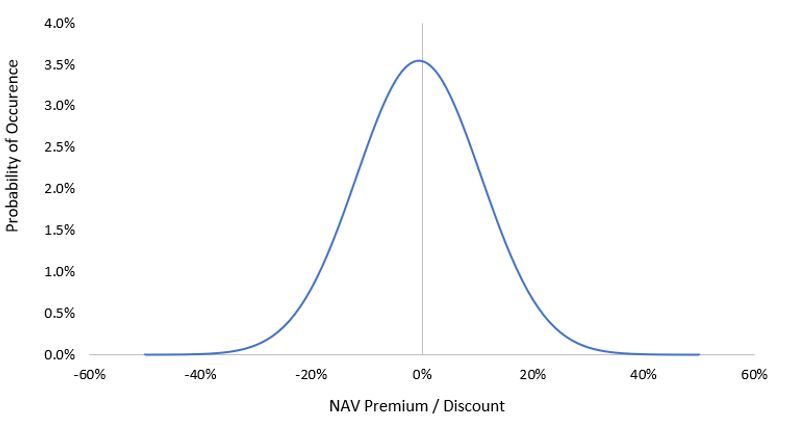
Source: Green Street Advisors, Janus Henderson Investors analysis. NAV premium/discount, equal weighted, monthly data from November 2007 to September 2022.
In closing, we think it is worth pointing out that we’ve been here before. Figure 5 shows the performance of public versus private real estate holdings as reported by more than 200 US public plans. 2008, as many will remember, was another very challenging year for financial markets. In that year, listed REITs posted a 38% decline against only an 8% reported decline for private real estate. The valuation lag caught up to private real estate funds in 2009; these funds were still in the process of rolling in valuation changes of the prior year and reported an almost -30% return. By contrast, listed REITs, having already been repriced by the equity market in the prior year, posted a circa +30% return in 2009 as the listed market looked forward to a recovery. While history never repeats, it often rhymes. Nothing is ‘broken’ about listed REITs today, and private real estate doesn’t exist in its own separate world. We are certain the same assets can’t have such vastly different prices forever.
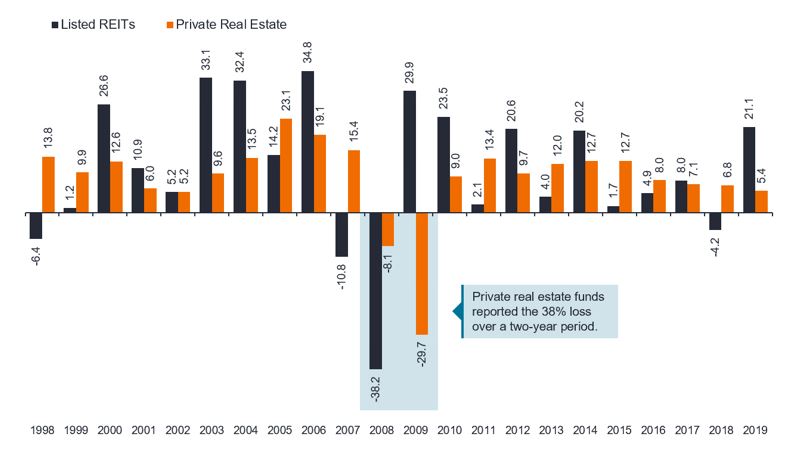
Source: CEM Benchmarking Report, Janus Henderson Investors analysis, as at 31 December 2019. Alexander D. Beath, Ph.D. & Chris Flynn, CFA. “Asset Allocation and Fund Performance of Defined Benefit Pension Funds in the United States, 1998-2019.” Past performance does not predict future returns.
1 Bloomberg Barclays US Aggregate Total Return Unhedged USD, S&P 500 Index, FTSE NAREIT Equity REITs Index. 31 December 2021 to 30 September 2022.
2 B-REIT (Blackstone Real Estate Income Trust), the largest private/non-traded REIT with $70bn in AUM, YTD return through 31 August 2022, https://www.breit.com/performance/, NCREIF ODCE Index via Bloomberg, YTD return through 30 June 2022. Both returns represent most recent available data.
3 Thomas R Arnold, David C Ling, Andy Naranjo. “Private Equity Real Estate Fund Performance: A Comparison to REITs and Open-End Core Funds.” The Journal of Portfolio Management Special Real Estate Issue 2021, October 2021.
4 Citi Research: Weekly REIT and Lodging Strategy, 12 August 2022.
5 Citi Research: Viewpoint, theHunter Express & Lodging Valuation Tool, 19 September 2022.
6 Thomas R Arnold, David C Ling, Andy Naranjo. “Private Equity Real Estate Fund Performance: A Comparison to REITs and Open-End Core Funds.” The Journal of Portfolio Management Special Real Estate Issue 2021, October 2021.
7 Based on August 2022 prospectuses for non-listed REITs: B-REIT (Blackstone Real Estate Income Trust) and S-REIT (Starwood Real Estate Income Trust).
8FTSE NAREIT All Equity REITs Index vs NCREIF ODCE Index as at 27 September 2022 and B-REIT most recent reported valuations.
Balance sheet: a financial statement that summarises a company’s assets, liabilities and shareholders’ equity at a particular point in time. Used as an indicator of a company’s financial health.
Leverage: in the context of this article we refer to the amount of debt that a REIT carries. The leverage ratio is measured as the ratio of debt to total assets.
Discount to NAV occurs when the REIT’s market price is lower than the most recent NAV. A discount often indicates the market is generally bearish on the investments in the portfolio. Net Asset Value is the value of the portfolio’s assets at market close, minus liabilities, divided by the total number of shares outstanding. Conversely, premium to NAV occurs when the REIT’s market price is above NAV and is driven by the market’s bullish outlook on the investments in the portfolio, hence the willingness to pay a ‘premium’.
Monetary policy: policies of a central bank, aimed at influencing the level of inflation and growth in an economy. It includes controlling interest rates and the supply of money.
Notes:
REITs or Real Estate Investment Trusts are an investment vehicle that invests in real estate, through direct ownership of property assets, property shares or mortgages. As they are listed on a stock exchange, REITs are usually highly liquid and trade like a normal share.
Real estate securities, including Real Estate Investment Trusts (REITs) may be subject to additional risks, including interest rate, management, tax, economic, environmental and concentration risks.
Foreign securities are subject to additional risks including currency fluctuations, political and economic uncertainty, increased volatility, lower liquidity, and differing financial and information reporting standards, all of which are magnified in emerging markets.
FTSE Nareit Equity REITs Index (FNRE) contains all equity REITs not designated as timber REITs or infrastructure REITs. The FTSE Nareit US Real Estate Index Series is designed to present investors with a comprehensive family of REIT performance indexes that spans the commercial real estate space across the US economy.
Bloomberg US Aggregate Bond Index (LBUSTRUU) is a broad-based measure of the investment grade, US dollar-denominated, fixed-rate taxable bond market.
S&P500® Index (SPX) reflects US large-cap equity performance and represents broad US equity market performance.
The NCREIF Property Index (NPI) is the primary index used by institutional investors in the US to analyse the performance of commercial real estate and is used as a benchmark for actively-managed real estate portfolios.
FTSE Nareit All Equity REITs Index (FNER) tracks the performance of the US real estate investment trust (REIT) market.
Sign up for timely perspectives delivered to your inbox.