
Subscribe
Sign up for timely perspectives delivered to your inbox.
Portfolio Manager Aneet Chachra looks at patterns for stocks and bonds over the fourth quarter as well as the past impact of U.S. elections.


At the end of the second quarter, we published a note – Halftime – highlighting how a negative first half for equities was usually followed by high volatility over the second half of the year.
The third quarter was indeed a roller coaster ride for stocks, which rallied sharply into mid-August before falling back. The S&P 500® index returned -4.9% over the quarter. The index is currently down -23.9% year to date, which is the worst performance for the first nine months of the year since 2002.
Bonds were also dismal. The U.S. 10-year Treasury posted a negative total return for the third consecutive quarter, declining -6.1% in Q3 for a year-to-date loss of -16.8%. This is the worst bond return for any 9-month rolling period ever.1
It’s broadly known that stocks have historically enjoyed higher average returns (a phenomenon known as “the Santa rally”) during the fourth quarter. Exhibit 1 illustrates average S&P returns by quarter along with their standard deviation. Q4 is indeed the statistically best quarter, although equity markets inherently have a wide range of outcomes.
Exhibit 1: S&P 500 quarterly returns & standard deviation
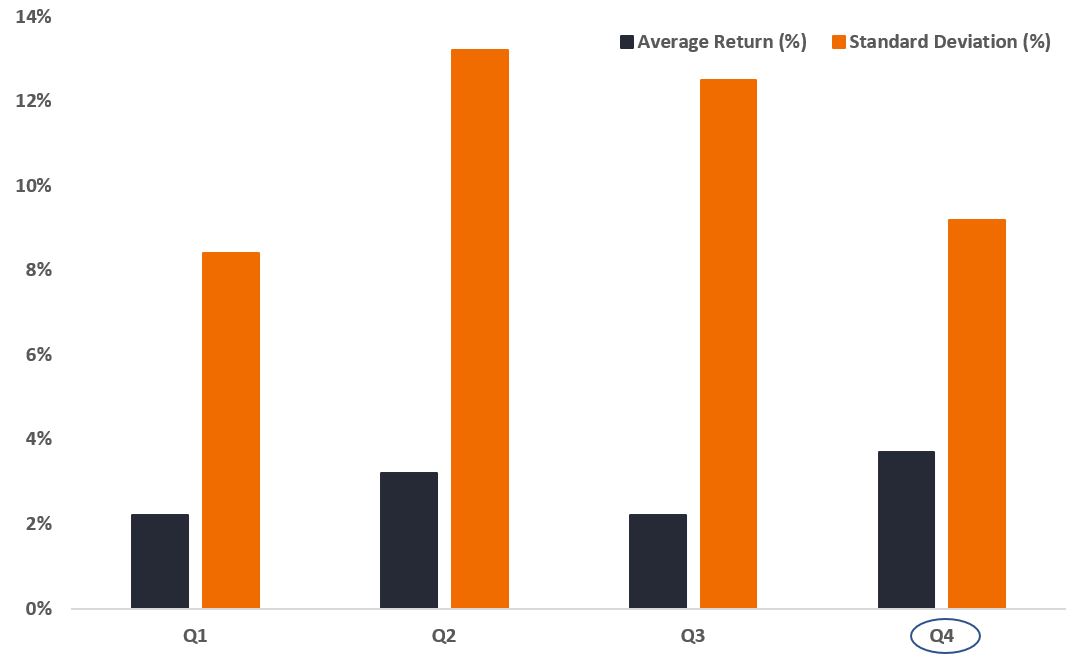
Source: Bloomberg, as of 30 September 2022. S&P 500 Index total return series from January 1928 to September 2022 (Q4 data to December 2021), no transaction costs. Past performance does not predict future returns.
However, it’s much less known that Q4 has historically been the best quarter for bonds, too. Exhibit 2 illustrates quarterly average return for the S&P 500, U.S. 10-year Treasuries, and a 60/40 stock/bond blend. The fourth quarter is the highest returning for all of them.
Exhibit 2: S&P 500, U.S. 10-year Treasury, 60/40 blend quarterly returns
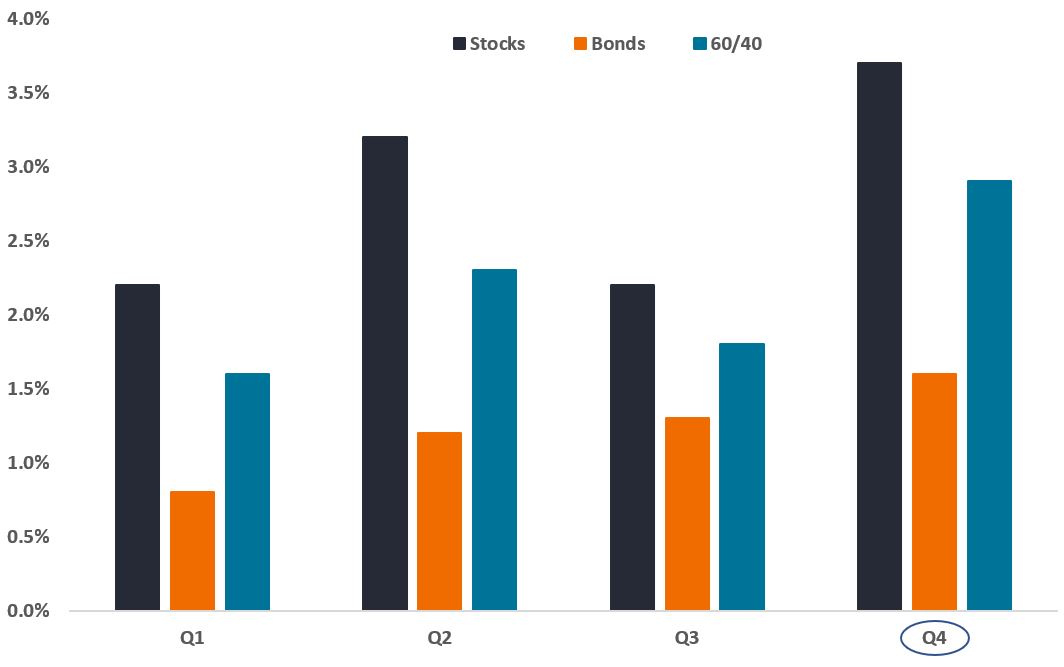
Source: Bloomberg, FTSE, Citigroup, Ibbotson, FRED, as of 30 September 2022. Stocks represented by S&P 500 Index, bonds represented by U.S. 10-year Treasuries, 60/40 is blend of 60% stocks, 40% bonds. S&P 500 Index total return series from January 1928 to September 2022, U.S. 10-year Treasury total return series, no transaction costs. Past performance does not predict future returns.
Specifically, in the U.S., the fourth quarter not only contains holidays (Thanksgiving and Christmas) but also incorporates a major national election in even-numbered years. Presidential elections are held in years divisible by four, while midterm elections to choose every member of the House of Representatives and one-third of the Senate are held halfway through each Presidential term.
Accordingly, there have been 47 election years since 1928 comprised of 24 Presidential election years and 23 midterm election years. Fourth-quarter performance for the S&P 500 during election years has historically been different than non-election years. Even within election years, Presidential and midterm years show a sharp divergence in average Q4 returns.
Exhibit 3 illustrates S&P 500 Q4 returns for all, non-election, election, Presidential-only, and midterm-only years. Notably, midterm election years have had, on average, the best fourth quarters.
Exhibit 3: S&P 500 Q4 returns grouped by U.S. election status
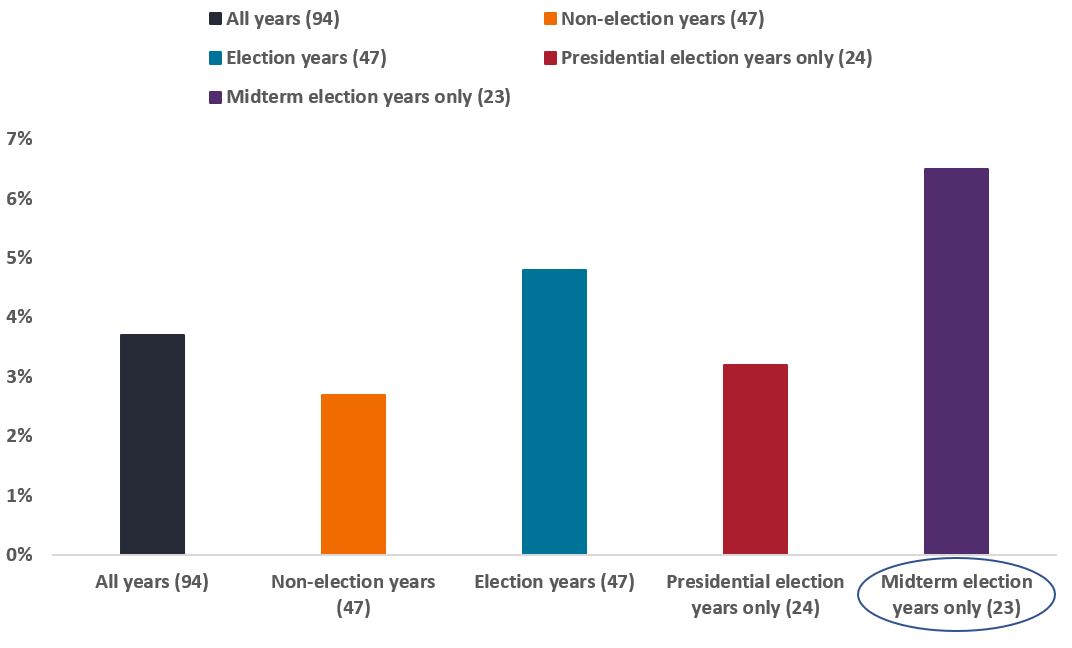
Source: Bloomberg, as of 30 September 2022. S&P 500 Index total return series from January 1928 to September 2022 (Q4 data to December 2021), no transaction costs. Past performance does not predict future returns.
Why have stocks outperformed in Q4 of midterm election years? There are two popular theories. The first theory is event risk premia, which postulates that ahead of a midterm (or any) election, there is some reluctance among investors to increase risk allocation given uncertainty about results. However, once the event passes, this ambiguity is resolved, creating a rush to allocate – particularly ahead of year-end tax and other deadlines.
The second theory is specific to midterm elections. Midterms usually result in the President’s party losing seats in Congress. Paradoxically, a divided government and “gridlock” is often favorable for equities by reducing the likelihood of major policy changes.
Additionally, given the small sample size and wide variance, return differences could be due to randomness. We analyzed two cases – election vs non-election years and Presidential vs midterm years. For both, the studied groups were not statistically different at the 5% significance threshold, and thus we cannot reject the possibility that the return differences are purely attributable to chance. Instead, we determined the confidence level for both cases was about 90%, which suggests they are different, but is not conclusive.
Importantly, even if election or midterm years usually have above-average Q4s, the result in any given year is quite variable. For example, in 2008 (an election year), the S&P returned -19% between Q1-Q3 before dropping a further -22% during Q4.
Despite the 2008 experience, aggregated data indicates that we are entering a seasonally favorable period for both stocks and bonds, and this effect is historically larger in midterm election years (like 2022). Broadly, this could suggest a more constructive stance toward major asset classes within a diversified portfolio, while still maintaining hedges to protect against large adverse outcomes.
1 Per bond data series from 1928 onward.
Risk premia refers to the amount by which the return of a risky asset is expected to outperform the known return on a risk-free asset.
S&P 500® Index reflects U.S. large-cap equity performance and represents broad U.S. equity market performance.
Standard Deviation measures historical volatility. Higher standard deviation implies greater volatility.
IMPORTANT INFORMATION
Investing involves market risk; principal loss is possible. Equity and fixed income securities are subject to various risks including, but not limited to, market risk, credit risk and interest rate risk.
Diversification neither assures a profit nor eliminates the risk of experiencing investment losses.
U.S. Treasury securities are direct debt obligations issued by the U.S. Government. With government bonds, the investor is a creditor of the government. Treasury Bills and U.S. Government Bonds are guaranteed by the full faith and credit of the United States government, are generally considered to be free of credit risk and typically carry lower yields than other securities.

Sign up for timely perspectives delivered to your inbox.