

Subscribe
Sign up for timely perspectives delivered to your inbox.
While larger companies have been the driver of stronger UK equity returns, portfolio manager Laura Foll believes opportunities can also be found in the smid-cap area.


It’s been a challenging year for global equity markets. Investors have faced, and continue to face a laundry list of concerns, including the war in Ukraine, surging inflation, the threat of central bank monetary tightening in the face of slowing global growth, and the impact of COVID-19 lockdowns in China on global supply chains. Meanwhile, consumers are grappling with a cost-of-living crisis.
Underneath the surface, regions, sectors, and businesses have all been impacted and performed differently, with some more resilient than others. While the UK market too has faced its fair share of challenges over recent years, of late it has experienced something of a renaissance. The FTSE 100 (+1.5%) of large capitalised companies, in particular, has been relatively resilient, outperforming indices such as the S&P 500 (-2.4%), and Eurostoxx 50 (-12.1%) year-to-date.* Most of this outperformance can be attributed to the FTSE’s make up of sectors and large businesses that have benefited from higher commodity prices, general risk-off sentiment, and the prospect of higher interest rates.
While such a turnaround in performance is a welcome relief to many investors, the focus has primarily been on larger businesses. We believe the UK market potentially has more to offer.
UK equities are trading at around their cheapest relative to the MSCI World in more than 25 years (see chart below). The combination of Brexit and the COVID-19 pandemic resulted in investors looking elsewhere for opportunities, leaving the UK market significantly undervalued. This created a fertile environment for skilled stock pickers to find high-quality companies at attractive valuations.
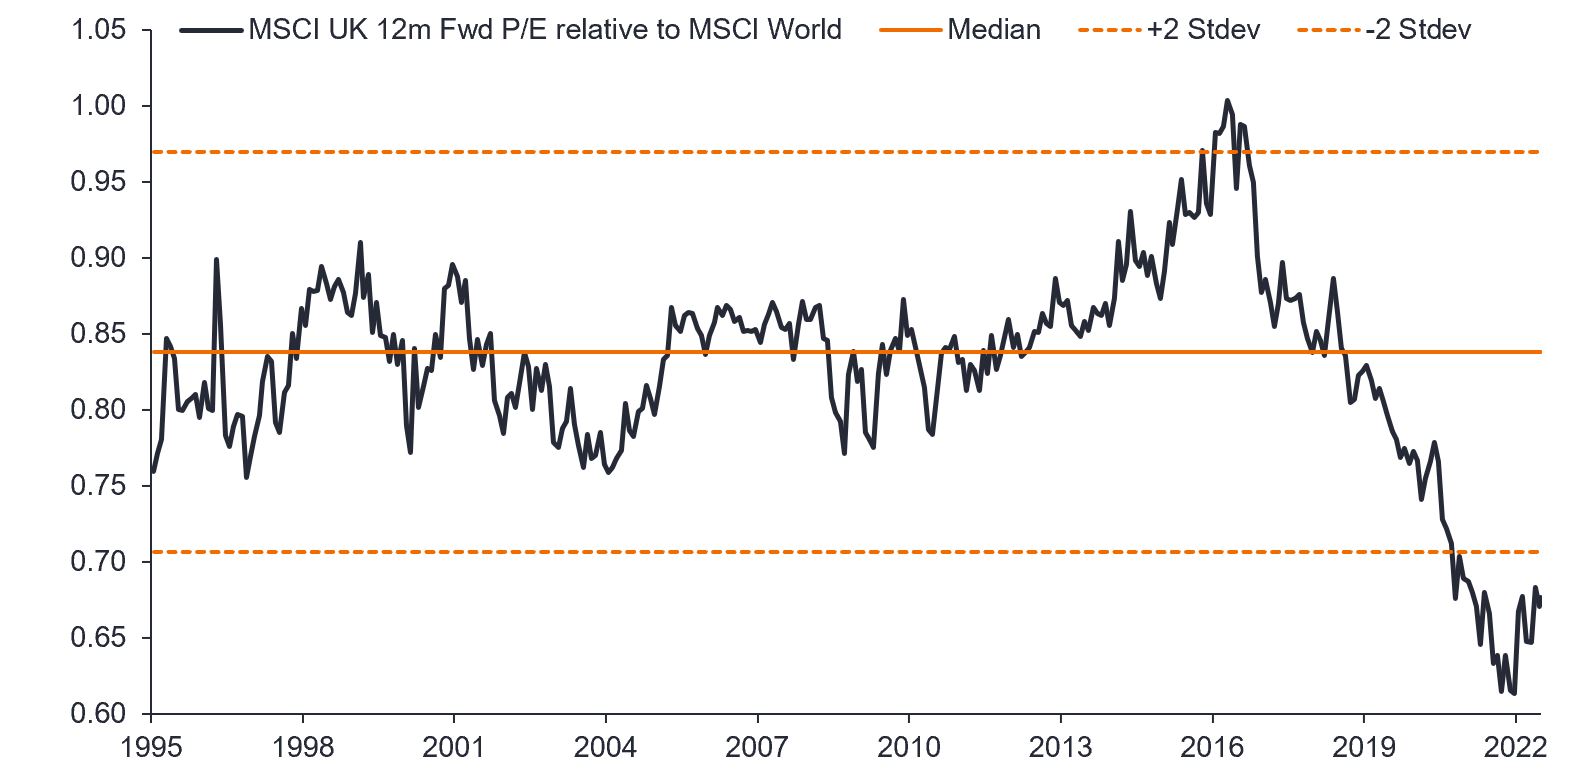
Source: JPMorgan, Janus Henderson Investors analysis, as at 1 July 2022. Standard deviation measures the variation or dispersion of a set of values/data. A low standard deviation shows the values tend to be close to the mean while a high standard deviation indicates the values are more spread out. In terms of valuing investments, standard deviation can provide a gauge of the historical risk (volatility) of an investment.
While large UK companies appear cheap relative to global peers, smaller businesses are cheaper still. The smaller-to-mid cap (smid) space is a source of investment opportunities. Often overlooked for dividends, there are many market-leading, well-managed businesses within this area that can provide a differentiated source of income. Although some of these businesses might not be household names, their products and services are widely used throughout the country.
We are not the only ones recognising value within the UK market, which has experienced heightened takeover activity in recent years. For example, RSA Insurance Group was bought by Canadian insurer Intact Financial Group and Danish insurer, Tryg while St Modwen Properties was acquired by Blackstone. We have also seen financial publisher Euromoney Institutional Investor accept a private equity takeover, and UK-listed chemicals company Elementis receive several bids.
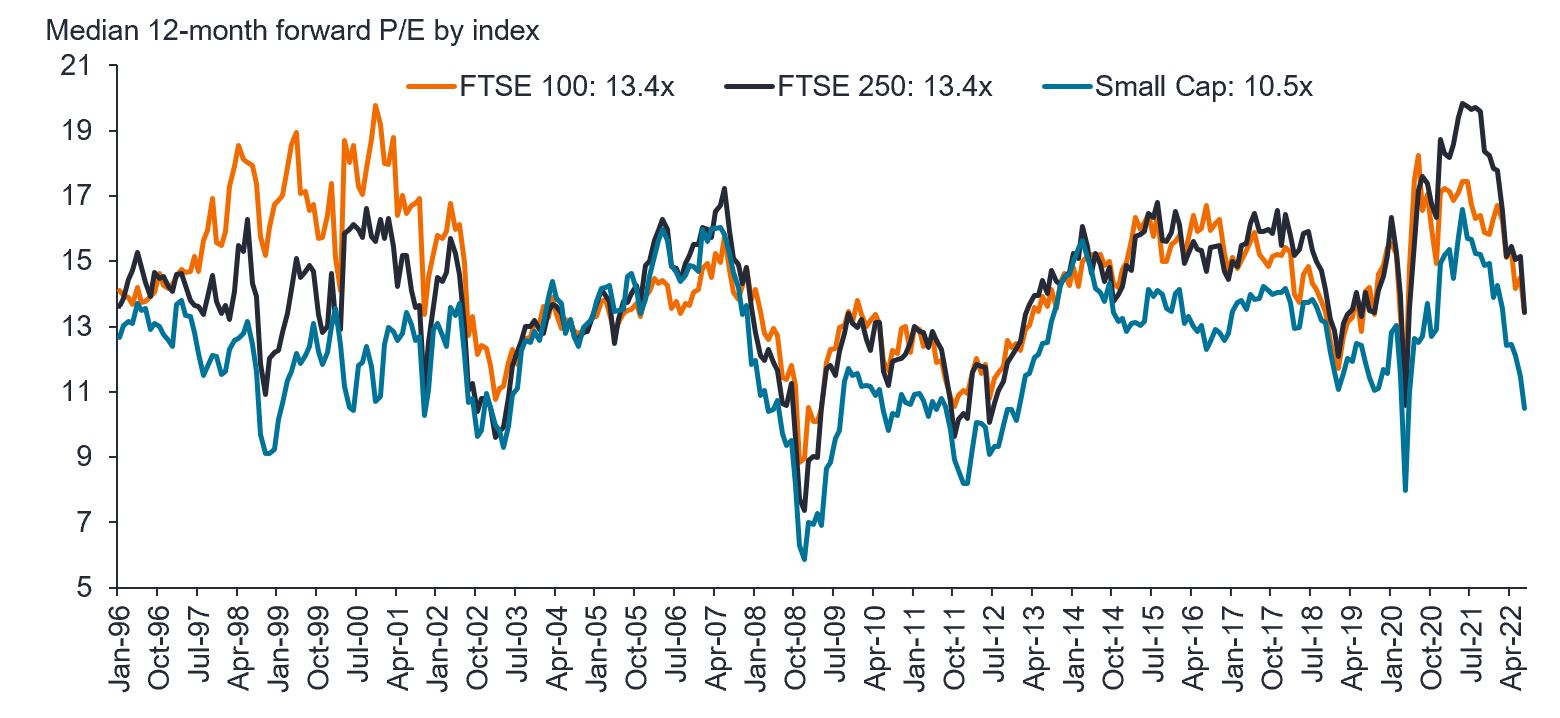
Source: Liberum, Refinitiv Datastream, Janus Henderson Investors analysis, as at 1 July 2022. The price-to-earnings (P/E) ratio is calculated by dividing the market value of a company by earnings per share. 12-month forward P/E is calculated using the expected earnings of a share over the next 12 months and represents market expectations for a company’s growth prospects.
Year-to-date, it should be no surprise why smaller and medium-sized businesses have struggled. During periods of uncertainty, smaller companies on average have always been impacted the hardest because they are more cyclical, ie. sensitive to changes in the economy and domestic in their exposure. This year has been no different. However, we believe that over the longer term these companies have greater potential for sales and earnings growth, as they are at an earlier stage of their life cycle with a longer pathway of growth ahead of them. In the meantime, investors can collect the dividends these companies are paying while waiting for the share price to rebound.
Global growth will likely slow in the second half of the year as higher food, energy and other input prices weigh on consumers and businesses. In this backdrop, it is more important than ever to identify companies with defendable barriers to entry, strong cash flows, solid balance sheets (indicating financial strength) and talented company management that can navigate this tricky market environment.
*Source: Bloomberg, as at 15 September 2022. Index total returns in GBP terms. Past performance does not predict future returns.
Sign up for timely perspectives delivered to your inbox.