
Subscribe
Sign up for timely perspectives delivered to your inbox.
Portfolio Managers Jason England and Daniel Siluk explain why investors seeking income generation, diversification, and lower levels of volatility should consider shorter-dated bonds in this uncertain economic environment.


For much of this year, as inflation accelerated and central banks were forced into a policy pivot, we have asked the questions: Has global economic environment reached peak uncertainty, and has monetary policy reached peak hawkishness? That we even have to ask these is discomforting for fixed income investors. With respect to the former, the breadth of variables currently roiling the global economy – high inflation, lingering pandemic-related supply-chain dislocations, labor shortages, and a war in Ukraine – has widened the range of potential outcomes that investors must consider. As for monetary policy, we believe the market may still be underestimating the challenge of bringing inflation down toward more palatable levels. At 8.3%, annual U.S. headline inflation is still 3.1 percentage points above the yearly gain in hourly wages. This translates to negative real wage growth for American households and is likely an impetus behind the Federal Reserve’s (Fed) increasing focus on the price stability component of its dual mandate.
On the surface, none of this appears to bode well for bonds. Yet the repricing of markets, in our view, has increased the asset class’s capability of fulfilling its core tenets of generating income and providing diversification to riskier assets – characteristics that have been lacking during much of the post-Global Financial Crisis (GFC) and pandemic eras. Driving the shift has been this year’s rise in yields. In the decade through December 2019, the yield on the Bloomberg U.S. Aggregate Bond Index (Agg) averaged 2.5%. In the ensuing two years, which roughly aligns with the depths of the pandemic, this measure fell to 1.5%. Currently, the index yields 4.3%. Yields on global bond benchmarks follow a similar trajectory.
These more favorable levels, however, are not distributed across maturities in a manner that we would characterize as normal – inverted U.S. and Canadian yield curves are evidence of that. Consequently, we believe that the combination of flat-to-negative yield curves, along with elevated economic uncertainty, supports an overweight higher-quality, shorter-dated securities at the expense of the longer-dated bonds that we believe remain vulnerable to additional bouts of volatility.
While higher yields are welcomed by income-seeking investors, the path was anything but enjoyable. The first half of 2022 ranked as one of the worst six-month periods for bond returns. Longer-dated securities were first to sell off as investors feared central banks would again fall behind the curve with respect to managing inflation. Once policy makers turned hawkish, the front end of the yield curve came under pressure as rate hikes became imminent.
Ultimately, the long end of the curve bore the brunt of the damage as these securities are more susceptible to the swings in inflation and interest rate expectations that have defined the year. As seen in Figure 1, although there was no place to hide, shorter-dated securities – especially in the U.S. – have registered single-digit losses, year to date. Aggregate indices, especially longer-dated benchmarks, incurred drawdowns of roughly 10% or greater.
Figure 1: Bond indices’ year-to-date total return and change in yield
Shorter-dated bonds have proven more resilient during 2022’s bond sell-off, and we would expect this trend to continue given the largest moves in front-end rates are likely behind us.
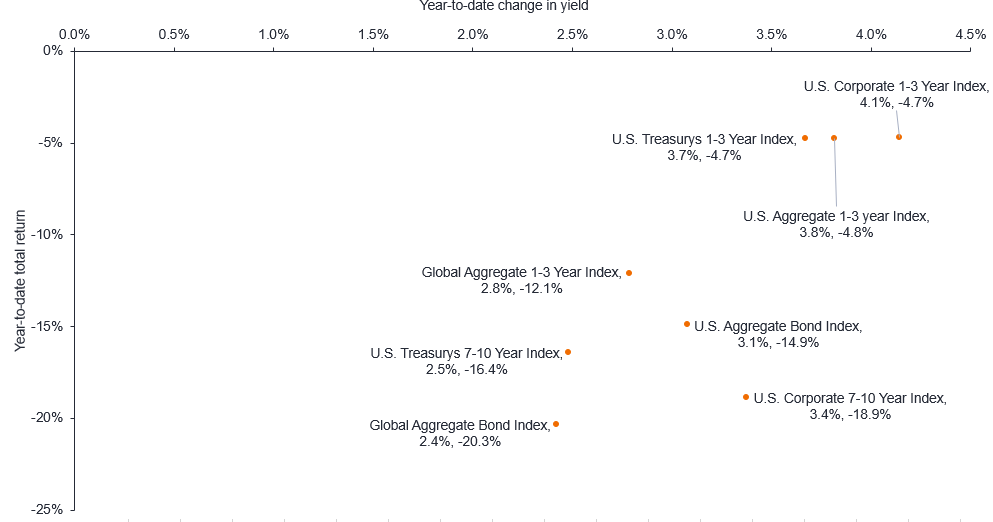
Source: Bloomberg indices. Bloomberg, as of 26 September 2022.
The question is what to do now? We don’t think the volatility is behind us, and slowly the market is coalescing around our view – a development evidenced by increases in both options-based expected Treasury market volatility and late-year rate hike forecasts, which had – inexplicably, in our view – slipped in July. Despite these headwinds, we believe the resetting of yields represents a potential game changer in how investors should approach their bond allocation and stands to break the trend of meager income generation – or carry – that has characterized much of the post-GFC era. Changes are most evident on the front end of the yield curve. Year to date through September 19, the yield on 2-year U.S. Treasury notes has climbed 3.21 percentage points to 3.94%. Canadian and Australian 2-year yields have climbed 2.85 and 2.57 percentage points, respectively, with the former yielding well above 3.50%. Perhaps most notable is Germany’s 2-year yield rising from deep within negative territory to over 1.60%.
Figure 2: Bond market volatility and futures market projections for rate hikes
Volatility continues to march higher, and we believe this will continue, driven mainly by a host of outcomes that could influence the trajectory of inflation and longer-dated rates.
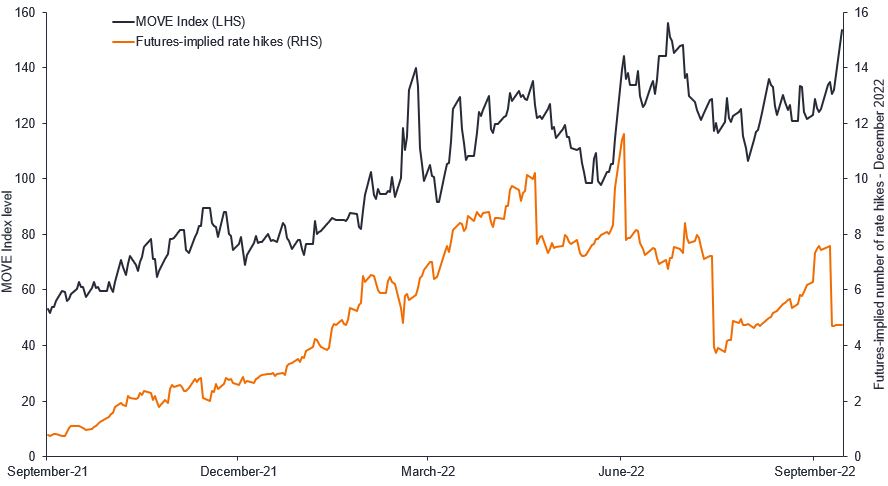
Source: Bloomberg, as of 26 September 2022.
Higher yields increase the potential for capital appreciation. A decade of central banks playing a major role in bond markets kept prices high. This had the consequence of limiting the asset class’s ability to provide diversification to riskier assets. Now, higher yields on typically “lower-risk” segments of the bond market means these securities could again benefit from a flight to safety in the event of another economic shock or equities sell-off.
The positive correlations between stocks and bonds in recent years, in our view, distorted investor behavior. A chief culprit was central banks’ propensity to implement a de facto put to support asset prices any time volatility became elevated. Investors largely got away with being lazy long both bonds and riskier assets. Recent Fed inaction, however, indicates the days of reflexively supporting markets is over. “Diversification” should accordingly return to the investor lexicon as the resetting of yields to levels well above what had come to be accepted translates to a potential lifeline in the form of price gains and, thus, lower correlations among asset classes.
While higher levels of carry and diversification have returned, another key characteristic of bonds – low volatility – has not. No investor wants to relive the first half of 2022. Additional price swings, however, cannot be ruled out given the presence of a host of variables that make the global economy’s near- to mid-term path difficult to predict. We believe inflation will be tougher to tame than expected, especially in regions where upward wage pressures have already taken hold and those acutely impacted by supply dislocations. With inflation at multi-decade highs, central banks have little choice but to raise rates into an already slowing global economy, with the European Central Bank’s recent 75 basis point (bps) move the latest example. These actions increase the likelihood of a stagflationary environment where growth slows to near recessionary levels while inflation continues to persist.
Magnifying the risks for investors is central banks’ newfound tolerance for financial markets to register bear-market level drawdowns. The lower levels of economic activity associated with stagflation would put pressure on both equities and riskier corporate credits as operating margins and debt coverage ratios are squeezed. Meanwhile, the tension between slower economic growth and lingering inflation would likely make the trajectory of longer-dated sovereign bonds even more unclear. With such uncertainty we should expect additional volatility.
We consider financial market conditions unfavorable, not untenable. A cautious stance is merited. In determining how to fortify one’s fixed income allocation, two factors loom large: The worryingly high range of potential economic outcomes and the shape of the yield curve. Globally, inflation is expected to average 4.6% in 2023. In the U.S. it could clock in at 3.7% and the UK could see a very unsettling 6.6%.1 With rate increases typically having a lagging effect, these estimates may represent high water marks as this year’s batch of hikes begin to bite. But should the wage-price spiral take hold or supply chains remain impaired, inflation – and bond yields – could again be on the move.
With yield curves flat to inverted in many jurisdictions, this uncertainty diminishes the risk/reward trade-off of longer-dated bonds. As illustrated in Figure 3, it would only take a 78 bps rise in rates to eliminate a year’s worth of income for the Agg. For shorter-dated Treasuries and corporates, it would take increases of 234 bps and 274 bps, respectively, to do the same. Behind this is the years-long mismatch between duration and yield that has stymied investors. Even after climbing in 2022, the Agg currently yields just under 5.0.%. The price of that yield is holding a still elevated 6.2 years of duration. For the Bloomberg U.S. Aggregate 1-3 Year Index, a very similar 4.7% yield commands just 1.9 years of duration.
Figure 3: Income/loss “breakevens” on bond market segments
A years-long mismatch between a bond’s yield and interest rate risk has resulted in shorter-dated securities being able to better absorb another uptick in rates.
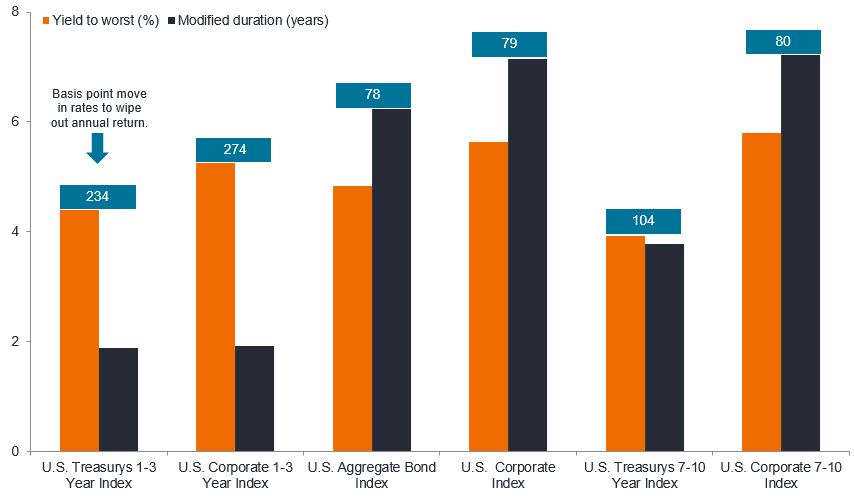
Source: Bloomberg indices. Bloomberg, as of 26 September 2022.
Importantly, while sticky inflation could result in more rate hikes than are already priced into bonds, the upward move in front-end yields would be nowhere near the magnitude of this year’s rise when they lifted off the zero-bound. Should inflation become imbedded in consumers’ psyches, however, longer-dated securities could experience another material sell-off. Conversely, should slowing demand temper inflation’s advance, we would envision a pause in hikes – with front-end rates at more attractive levels – and even the possibility of rate cuts in jurisdictions facing deep recession.
In this sense, our escalator metaphor requires another iteration. All countries rode the same policy elevator down during the pandemic. Staggered reopenings led to them taking different escalators up. In inflation’s wake, based on idiosyncratic factors, some will board the down escalator while others keep going up but at a slower pace, and still others may hop off and wait. We believe this presents investors with an opportunity to capitalize on policy dispersion by selecting markets – and segments of the curve – that generate attractive carry, offer the potential for diversification through price appreciation, and exhibit the more modest levels of volatility that fixed income investors expect. By each of these barometers, shorter-dated securities appear well positioned.
[jh_content_filter spoke=”apac-social, arpa, auii, aupi, axii, bepa, brpa, clpa, cnpi-en, copa, deii, dkii, dkpa, dkpi, fiii, fipa, hkpi-en, iepa, iepi, lupa, lupi, media, mxpa, nlii, noii, nopa, nopi, pepa, ptpa, seii, sepa, sepi, sgpi, social, ukii, ukpa, ukpi, uopa, usii, uspa, uspi, uypa, zapa”]
[/jh_content_filter]
1 Source: Bloomberg consensus estimates, as of 9 September 2022.
Basis point (bp) equals 1/100 of a percentage point. 1 bp = 0.01%, 100 bps = 1%.
Bear-market: A financial market in which the prices of securities are falling. A generally accepted definition is a fall of 20% or more in an index over at least a two-month period. The opposite of a bull market.
Bloomberg Global Aggregate Bond Index: A broad-based measure of the global investment-grade, fixed-rate debt markets.
Bloomberg U.S. Aggregate Bond Index: A broad-based measure of the investment grade, U.S. dollar-denominated, fixed-rate taxable bond market.
Bloomberg U.S. Corporate 1-3 Year Index: A measure of U.S. dollar denominated, investment-grade, fixed rate, taxable corporate bonds with maturities between 1 and 3 years.
Bloomberg U.S. Corporate 7-10 Year Index: A measure of U.S. dollar denominated, investment-grade, fixed rate, taxable corporate bonds with maturities between 7 and 9.999 years.
Bloomberg U.S. Corporate Bond Index: Measures the investment grade, fixed-rate, taxable corporate bond market.
Bloomberg U.S. Treasury 1-3 Year Index: A measure of nominal U.S. Treasury securities with maturities ranging from 1 to 2.999 years.
Bloomberg U.S. Treasury 7-10 Year Index: Measures U.S. dollar-denominated, fixed-rate, nominal debt issued by the U.S. Treasury with maturities of 7 to 9.9999 years to maturity.
Central bank put: The market belief that major central banks would step in and implement policies to limit the stock market’s decline beyond a certain threshold.
Correlation measures the degree to which two variables move in relation to each other. A value of 1.0 implies movement in parallel, -1.0 implies movement in opposite directions, and 0.0 implies no relationship.
Debt coverage ratio: A measurement of a firm’s available cash flow to pay current debt obligations.
Duration: Measurement of a bond price’s sensitivity to changes in interest rates. The longer a bond’s duration, the higher its sensitivity to changes in interest rates and vice versa. Modified Duration expresses the change in the value of a security due to a change in interest rates. It illustrates the effect of a 100 basis point (1%) change in interest rates on the price of a bond.
The Fed, or Federal Reserve, is the central banking system of the United States.
Hawkish is indication that policy makers are looking to tighten financial conditions, for example, by supporting higher interest rates to curb inflation.
Headline inflation is the raw inflation figure reported through the Consumer Price Index (CPI). The CPI calculates the cost to purchase a fixed basket of goods to determine how much inflation is occurring in the broad economy.
Monetary policy:The policies of a central bank, aimed at influencing the level of inflation and growth in an economy. It includes controlling interest rates and the supply of money.
ICE BofAML MOVE Index: The Move Index measures of U.S. interest rate volatility that tracks the movement in U.S. Treasury yield volatility implied by current prices of one-month over-the-counter options on 2-year, 5-year, 10-year and 30-year Treasuries.
Risk assets: Generally refers to assets that have a significant degree of price volatility, such as equities, commodities, high-yield bonds, real estate, and currencies.
Stagflation: A relatively rare situation where rising inflation coincides with anemic economic growth.
Volatility: The rate and extent at which the price of a portfolio, security or index, moves up and down. If the price swings up and down with large movements, it has high volatility. If the price moves more slowly and to a lesser extent, it has lower volatility. It is used as a measure of the riskiness of an investment.
Yield curve: Curve that plots the yields (interest rate) of bonds with equal credit quality but differing maturity dates. Typically bonds with longer maturities have higher yields. The U.S. Treasury yield curve depicts the relationship between the short- and long-term interest rates of fixed-income securities issued by the U.S. Treasury.
Yields: The level of income on a security, typically expressed as a percentage rate. For equities, a common measure is the dividend yield, which divides recent dividend payments for each share by the share price. For a bond, this is calculated as the coupon payment divided by the current bond price.
IMPORTANT INFORMATION
Fixed income securities are subject to interest rate, inflation, credit, and default risk. The bond market is volatile. As interest rates rise, bond prices usually fall, and vice versa. The return of principal is not guaranteed, and prices may decline if an issuer fails to make timely payments, or its credit strength weakens.
Foreign securities are subject to additional risks including currency fluctuations, political and economic uncertainty, increased volatility, lower liquidity and differing financial and information reporting standards, all of which are magnified in emerging markets.
Sign up for timely perspectives delivered to your inbox.