
Subscribe
Sign up for timely perspectives delivered to your inbox.
Head of U.S. Fixed Income Greg Wilensky and Portfolio Manager Michael Keough discuss a likely path for U.S. core inflation and what it could mean for fixed income markets.


As investors contemplate how a hawkish Federal Reserve (Fed) will be slowing economic growth, we believe inflation still holds the key to the prospects for the U.S. economy. Absent any inflationary pressure, the Fed has a great degree of flexibility to adjust monetary policy to promote continued economic growth and full employment. But the inverse also holds true. The more inflation rises – and the longer it persists – the less flexibility the Fed is afforded, to the point where it can no longer choose the best path for the economy, but rather, must settle for the least-worst option.
Following months of upside surprises in inflation reports, when July’s Consumer Price Index (CPI) data was released in August, we witnessed a softer-than-expected core inflation print, alongside cooling energy and commodities prices. Participants in equity and credit markets moved swiftly to declare a victory, which led to an aggressive summer rally in risk assets. Some investors were quick to assume that inflation was on its way down, that the Fed could imminently pause rate hikes – and even begin cutting rates in 2023 – and a recession would be averted. But what followed in August’s report poured cold water on that idea, as inflation proved, yet again, that it’s still a long way from home.
On the back of falling energy prices, the year-over-year change in the headline CPI continued its moderate downward trend to 8.3% in August, from its 9.1% peak in June. In contrast, core CPI, which excludes food and energy, rose to 6.3%, even after decelerating for four months from its 6.5% peak in March. The market was shocked by the sudden turnaround in core CPI and reacted accordingly. Why was core inflation rising after months of declines?
While several categories in the CPI basket climbed higher in August, one of the main reasons for the increase in core CPI can be attributed to the cost of shelter, which has been steadily rising since March 2021, hitting a year-over-year peak of 6.3% most recently. Shelter makes up over 40% of the core CPI basket – by far the largest constituent – so it naturally has the greatest impact on the index. The trend in shelter costs, represented primarily by owners’ equivalent rent (OER), also happens to be somewhat easier to forecast than other categories. Because the Bureau of Labor Statistics only updates the rent of each house in its sample on a rolling basis every six months, OER tends to follow recent home price trends with a significant lag.
Home prices started moving up sharply in September 2020 as pandemic-fueled home demand surged and mortgage rates hit all-time lows. But OER only began rising nine months later, in June 2021, as shown in Figure 1. Considering home prices have just recently plateaued, it seems unlikely that OER will fall materially until well into 2023. While the impact of OER on core personal consumption expenditures (PCE) – which the Fed focuses on – is somewhat lower because it makes up about a quarter of that index, the underlying dynamic is the same. Ultimately, we do not expect to see core inflation trending down significantly until 2023.
Figure 1: No immediate end in sight for rising shelter inflation
OER has historically lagged trends in home prices
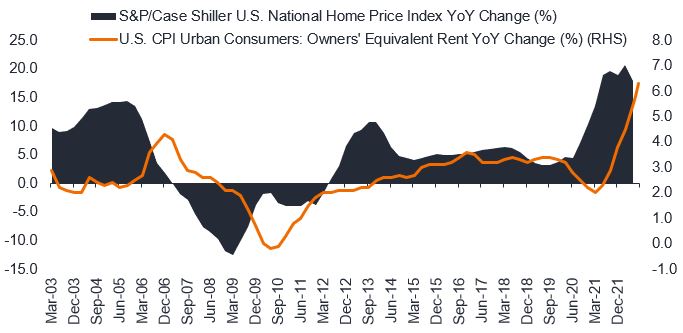
Source: Bloomberg, as of 31 August 2022.
The Fed is facing immense pressure to restore credibility by being tough on inflation. Of course, it is almost impossible to know how much tightening is enough until the effects of the rate hikes take full effect. The lagged measurement of shelter inflation makes evaluating their progress in bringing inflation back to their target even more difficult.
In tightening, will the Fed go too far, or not far enough? The definitive answer will likely only become apparent as we move into 2023 and 2024. That said, we believe the level of the real current federal funds rate (fed funds less most recent core CPI) can indicate whether monetary policy is generally accommodative or restrictive. As shown in Figure 2, with real rates deeply negative, the Fed is still a long way from restrictive territory. Moreover, we think the real forward fed funds rate (fed funds less forecasted core CPI for the next year) needs to move to about 1.25% to bring inflation down. With roughly 3% inflation currently implied by the breakeven rate on Treasury Inflation-Protected Securities (TIPS) for 2023, we would assume the fed funds rate needs to get to at least 4.25%.
Figure 2: Fed has a long way to go to get positive on real fed funds
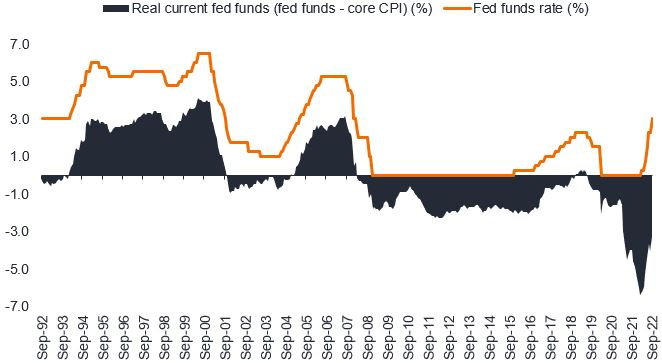
Source: Bloomberg, Janus Henderson Investors, as of 22 September 2022.
As inflation persists and financial conditions become less accommodative, the path for a soft landing looks increasingly narrow. Therefore, we believe the chance that the U.S. will avoid a recession is slim. To get inflation down, the Fed needs to cool the labor market to reduce pressure on wages, which essentially drives services inflation and shelter costs. We believe it will be difficult to generate enough slack in the labor market without causing at least a mild recession.
What would these higher interest rates and a slowing economy mean for corporations, consumers, and financial assets?
The tightening financial conditions may increase financing costs and negatively impact corporate profitability and earnings, while for consumers, higher borrowing costs might impact the affordability of financed purchases. In short, we are likely to see corporate earnings come down, and consumer demand cool, as higher borrowing costs eat into profits and incomes. As a result, one would expect the credit risk premium to increase. In our view, credit markets should be responding to these economic concerns by pricing in the risk of recession, but they have not yet done so to any great degree. Investment-grade (IG) corporate spreads have been hovering around 140 basis points (bps), in large part due to the strong fundamentals across companies. Yet, in periods of slowing growth and credit market stress, spreads have typically hit levels above 200 bps. In our opinion, investors would do well to remain cautious in corporate credit and be patient for better entry points ahead.
Figure 3: Corporate investment-grade option-adjusted spreads (OAS)
Even after stripping out the Global Financial Crisis (GFC) and COVID, current spreads are far below average peak spread during distress
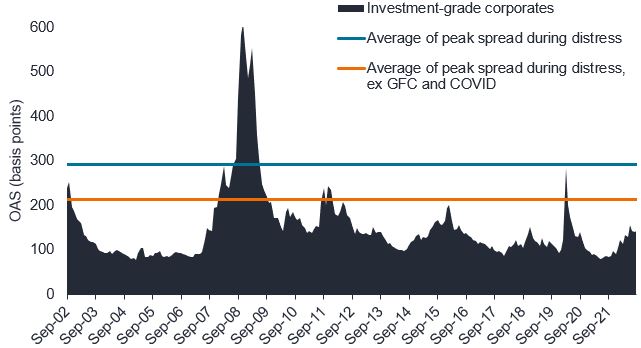
Source: Bloomberg, as of 22 September 2022.
Note: Average of peak spread during distress represents the average of the peak spread reached in each period of credit market distress since 2002: October 2002, November 2008, November 2011, February 2016, December 2018, and March 2020.
While the inflation-driven increase of interest rates has been painful for returns across fixed income, it has also provided some important benefits. The yield on the Bloomberg U.S. Aggregate Bond Index (Agg) is now at its highest level since 2009. After being in a low-rate environment for most of the past decade, we are now finally getting the “income” that investors expect from their fixed income allocation, as shown in Figure 4.
Figure 4: Yield on the Agg at its highest level in over a decade
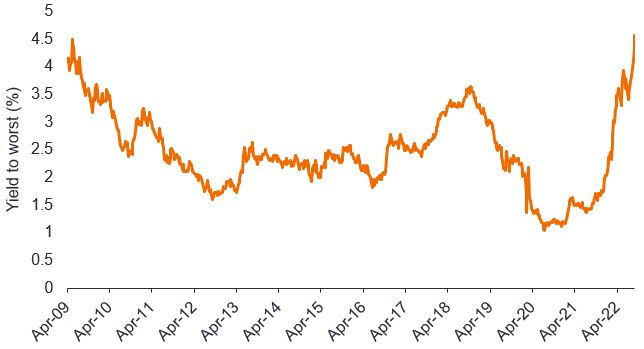
Source: Bloomberg, as of 22 September 2022.
With yields on U.S. Treasuries in the 3.3% to 4.4% range across the yield curve, we believe most of the move higher in risk-free rates is in the rearview mirror. While we are less favorable on the outlook for the overall corporate bond market, there are other spread sectors where we think fundamentals and valuations look more attractive. Within securitized sectors – asset-backed securities (ABS), commercial mortgage-backed securities (CMBS), and agency mortgage-backed securities (MBS) – credit spreads have widened to levels that we believe better reflect the chance of a recession. These sectors offer opportunities for investors to move up in credit quality (including up to the highest AAA rating), while also exhibiting shorter duration than the Agg, and are therefore positioned to benefit from a rise in yields on the short end of the yield curve. Further, we expect securitized sectors to be less impacted than corporate bonds from the spread volatility we think will persist for the remainder of 2022. In short, we believe that in the current environment, securitized sectors can provide offensive characteristics for portfolios by capturing higher yields and more attractive relative valuations, while also strengthening a portfolio’s defense by managing duration and diversifying risk factor exposure.
In summary, while inflation should begin to decline from peak levels, there is a high likelihood that core inflation remains sticky, resulting in the Fed holding their terminal rate higher for longer. We think the Treasury market is now doing a better job of pricing in this outlook, but as the impacts from tighter monetary policy work their way through the economy and markets, we think corporate credit spreads will likely need to move wider to more appropriately price in the risk of a recession. As such, we believe investors may be well served by allocations to quality fixed income – especially in securitized sectors – in their portfolios. On the brighter side, given the significant repricing we have already seen across fixed income markets this year, high-quality fixed income assets are providing the most attractive yields that we have seen in a decade, and the asset class is, therefore, better positioned to help diversify an investor’s overall investment strategy.
[jh_content_filter spoke=”apac-social, arpa, auii, aupi, axii, bepa, brpa, clpa, cnpi-en, copa, deii, dkii, dkpa, dkpi, fiii, fipa, hkpi-en, iepa, iepi, lupa, lupi, media, mxpa, nlii, noii, nopa, nopi, pepa, ptpa, seii, sepa, sepi, sgpi, social, ukii, ukpa, ukpi, uopa, usii, uspa, uspi, uypa, zapa”]
[/jh_content_filter]
Bloomberg U.S. Aggregate Bond Index is a broad-based measure of the investment grade, US dollar-denominated, fixed-rate taxable bond market.
The Consumer Price Index (CPI) measures the change in prices paid by consumers for goods and services.
Consumer spending, or personal consumption expenditures (PCE), is the value of the goods and services purchased by, or on the behalf of, U.S. residents.
Credit risk premium: The premium over the risk-free interest rate that the market requires to cover credit rating downgrades, defaults, and other risks, such as liquidity risk.
Credit spread/spread: is the difference in yield between securities with similar maturity but different credit quality. Widening spreads generally indicate deteriorating creditworthiness of corporate borrowers, and narrowing indicate improving.
Duration can also measure the sensitivity of a bond’s or fixed income portfolio’s price to changes in interest rates.
The Fed, or Federal Reserve, is the central banking system of the United States.
The federal funds rate is the interest rate that banks charge each other to borrow or lend excess reserves overnight.
Inflation-linked bonds feature adjustments to principal based on inflation rates. They typically have lower yields than conventional fixed-rate bonds and decline in price when real interest rates rise.
Option-Adjusted Spread (OAS) measures the spread between a fixed-income security rate and the risk-free rate of return, which is adjusted to take into account an embedded option.
Owners’ equivalent rent (OER) measures how much money a property owner would have to pay in rent to be equivalent to their cost of ownership.
Volatility measures risk using the dispersion of returns for a given investment.
IMPORTANT INFORMATION
Diversification neither assures a profit nor eliminates the risk of experiencing investment losses.
Fixed income securities are subject to interest rate, inflation, credit and default risk. The bond market is volatile. As interest rates rise, bond prices usually fall, and vice versa. The return of principal is not guaranteed, and prices may decline if an issuer fails to make timely payments, or its credit strength weakens.
Sign up for timely perspectives delivered to your inbox.