
Subscribe
Sign up for timely perspectives delivered to your inbox.
High energy prices, dollar strength, and rising financing costs have brewed sovereign default concerns, reflected in wider spreads. Portfolio Managers Bent Lystbaek, Jacob Ellinge Nielsen, Thomas Haugaard and Sorin Pirău, CFA, consider the divergence in emerging markets.


When looking at the emerging markets debt (EMD) sovereign hard currency (HC) issuers trading at distressed levels, this has surpassed pandemic peak levels at 22% of the universe1 when considering the number of countries in the benchmark. However, when considering the weight of these countries, this is a much smaller percentage, at 6.7%, of the index. Smaller frontier markets dominate the list of sovereign issuers that are trading at levels of over 1,000 basis points (bps), reflecting this smaller weight in the J.P. Morgan EMBI Global Diversified Index (EMBIGD), as shown in Figure 1.
Figure 1: Frontier markets make up the majority of distressed sovereign issuers
| Country | Spread (bps) | Yield-to-worst (%) |
EMBIGD weight (%) |
Average bond (US$) |
|---|---|---|---|---|
| Lebanon | 50051 | 504.3 | 0.16 | 7 |
| Sri Lanka | 5759 | 61.3 | 0.57 | 30 |
| Zambia | 3778 | 41.6 | 0.28 | 56 |
| Ukraine | 3415 | 37.8 | 0.71 | 23 |
| Ethiopia | 3242 | 36.2 | 0.09 | 55 |
| Tunisia | 2520 | 29.0 | 0.10 | 67 |
| El Salvador | 2471 | 28.3 | 0.40 | 36 |
| Argentina | 2329 | 26.8 | 1.10 | 25 |
| Ghana | 2135 | 24.5 | 1.07 | 47 |
| Pakistan | 1835 | 22.0 | 0.77 | 55 |
| Tajikistan | 1663 | 20.4 | 0.05 | 66 |
| Ecuador | 1494 | 18.5 | 1.16 | 42 |
| Suriname | 1341 | 17.1 | 0.07 | 71 |
| Maldives | 1218 | 15.9 | 0.07 | 83 |
| Mozambique | 1091 | 14.5 | 0.11 | 71 |
| Total weight | 6.72 |
Source: Macrobond, J.P. Morgan, Janus Henderson Investors, as at 14 September 2022. Note: Average bond price is a simple unweighted average of the bonds that we have in our system for each country at a given point in time.
Arguably, some of the distressed issuers are priced aggressively, particularly given imminent or ongoing engagement with multilateral partners such as the International Monetary Fund (IMF). With this institution, Zambia agreed on a US$1.3 billion package in August; Pakistan managed to secure an increased bailout package in August; and Sri Lanka reached a staff-level agreement for a US$2.9 billion Extended Fund Facility in September. Several other distressed issuers including Egypt and Ghana are at different stages of discussions with the IMF and several more are already in IMF programmes. Countries can benefit from such initiatives, like longer-term financial support through the Resilience and Sustainability Trust (RST) and the Common Framework – designed to help low-income countries with debt sustainability issues through the implementation of a reform framework. Countries are required to accept some conditionalities in terms of certain policy improvements, structural reforms, and currency reserve accumulation, a positive for the asset class.
EMs generally experienced a strong recovery in 2021 accompanied by a notable improvement in fiscal balances and declining debt-to-GDP. However, fortunes turned in 2022. Dollar strength and rising external financing costs have led to funding concerns in several vulnerable EMs. These have been amplified by higher energy and food costs, which have increased social pressures on policy makers to respond fiscally, limiting their ability to safeguard fiscal credibility when it is most needed. Concerns around EM sovereign defaults have thus risen.
However, we believe perceived default risk is higher than actual default risk, and often defaults are in smaller frontier markets, while the bigger part of the EM universe has become quite resilient over past decades. Historical analysis shows sovereign defaults are few and far between and in recent years, external shocks tend to be the culprit and less so self-inflicted policy mistakes. There have been fewer defaults of HC sovereign bonds or bank loans over the past couple of decades compared to the height of the defaults seen in the 1980s when the US Federal Reserve (Fed) executed an aggressive hiking cycle, with only comparable levels seen during 2020. It is worthy to note the default environment in the ‘80s was amid a high double-digit interest rate environment in the US with rates as high as 20% – an unlikely environment now considering the somewhat well-established inflation-fighting credentials of all major central banks globally.
Figure 2: Bifurcation between IG and HY spreads has emerged
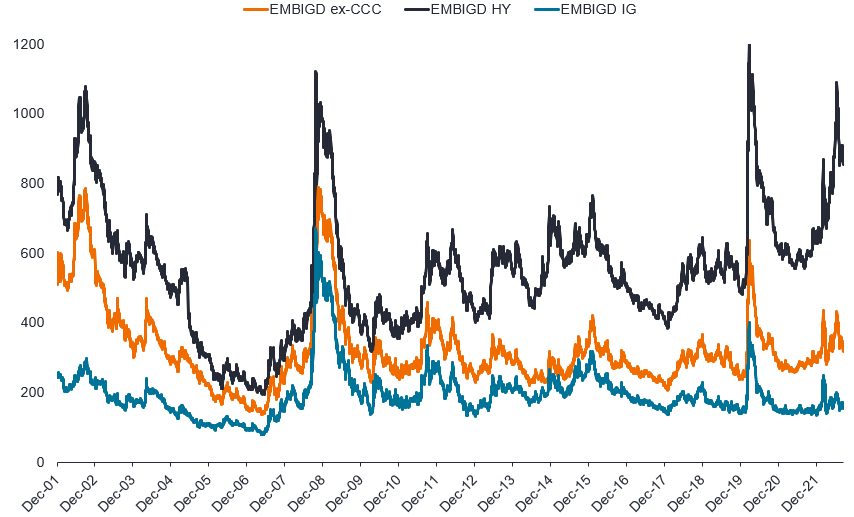
Source: Bloomberg, J.P. Morgan, as at 15 September 2022. Indices shown are the J.P. Morgan EMBIGD Index excluding CCC-rated issuers (EMBIGD ex-CCC), J.P. Morgan EMBIGD High Yield Index (EMBIGD HY), and the J.P. Morgan EMBIGD Investment Grade Index (EMBIGD IG).
Such aggressive pricing means that distressed and defaulted names in the lower-rated high yield (HY) bucket, such as CCC-rated bonds, are skewing spreads upwards (Figure 2), creating the semblance of a potential value trap. This is reflected in the bifurcation between investment grade (IG) and HY, where spreads in HY EMBI are now at their widest decile versus the past decade (trading at 900 bps), while the IG EMBI are only just below median levels2. One driver of dispersion in performance within the sovereign EMD asset class has been commodity price tailwinds, benefitting exporter EMs and improving their terms of trade (ToT) – the ratio of export prices to import prices.
Figure 3: Clear winners and losers in ToT since the pandemic outbreak
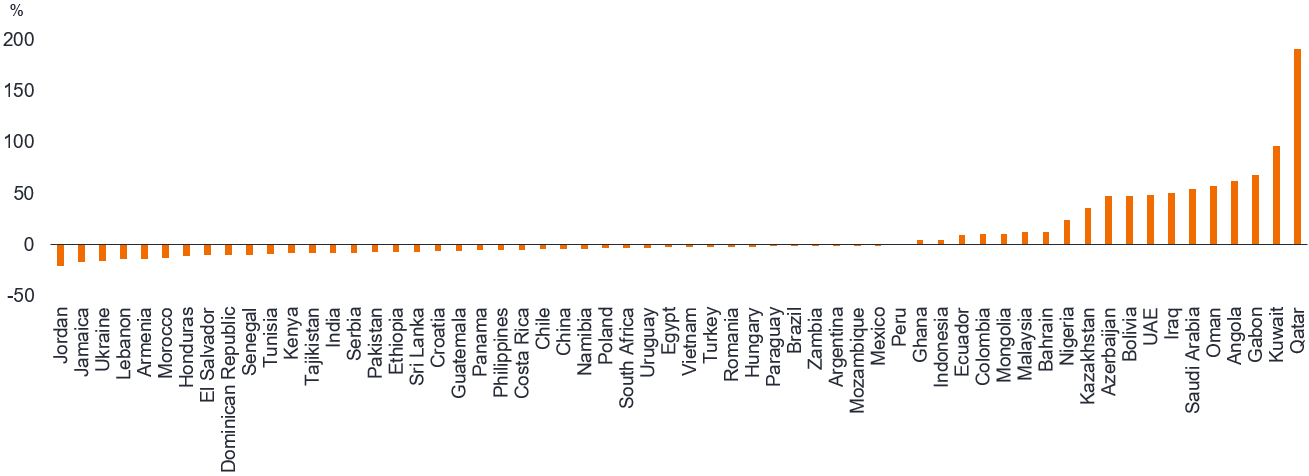
Source: Janus Henderson Investors, Macrobond, 1 April 2020 to 16 September 2022.
Looking at the percentage changes in ToT since the outbreak of COVID-19 (Figure 3), major winners during that period are the IG Middle East countries (Qatar, Kuwait, Saudi Arabia, UAE) – beneficiaries of exporting oil – which likely explains why the IG component of the EMBIGD is so tight. So at least part of IG is likely tight for a fundamental reason, as shown by the smaller spread for these countries (Figure 4). When dissecting that bucket further, some of the less energy-dependent countries – how reliant a country is on meeting its energy needs through imports – like Mexico, Romania, Panama, Hungary – appear to have value when looking at those with the largest spreads in the IG component of the index. This highlights there is still value available in the IG universe.
Figure 4: Despite its tightness, there is variation in spreads within IG
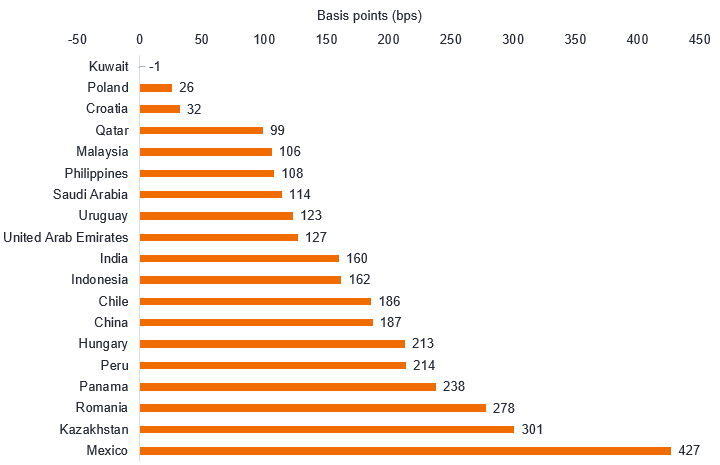
Source: J.P. Morgan, Macrobond, as at 14 September 2022. Spread for IG countries in the J.P. Morgan EMBI Global Diversified Index.
Winners and losers are therefore emerging as some countries are impacted more than others by the current external environment, given different food and energy price exposure (and hence the social effect) and economic fundamental dynamics. While just one measure, ToT exemplifies this divergence. It can also be seen in pass-through of inflation from a 20% increase in the crude oil price differing by country and region with variation in the impact on CPI, GDP growth, the trade balance, and budget balance.
“Figure 5: Variation in the impact of a 20% increase in the crude oil price
| % of GDP | |||||
| Weight of energy in CPI (%) |
CPI impact (%)1 |
GDP2 | Trade balance | Budget balance3 | |
| EM Asia | 7.5 | 0.4 | -0.3 | -0.4 | 0.0 |
| China | 6.6 | 0.5 | -0.3 | -0.4 | 0.0 |
| India | 9.2 | 0.2 | -0.4 | -0.5 | 0.0 |
| Indonesia | 12.7 | 0.1 | 0.0 | -0.2 | 0.2 |
| Malaysia | 11.7 | 0.2 | 0.0 | 0.5 | 0.2 |
| Philippines | 9.1 | 0.9 | -0.5 | -0.5 | 0.0 |
| EMEA EMs | 11.8 | 0.2 | 0.0 | 0.5 | 0.4 |
| Hungary | 12.5 | 0.7 | -0.1 | -0.5 | 0.1 |
| Israel | 5.0 | 0.2 | -0.2 | -0.3 | 0.1 |
| Poland | 17.1 | 0.6 | -0.1 | -0.5 | 0.1 |
| Romania | 16.3 | 0.0 | 0.0 | -0.2 | 0.1 |
| South Africa | 8.4 | 0.0 | -0.1 | -0.3 | 0.0 |
| Turkey | 11.2 | 0.4 | -0.2 | -0.8 | 0.0 |
| Latam | 12.0 | 0.7 | 0.0 | 0.0 | 0.3 |
| Argentina | 7.2 | 0.6 | 0.0 | -0.1 | -0.2 |
| Brazil4 | 14.4 | 0.7 | 0.0 | 0.2 | 0.4 |
| Chile | 8.5 | 0.7 | 0.0 | -0.1 | 0.0 |
| Colombia5 | 6.9 | 0.2 | 0.3 | 0.8 | 0.4** |
| Ecuador | 2.8 | 0.2 | 0.3 | 1.1 | 0.5 |
| Mexico | 14.2 | 0.9 | -0.1 | -0.3 | 0.5 |
| Peru | 4.8 | 0.3 | 0.0 | -0.1 | 0.0 |
| Uruguay | 8.3 | 0.5 | -0.1 | -0.3 | 0.0 |
1 Product of coefficient of pass-through, energy weight in CPI, and % change in price of crude; no change in subsidies.
2 Product of % change in CPI, Marginal propensity to consume (MPC), and % Personal Consumption Expenditures in GDP.
3 Most of the fiscal impact of oil prices is lagged one year, as **Ecopetrol dividends and income tax reflect prior year result.
4 Assumes no increase in electricity prices as at least 70% of the capacity of generation is hydroelectric.
5 Assumes no subsidies to gasoline.
Source: National sources and J.P. Morgan estimates, as at 14 September 2022.
While the economic backdrop continues to be tricky, we believe that there will be some bright spots. Many of the big EM economies saw decent improvements in key credit metrics, such as debt/GDP, in 2021 due to high nominal growth and fiscal improvements. Some countries have also reduced their reliance on external debt, and while we’ve seen some retracement of the commodity tailwinds for ToT, there are still some that have more positive positions than before the pandemic.
Policy quality is another aspect that can armour economic resilience. Many EMs now have policy frameworks similar to developed markets, including independent central banks targeting inflation, floating exchange rates (where currency value is determined by supply and demand), and more rules-based fiscal policy frameworks. This is likely why the EM asset class has fared relatively well in the past 20 years despite several significant shocks to the global economy. Sovereign credit ratings trends have reflected some of the recent improvement in EM fundamentals. While we saw a lot of downgrades in 2020, these stabilised in 20213 and there has been a cautious turnaround in ratings as outlooks have turned less negative on balance for the asset class.
So, we have seen that looking underneath the bonnet of HC sovereign debt, there is much variation that determines the challenges that countries will have to overcome to manage a late-cycle environment. This is reflected in the dispersion in spreads, which is at recent highs (and has been going up following a retracement post the COVID peak) even when excluding distressed names or just looking at IG names. Therefore, even without the extremes within the asset class, ample dispersion means opportunities to capture alpha through country allocation. Spreads at these levels could offer attractive returns in the next 12-18 months, as shown by returns from such peaks of similar magnitude, given relatively healthy fundamentals.
That said, we believe it is justified to take a cautious stance when investing in the asset class given the uncertain global environment. The Russia-Ukraine war-related uncertainty and supply disruption in both goods and commodity markets, as well as stubbornly high inflation and the Fed’s increasing hawkishness, has seen a rapid move in real rates and US dollars, drawing flows away from the EM HC asset class. This backdrop makes countries’ fundamental strength – such as the balance of payments and the scale of international reserves and external debt that needs to be financed – even more key going forward, as are countries’ policy frameworks and their ability to instil investor confidence.
Countries in trouble have been supported by access to different funding sources and some of the recent debt restructurings following defaults have been relatively investor friendly. While defaults and restructurings do happen, unlike with corporate bankruptcies, countries continue to exist and serve their population going forward. Coupled with the greater involvement of multilateral institutions, this creates wider scope for debt negotiation between a country and its creditors.
[jh_content_filter spoke=”apac-social, arpa, auii, aupi, axii, bepa, brpa, clpa, cnpi-en, copa, deii, dkii, dkpa, dkpi, fiii, fipa, hkpi-en, iepa, iepi, lupa, lupi, media, mxpa, nlii, noii, nopa, nopi, pepa, ptpa, seii, sepa, sepi, sgpi, social, ukii, ukpa, ukpi, uopa, usii, uspa, uspi, uypa, zapa”]
[/jh_content_filter]
1 As defined by the J.P. Morgan EMBI Global Diversified Index, as at 14 September 2022.
2 Source: Bloomberg, 31 December 2002 to 31 August 2022.
3 Source: Moody’s, as at 14 April 2022.
Alpha: This compares risk-adjusted performance relative to an index. Positive alpha means outperformance on a risk-adjusted basis.
Balance of payments: The difference between all money flowing into the country in a particular period of time and the outflow of money to the rest of the world.
Budget/fiscal balance: The balance between a government’s revenues and its expenditures.
Consumer Price Index (CPI): A measure that examines the price change of a basket of consumer goods and services over time. It is used to estimate ‘inflation’.
Credit rating: A score usually given by a credit rating agency such as Standard & Poor’s, Moody’s and Fitch on the creditworthiness of a borrower. Credit quality ratings are measured on a scale that generally ranges from AAA (highest) to D (lowest). Moody’s, another well-known credit rating agency, uses a slightly different format with Aaa (a high credit rating) and B3 (a low credit rating).
Default: The failure of a debtor (such as a bond issuer) to pay interest or to return an original amount loaned when due.
Dispersion: This refers to the range of possible returns on an investment. It can also be used to measure the risk inherent in a particular security or investment portfolio.
External debt: External debt is the portion of a country’s debt that is borrowed from foreign lenders, including commercial banks, governments, or international financial institutions.
Fiscal policy: Connected with government taxes, debts, and spending. Government policy relating to setting tax rates and spending levels. It is separate from monetary policy, which is typically set by a central bank.
Gross domestic product (GDP): The value of all finished goods and services produced by a country, within a specific time period (usually quarterly or annually). It is usually expressed as a percentage comparison to a previous time period, and is a broad measure of a country’s overall economic activity.
Hard currency: A hard currency denominated bond is issued by an EM entity whose interest and capital are denominated in a hard currency – typically US dollars, although other hard currencies can include euro, sterling and yen.
High yield bond: A bond which has a lower credit rating below an investment-grade bond. It is sometimes known as a sub-investment grade bond. These bonds usually carry a higher risk of the issuer defaulting on their payments so they are typically issued with a higher coupon to compensate for the additional risk.
Investment grade bond: A bond typically issued by governments or companies perceived to have a relatively low risk of defaulting on their payments. The higher quality of these bonds is reflected in their higher credit ratings when compared with bonds thought to have a higher risk of default, such as high-yield bonds.
The J.P. Morgan Emerging Market Bond Index Global Diversified (EMBIGD) is a uniquely weighted USD-denominated emerging markets sovereign index. It tracks liquid, US dollar emerging market fixed and floating-rate debt instruments issued by sovereign and quasi sovereign entities.
Late-cycle: Asset performance is often driven largely by cyclical factors tied to the state of the economy. Economies and markets are cyclical and the cycles can last from a few years to nearly a decade. Generally speaking, early cycle is when the economy transitions from recession to recovery; mid-cycle is when recovery picks up speed while in the late cycle growth slows, wages start to rise and inflation begins to pick up. At this stage, investors become invariably bullish, believing that prices will continue to rise.
Personal Consumption Expenditures: The value of the goods and services purchased by, or on the behalf of, US residents.
Sovereign bonds: Bonds issued by governments and can be either local-currency-denominated or denominated in a foreign currency. Sovereign debt can also refer to the total of a country’s government debt.
Spread/credit spread: The difference in the yield of a corporate bond over that of an equivalent government bond.
Trade balance: The difference between the value of the goods that a country exports and the value of the goods that it imports.
Yield to worst (YTW): The lowest yield a bond can achieve provided the issuer does not default and accounts for any applicable call feature (ie, the issuer can call the bond back at a date specified in advance). At a portfolio level, this statistic represents the weighted average YTW for all the underlying issues.
IMPORTANT INFORMATION
Fixed income securities are subject to interest rate, inflation, credit, and default risk. As interest rates rise, bond prices usually fall, and vice versa. High-yield bonds, or “junk” bonds, involve a greater risk of default and price volatility. Foreign securities, including sovereign debt, are subject to currency fluctuations, political and economic uncertainty, and increased volatility and lower liquidity, all of which are magnified in emerging markets.
Sovereign debt securities are subject to the additional risk that, under some political, diplomatic, social or economic circumstances, some developing countries that issue lower quality debt securities may be unable or unwilling to make principal or interest payments as they come due.
Sign up for timely perspectives delivered to your inbox.