
Subscribe
Sign up for timely perspectives delivered to your inbox.
Forward, long leading economic indicators have morphed our expectations of an economic growth deceleration in H2 2022 into what now looks like a long and deep global recession into mid-2023 at a minimum. The outlook is one of the most ominous in our careers.

Not the backdrop for a ‘soft landing’
Every long leading business cycle indicator that we follow routinely has collapsed this year to levels that signal an unusually synchronised global recession. Equity markets have sniffed this out and are themselves classified as a shorter lead indicator – eg, US equity markets have been one of the components in the Conference Board’s lead indicators since 1937. In contrast, central banks are focused on a historically aggressive round of rate hikes and quantitative tightening given that the lagging indicators like inflation and unemployment are yet to show any sign of a turn.
For those who follow the business cycle and its signals, the future path of the economies can be visible well before the actual turns, and the same factors regularly signal turns in the cycle. In contrast, within macroeconomics there remains a lack of consensus on what drives the business cycle and a repeated failure to predict downturns.
In this article we aim to break down the indicators of the business cycle (leads of leads (anticipatory), lead, coincident and lagging indicators – see Figure 1) and where we might sit in this growth cycle.
Figure 1: Business cycle 101
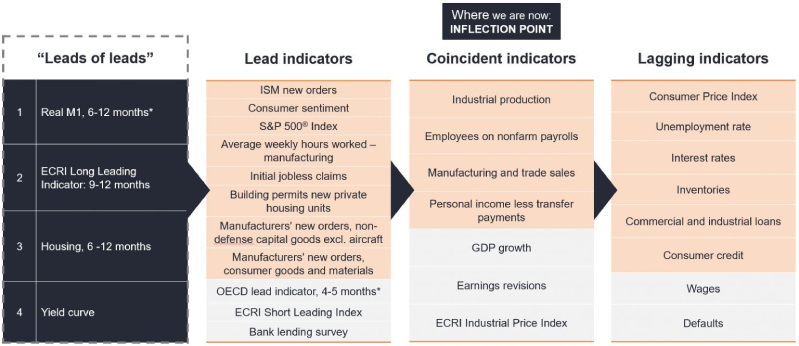
Source: Janus Henderson Investors Analysis, as at 10 August 2022.
Notes: * Simon Ward: www.moneymovesmarkets.com. Indicators highlighted in orange are components of the Conference Board Indicators.
‘Lead’ indicators, as defined by the US Conference Board, include such items as the Institute for Supply Management (ISM) new orders, consumer sentiment, and average weekly hours worked in manufacturing. We believe that the Organization for Economic Cooperation and Development’s (OECD) lead indicator and bank lending surveys also fit this category. ‘Coincident’ economic indicators can include industrial production, non-farm payrolls, manufacturing and trade, gross domestic product (GDP) growth, and earnings revisions (the last two are our classification). Finally, data such as corporate default rates, unemployment, and inflation are typical ‘lagging’ indicators.
Over the years, we have looked at the business cycle macro processes through four long, ‘lead of leads’ or anticipatory indicators. These are real M1, Economic Cycle Research Institute (ECRI)’s long leading indicator, housing, and the yield curve. These indicators generally lead the ‘lead’ indicators by 9-12 months, are data driven and do not change (ie, are not subject to revisions), and are not only useful in signalling turning points but can also help in assessing how deep and long the downturns may be.
If we look at the growth of real M11 – a key monetary leading indicator of the economy, which has on average led turning points in the global manufacturing PMI new orders by 6-7 months, the speed and depth of the contraction is at a level not seen since the 1970s (Figure 2), and those two occasions were before severe recessions.
Figure 2: G7 real narrow money growth contracts
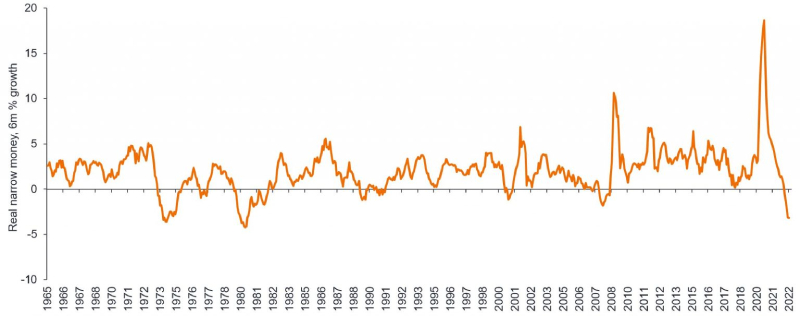
Source: Refinitiv Datastream, Simon Ward, as at 23 August 2022.
Note: For illustrative purposes only. There is no guarantee that past trends will continue, or forecasts will be realised.
Now, narrow money is more sensitive to policy changes than broad money. But the rate of contraction of real broad money is also faster now than during those episodes.
The ECRI, which carries out business cycle research, has indices going back to the 1920s in the US and the 1960s in Europe. Its broad (22 country) ‘long lead index’ leads economic turning points by 9-12 months and is sending a similar message to that of the real M1 – showing no sign of bottoming over the next year. Further, the ECRI indices looking at the industrial and services sides of the economy – again leading by 9-12 months – are also showing the same weaknesses, reinforcing the message across all sectors.
Housing is a classic early business cycle indicator. Though unimportant in normal periods, weakness in housing is a critical part of economic recession, as described in Edward Leamer’s 2007 paper ‘Housing is the Business Cycle’.
We are seeing the start of steep housing downturns across a range of economies including the US, Canada, Sweden, and Australia, not to mention China, that is well progressed. The US National Association of Home Builders (NAHB) sentiment index is showing a very sharp, sudden drop (Figure 3) while in the UK, a recent survey showed home buyer enquiries to be at their lowest levels since 2008 and the COVID‑19 crisis.
Figure 3: Sudden, sharp drop in NAHB sentiment index
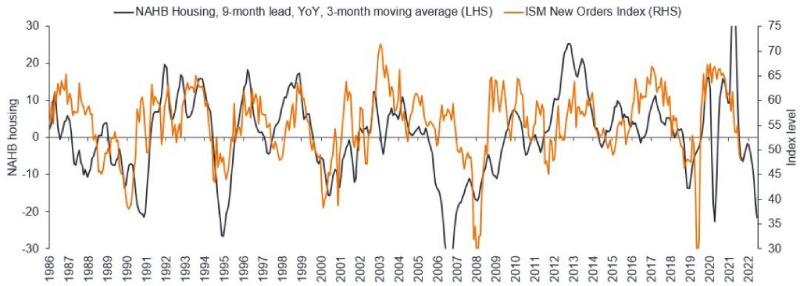
Source: Bloomberg, Janus Henderson Investors, as at 31 July 2022.
Note: For illustrative purposes only. There is no guarantee that past trends will continue, or forecasts will be realised.
The upcoming deep downturn is also evident in housing inventories, which generally lead the business cycle. When plotted versus unemployment or equity prices, both show a sharp and rapid shift.
Yield curve inversions are both a symptom and a cause of downturns. The US Treasury yield curve initially inverted in March this year, but it has now stretched across all parts of the curve such as the ‘2s 5s’ (the spread between the two- and five-year yields) and ‘2s 10s’. Yield curve inversions such as these are an impediment to lending for both banks, which tend to borrow at short‑term rates and lend out on the long term, and also for bond investors. If yields at the short end of the curve are at reasonably high levels, what is the incentive to lend out (buy bonds) at longer maturities? Thus, creating a feedback loop further tightening financial conditions.
Following these long, lead indictors is similar to embarking on a journey. After the lead indicators have turned and when coincident indicators begin to turn, we can see what lies ahead. These will be followed by turns in the lagging indicators of the economy. The dilemma for central banks is that they are targeting lagging indicators such as inflation and unemployment, which tend to vary in different economic cycles. For example, employment can be a lagging indicator or lead into recession – strong non-farm payrolls at the onset of a recession were common in the inflationary recessions of the 1970s.
Focusing on the latter set of data increases the risks of policy overkill, raising the potential for policy errors.
What is going wrong with government bond yields? In recent decades, growth momentum has been the best driver of government bond yields and risk assets (though not foolproof), and for us as portfolio managers, the key data to watch here is the ISM new orders.
For most of our careers, government bond yields have broadly followed the rate of change of growth momentum, as shown in Figure 4 (ISM new orders chosen as the proxy), but as the chart shows, bond yields have overshot (moving in the opposite direction) when core Consumer Price Index (CPI), ie, inflation, spiked into growth downturns.
Figure 4: Government bond yields have decoupled from the growth cycle in 2022
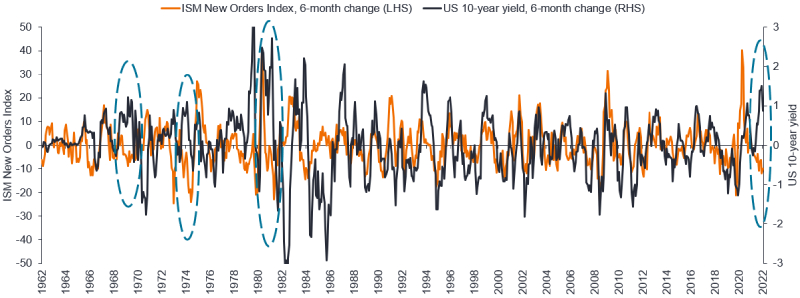
Source: Janus Henderson Investors, Bloomberg, Bank of America, as at 10 August 2022.
The three dislocations (circled) from the 1970s were all due to a CPI shock. Looking back, in 1970 and 1981, the catalyst for bond yields to recouple to growth was a negative non-farm payroll number (coincident indicator). The 1974-75 episode was different, as bond yields peaked very late after lagging economic indicators bottomed and took about a year to finally turn.
In business cycles, recession kills inflation. Put another way, inflation cycles peak after growth cycles.
From a monetarist perspective, today’s inflation cycle looks very different to that of the 1970s. To explain: broad money growth, after peaking in February 2021, collapsed to its pre‑pandemic average in July (around 5% yoy), whereas it never fell below 10% in the inflationary periods of the mid- to late ‘70s (partly because that was a decade of credit deregulation and strong credit growth). The current pattern looks like a boom/bust episode with nominal broad money growth barely growing in recent months.
The outlook, as we see it, is one of the most ominous in our careers. The breadth and depth of the collapse in the global lead indicators we watch is now of an historic scale. Lead of lead indicators show no sign of a turnaround, with growth unlikely to bottom until the second quarter of 2023 at the earliest.
While our process is not foolproof, there is also a litany of potentially negative catalysts into the global recessionary backdrop, such as the continuing energy crisis, the structural growth collapse in China (property defaults), and its zero COVID policy, as well as the panic‑induced aggressive central bank policies (interest rate hikes and quantitative tightening). Markets ought to lose their worry about inflation soon and instead turn their focus on the lack of growth and the recessionary outlook we see.
[jh_content_filter spoke=”apac-social, arpa, auii, aupi, axii, bepa, brpa, clpa, cnpi-en, copa, deii, dkii, dkpa, dkpi, fiii, fipa, hkpi-en, iepa, iepi, lupa, lupi, media, mxpa, nlii, noii, nopa, nopi, pepa, ptpa, seii, sepa, sepi, sgpi, social, ukii, ukpa, ukpi, uopa, usii, uspa, uspi, uypa, zapa”]
[/jh_content_filter]
1The work of our Economic Adviser, Simon Ward
Broad money: Broad money is a category for measuring the amount of money circulating in an economy. It is defined as the most inclusive method of calculating a given country’s money supply, and includes narrow money along with other assets that can be easily converted into cash to buy goods and services.
The Consumer Price Index (CPI): The consumer price index is a measure of the average change over time in the prices paid by urban consumers for a market basket of consumer goods and services.
Economic cycle: The fluctuation of the economy between expansion (growth) and contraction (recession). It is influenced by many factors including household, government and business spending, trade, technology, and central bank policy.
Economic indicators: Statistics about economic activity; used to assess, measure, and evaluate the overall state of health of the macroeconomy.
Inflation: The rate at which the prices of goods and services are rising in an economy. The CPI and RPI are two common measures. The opposite of deflation.
ISM: The ISM manufacturing index or Purchasing Managers’ Index is considered a key indicator of the state of the U.S. economy. It indicates the level of demand for products by measuring the amount of ordering activity at the nation’s factories.
M1: The money supply that is composed of currency, demand deposits, other liquid deposits, which includes savings deposits.
Monetary policy: The policies of a central bank, aimed at influencing the level of inflation and growth in an economy. It includes controlling interest rates and the supply of money. Monetary stimulus refers to a central bank increasing the supply of money and lowering borrowing costs. Monetary tightening refers to central bank activity aimed at curbing inflation and slowing down growth in the economy by raising interest rates and reducing the supply of money.
Money supply: Money supply is the total amount of money within an economy. The narrow definition of money supply includes notes and coins in circulation and money equivalents that can be converted into cash easily. The broader definition includes various kinds of longer-term, less liquid bank deposits.
Narrow money: Narrow money is a category of money supply that includes all physical money such as coins and currency, demand deposits, and other liquid assets held by the central bank.
PMI: The Purchasing Managers’ Index (PMI) is an index of the prevailing direction of economic trends in the manufacturing and service sectors.
Quantitative tightening: A contractionary monetary policy. This is opposite to quantitative easing, which is an unconventional monetary policy used by central banks to stimulate the economy by boosting the amount of overall money in the banking system.
Recession: A period of temporary economic decline during which trade and industrial activity are reduced, generally identified by a fall in gross domestic product (GDP) growth in two successive quarters.
Volatility: The rate and extent at which the price of a portfolio, security or index moves up and down. If the price swings up and down with large movements, it has high volatility. If the price moves more slowly and to a lesser extent, it has lower volatility. The higher the volatility means the higher the risk of the investment.
Yield curve: A graph that plots the yields of similar quality bonds against their maturities. In a normal/upward sloping yield curve, longer maturity bond yields are higher than short-term bond yields. A yield curve can signal market expectations about a country’s economic direction.
Yield curve inversion: A yield curve inverts when long-term interest rates drop below short-term rates, indicating that investors are moving money away from short-term bonds and into long-term ones.
IMPORTANT INFORMATION
Fixed income securities are subject to interest rate, inflation, credit, and default risk. As interest rates rise, bond prices usually fall, and vice versa. High-yield bonds, or “junk” bonds, involve a greater risk of default and price volatility. Foreign securities, including sovereign debt, are subject to currency fluctuations, political and economic uncertainty, and increased volatility and lower liquidity, all of which are magnified in emerging markets.
Sign up for timely perspectives delivered to your inbox.