

Subscribe
Sign up for timely perspectives delivered to your inbox.
Portfolio Managers, John Kerschner, Nick Childs, and Jessica Shill, discuss how adding floating-rate CLOs to traditional fixed-rate bond portfolios may improve risk-adjusted returns.


Nobel Prize laureate and economist Harry Markowitz is credited with stating that diversification is the only free lunch in investing. His point? That by diversifying one’s investment holdings, an investor can get the benefit of reduced risk while sacrificing little in expected returns over the long run.
The issue of diversification has roared back to the forefront of investor concerns in 2022, as equity and fixed income markets experienced unprecedented concurrent drawdowns. The Bloomberg U.S. Aggregate Bond Index (Agg) and the S&P 500® Index are down 10.8% and 16.2%, respectively.1 For many investors, fixed income is considered “the diversifier” to their equity holdings, but disappointingly, they have not seen much diversification benefit from bonds in 2022.
In response, some investors are looking to new asset classes to diversify their portfolios. Commodities, liquid alternatives, unlisted real estate, and cryptocurrencies have garnered more attention, and their inclusion in traditional stock-bond portfolios is on the rise. While we believe this form of inter-asset class diversification (diversification between asset classes) provides benefits when done well, we think investors should not overlook the importance of intra-asset class diversification (diversification within asset classes).
While investors might consider their portfolios well-diversified in terms of sector, credit risk, and duration exposure, where we see an opportunity for further diversification is in fixed versus floating-rate allocations.
The Agg and the Bloomberg U.S. Corporate High Yield Index (High Yield) are comprised of 100% fixed-rate bonds. Therefore, portfolios that are exclusively allocated to these indexes are wholly inversely correlated to changes in interest rates (fixed-rate bond prices fall as interest rates rise). In addition, many fixed-rate sectors exhibit high correlations to one another, thereby limiting the diversification benefits of adding more fixed-rate sectors.
What is missing from many bond portfolios, in our view, is a fixed income asset that benefits from rising rates. For this purpose, investors might consider floating-rate collateralized loan obligations (CLOs). CLOs typically have high credit ratings – over 80% of CLOs are issued with an A credit rating or higher.2 And while the underlying assets of CLOs are bank loans, because CLOs are portfolios of loans that are actively managed by a specialist CLO manager, they have had lower default rates than the broader loan market. Furthermore, the CLO structure favors higher tranches3, so for a AAA rated CLO to default, 80% of the loans in the pool would need to go bad. To give some perspective, the highest loan default rate experienced during the Global Financial Crisis (GFC) was 12%.4
For multi-asset portfolios, we consider CLOs to be a good diversifier because of their low combined correlation to equities and fixed income. In contrast, investment-grade corporates (IG corporates), agency mortgage-backed securities (MBS), and U.S. Treasuries may exhibit low correlations to equities, but are all highly correlated to the Agg and to one another. Inversely, high yield exhibits a lower correlation to the Agg, but is more highly correlated to equities, as shown in Exhibit 1.
Exhibit 1: CLOs display low combined correlation to U.S. equities and U.S. fixed income
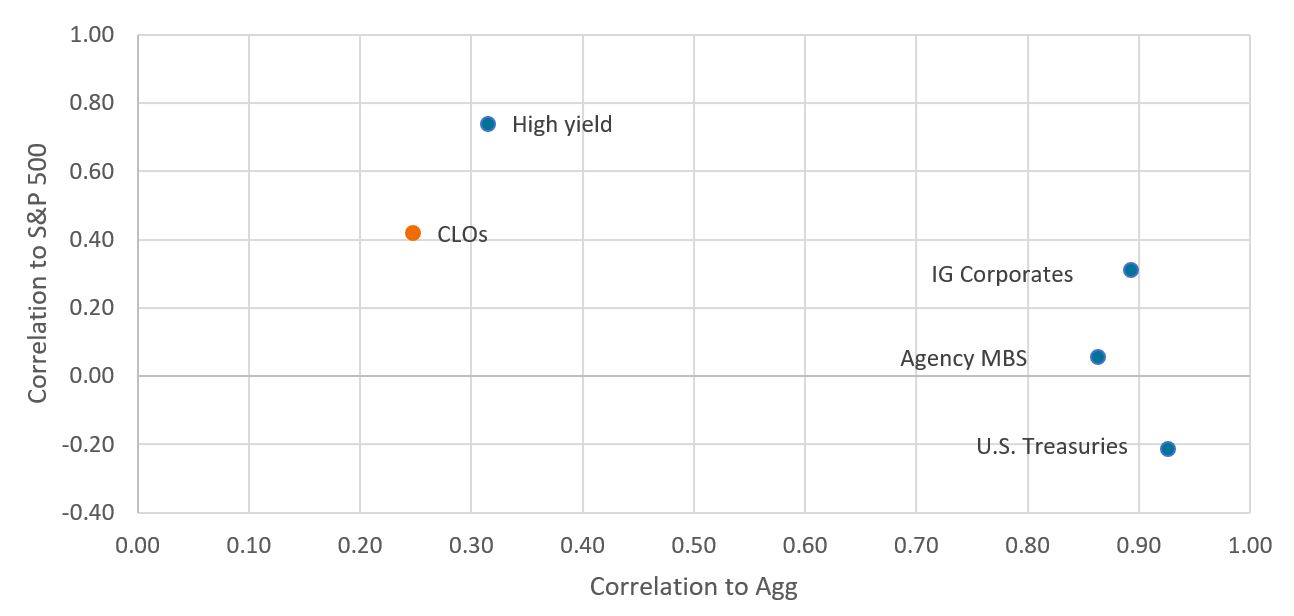
Source: Bloomberg, as of 31 July 2022.
Note: Monthly correlations for the 10-year period ended 31 July 2022. Please see end for indexes used to represent asset classes.
If we drill down to the asset class level, adding a 20% allocation of A rated CLOs to the Agg has resulted in improved risk-adjusted returns since 2012, as shown in Exhibit 2. Moving down to the sector level, the addition of CLOs would have resulted in an increase in return-to-volatility ratios, as shown in Exhibit 3. This is particularly important to investors who follow a risk-budgeting approach. If one can allocate risk more efficiently, it could free up risk in the budget that can be spent in other parts of the portfolio with higher return potential.
Exhibit 2: Comparing cumulative returns since 2012
Adding CLOs to the Agg would have improved risk-adjusted returns
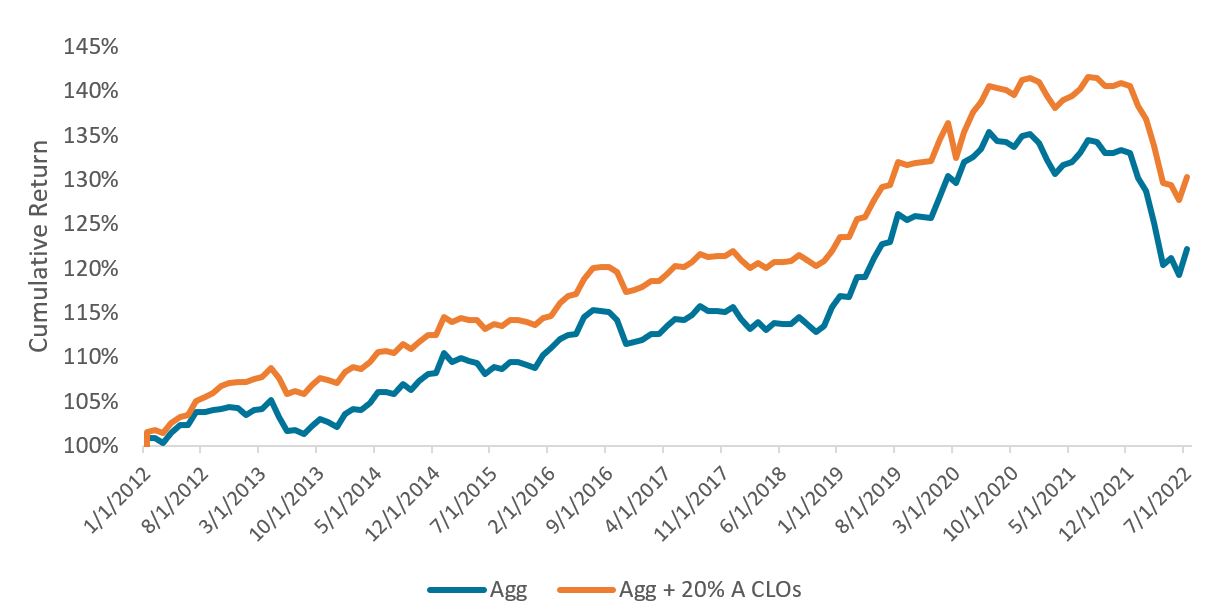
Source: Bloomberg, Janus Henderson Investors, as of 31 July 2022.
Note: Hypothetical backward-looking illustration showing cumulative total returns, with monthly rebalancing. Index performance does not reflect the expenses of managing a portfolio as an index is unmanaged and not available for direct investment. The performance of any index herein is not illustrative of the performance of any security. Please see end for indexes used to represent asset classes.
Past performance is no guarantee of future results.
Exhibit 3: The addition of CLOs would have improved return-to-volatility ratios
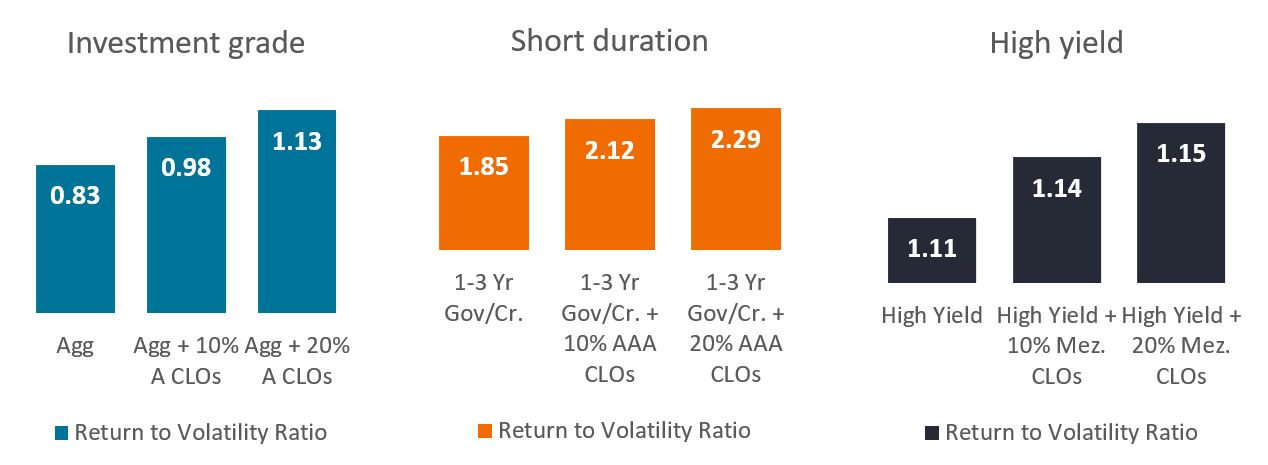
Source: Bloomberg, Janus Henderson Investors, as of 31 July 2022.
Note: Return to volatility ratios: Average rolling 1-year returns over average rolling 1-year volatility (based on standard deviation, a statistic that measures the dispersion of a dataset relative to its mean) from 1 January 2012 to 31 July 2022. Please see end for indexes used to represent asset classes.
Past performance is no guarantee of future results.
The present level of – and expectations for – short-term interest rates are key drivers of returns on CLOs. Because CLO yields are set relative to short-term benchmark rates, they are ultimately driven by the level of the federal funds rate. In its fight against persistently high inflation, the Federal Reserve (Fed) has aggressively raised its benchmark lending rate by 2.25% within the first 6 months of 2022, with futures markets pricing in at least an additional 1.25% before year-end. This increase in short-term rates has been positive for CLOs, as coupons continue to reset higher with each step up in interest rates. The result is that, in our view, yields on CLOs look attractive relative to alternative fixed income assets, as shown in Exhibit 4.
Exhibit 4: CLO yields look attractive relative to alternatives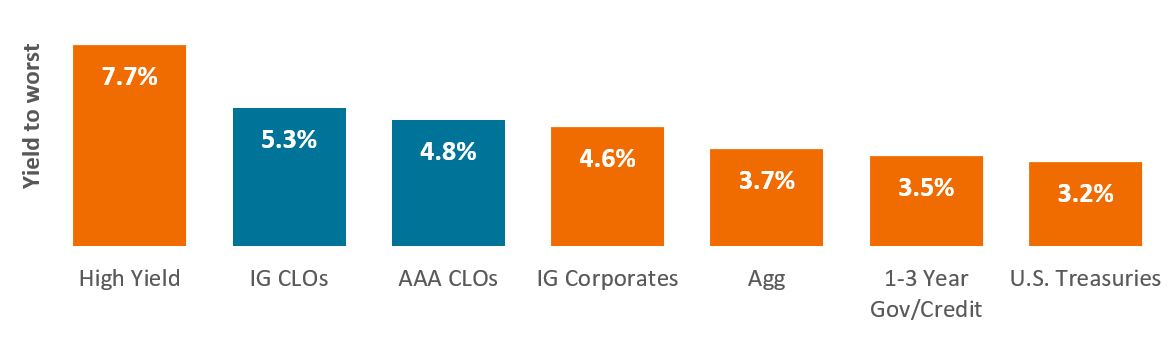
Source: Bloomberg, JP Morgan, as of 19 August 2022.
Note: Yield to worst is a measure of the lowest possible yield that can be received on a bond that fully operates within the terms of its contract without defaulting. Please see end for indexes used to represent asset classes.
Past performance is no guarantee of future results.
At present, CLOs are offering more yield spread over investment-grade corporates than at any point in the last 10 years, as shown in Exhibit 5. In our view, the additional yield and inherently ultra-low duration makes CLOs a compelling option for investors looking to diversify an existing corporate bond allocation.
Exhibit 5: Yield spread of CLOs over investment-grade corporates at historical highs
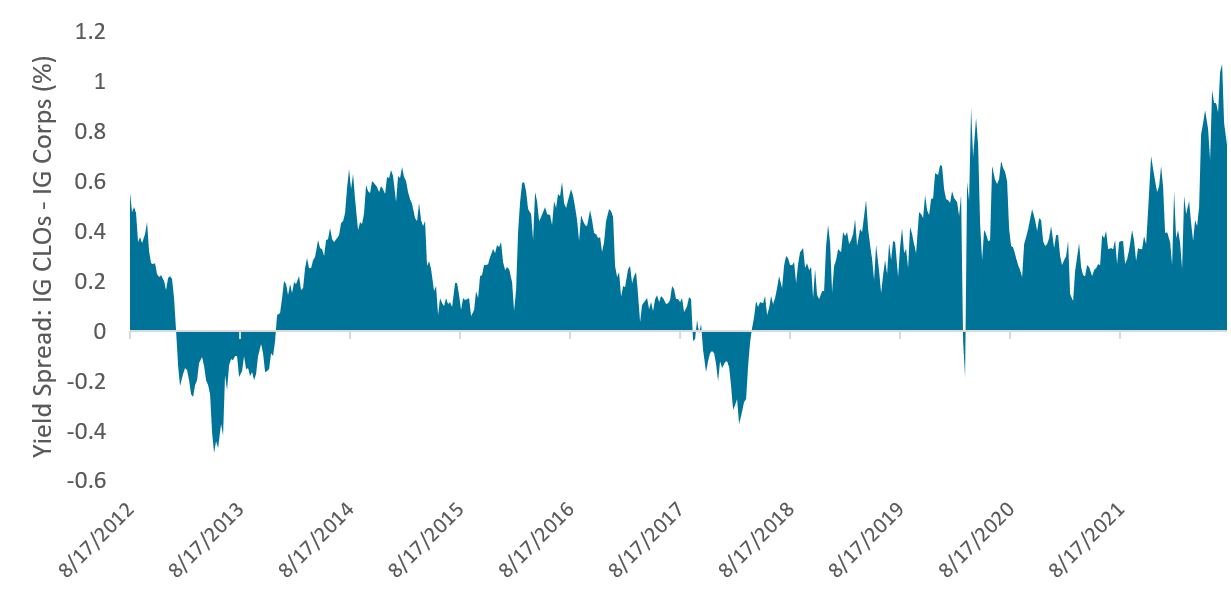
Source: Bloomberg, JP Morgan, as of 19 August 2022.
Past performance is no guarantee of future results.
While we believe the case for CLOs is presently compelling, the question that remains is what the progression of the federal funds rate will be through 2023 and 2024. There has been much debate on this issue, with no consensus either way. Even the market and the Fed seem to disagree, with the federal funds futures pricing in year-end rates of 3.50% and 3.17% in 2023 and 2024, respectively.5 This contrasts with the median of the Federal Open Market Committee (FOMC) dot plot6, which has factored in year-end rates of 3.75% and 3.375% in 2023 and 2024, respectively.
The difference in forecasts comes down to the expected trajectory of inflation and the possibility of economic slowdown. In our opinion, the futures market is implying that inflation will fall and economic growth will slow to such an extent that the Fed will have to start cutting rates again in 2023 to boost potentially lackluster economic growth. But the Fed has moved recently to dispel any hopes of early rate cuts, with Fed Chairman Jerome Powell stating in his speech from Jackson Hole that, “restoring price stability will likely require maintaining a restrictive policy stance for some time.” We tend to side with the Fed on this one, and while we do not know how high they will have to go to bring inflation under control, we do not believe they will be in a position to make substantial cuts in 2023. What does this all mean for CLOs? We think short-term rates will have to remain higher for longer, which should continue to provide support for coupon rates in particular, and for the asset class in general.
1 Year to date, as of 31 August 2022.
2 JPMorgan, as of March 31, 2021.
3 Tranches are segments created from a pool of securities that are divided up by credit rating, time to maturity, or other characteristics in order to be marketable to different investors.
4 JPMorgan, “CLOs: not the CDOs of yore,” June 2020.
5 As of 29 August 2022.
6 The Federal Open Market Committee (FOMC) is the branch of the Federal Reserve System that determines the direction of monetary policy. The FOMC dot plot is a chart that summarizes the FOMC’s outlook for the federal funds rate.
Indices used to represent asset classes: High Yield (Bloomberg U.S. Corporate High Yield Index), CLOs (JP Morgan CLOIE Index), IG corporates (Bloomberg U.S. Corporate Investment Grade Index), agency MBS (Bloomberg U.S. Agency MBS Index), U.S. Treasuries (Bloomberg U.S. Treasuries Index), Agg (Bloomberg U.S. Aggregate Bond Index), 1-3 Yr Gov/Cr. (Bloomberg 1-3 Year U.S. Gov/Credit Index), AAA CLOs (JP Morgan AAA CLOIE Index), A CLOs (JP Morgan A CLOIE Index), , Mez. CLOs (JP Morgan Mezzanine CLOIE Index).
Bank loans often involve borrowers with low credit ratings whose financial conditions are troubled or uncertain, including companies that are highly leveraged or in bankruptcy proceedings.
Collateralized Loan Obligations (CLOs) are debt securities issued in different tranches, with varying degrees of risk, and backed by an underlying portfolio consisting primarily of below investment grade corporate loans. The return of principal is not guaranteed, and prices may decline if payments are not made timely or credit strength weakens. CLOs are subject to liquidity risk, interest rate risk, credit risk, call risk and the risk of default of the underlying assets.
Correlation measures the degree to which two variables move in relation to each other. A value of 1.0 implies movement in parallel, -1.0 implies movement in opposite directions, and 0.0 implies no relationship.
Credit quality ratings are measured on a scale that generally ranges from AAA (highest) to D (lowest).
Credit Spread is the difference in yield between securities with similar maturity but different credit quality. Widening spreads generally indicate deteriorating creditworthiness of corporate borrowers, and narrowing indicate improving.
Diversification neither assures a profit nor eliminates the risk of experiencing investment losses.
Standard Deviation measures historical volatility. Higher standard deviation implies greater volatility.
Index performance does not reflect the expenses of managing a portfolio as an index is unmanaged and not available for direct investment.
Sign up for timely perspectives delivered to your inbox.