
Subscribe
Sign up for timely perspectives delivered to your inbox.
While the macroeconomic environment remains challenging, the Portfolio Construction and Strategy Team believes investors should consider active technology strategies that focus on profitable companies, given technology’s critical role in shaping our future.


This article is part of the latest Trends and Opportunities report, which seeks to provide therapy for recent market shocks by offering long-term perspective and potential solutions.
Cash is king and fundamentals matter more than they have in the past 10 years.
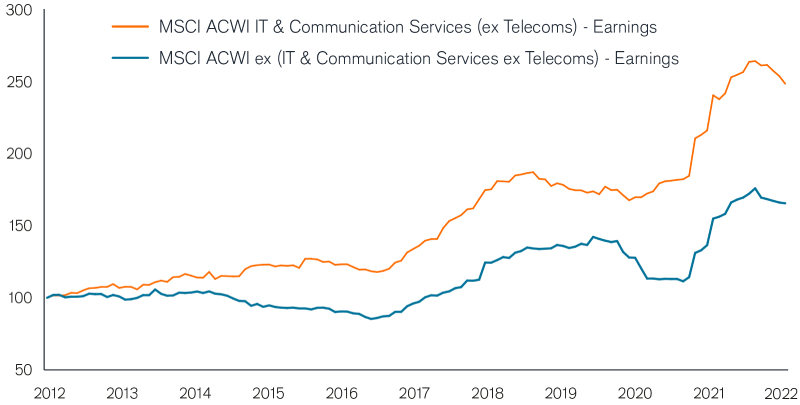
Source: Janus Henderson Investors, Bernstein, as at 31 August 2022.
Note: Rebased to 100 at 31 May 2012. Tech sector earnings chart compares Earnings in the MSCI ACWI IT & Communication Services (ex Telecoms) Index to the MSCI ACWI (exIT & Communication Services ex Telecoms) Index. Based on trailing earnings. Prior to December 2018, the custom index of MSCI ACWI IT & Communication Services includes companies that were originally in the Technology sector and companies that are currently in the Communication Services sector.
| Sector | Net Cash as % of market cap | EV/FCF Yield |
|---|---|---|
| Information Technology | -1% | 3 |
| Health Care | -9% | 5 |
| Consumer Staples | -13% | 4 |
| Consumer Discretionary | -15% | 4 |
| Materials | -16% | 6 |
| Energy | -17% | 9 |
| Communication Services | -19% | 5 |
| Industrials | -26% | 4 |
| Utilities | -65% | 2 |
Source: Janus Henderson Investors, Credit Suisse, as at 11 July 2022. Data is for MSCI World Sector Indices excluding the Financials sector. Net cash shows total cash on the balance sheet minus debt, cash shows purely the cash on the balance sheet. ’Net cash as % of market cap’ is a measure of the net cash on a company’s balance sheet as a percentage of its total market capitalisation. EV/FCF yield is the reciprocal of the Trailing Enterprise Value (EV)/ Trailing Free Cashflow (FCF).