Subscribe
Sign up for timely perspectives delivered to your inbox.


When the road looks rough aheadRandy Newman, You’ve Got a Friend in Me
And you’re miles and miles
From your nice warm bed
You just remember what your old pal said
Boy, you’ve got a trend in me”
The recent end to a 40-year cycle of falling yields for developed market bonds, combined with rumblings of a potentially protracted global recession, geopolitical tensions, commodity supply constraints and stubbornly high inflation, have played havoc with global stock, bond and currency markets.
In these environments, the question of true diversification naturally comes to the fore for investors. Trend following as a strategy has a well-documented track record of providing crisis alpha[1], with the potential to generate absolute returns during periods of heightened dislocation. However, the growing talk of a global recession warrants further analysis to understand whether trend following as a strategy offers, more specifically, recessionary alpha. In other words, how have such strategies really performed during historic instances of recessions?
For the sake of consistency, we will look at US recessions as defined by the National Bureau of Economic Research (NBER) and analyse the performance of a basic modelled trend strategy during these periods. The model parameters for the strategy are shown in the appendix.
Exhibit 1 shows the theoretical returns of a basic trend following strategy compared to other asset classes and portfolios during specific periods. The winners and losers in each recession depended on the causes (or drivers) of each recession. What stands out is that the model trend strategy had a 100% hit rate during these seven recessions, with a median return of 13.4%. The only other asset class that has a similar hit rate are bonds, with a lower median return (8.3%). This highlights the potentially material portfolio benefits of a trend-following strategy during recessionary periods.
Exhibit 1: Returns of strategies, asset classes and portfolios for each recession since 1970
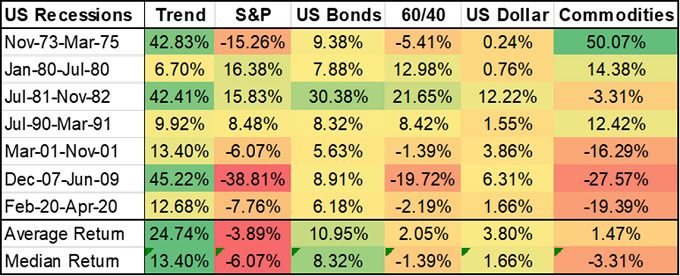
Source: Bloomberg, Janus Henderson Investors, November 1973 to April 2020. Past performance does not predict future returns. Note: S&P is the S&P 500 Index; US Bonds is the Bloomberg US Treasury Total Return Index; ’60/40′ is a simple model portfolio with 60% exposure to the S&P500 Index and 40% exposure to US bonds; Commodities is the Bloomberg Commodity Index (Total Return); US dollar is the US Dollar Index.
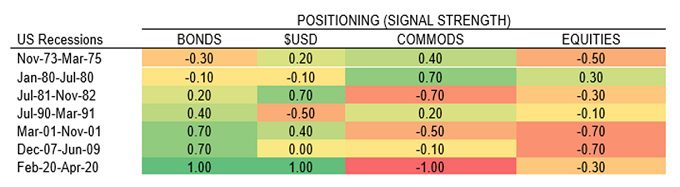
Exhibit 2 shows the average positioning of the model trend strategy in each recession, which provides some interesting insights:
Source: Bloomberg, Janus Henderson Investors, November 1973 to April 2020. Past performance does not predict future returns. Note: Equities is the S&P 500 Index; Bonds is the Bloomberg US Treasury Total Return Index; Commodities is the Bloomberg Commodity Index (Total Return); $USD is the US Dollar Index.
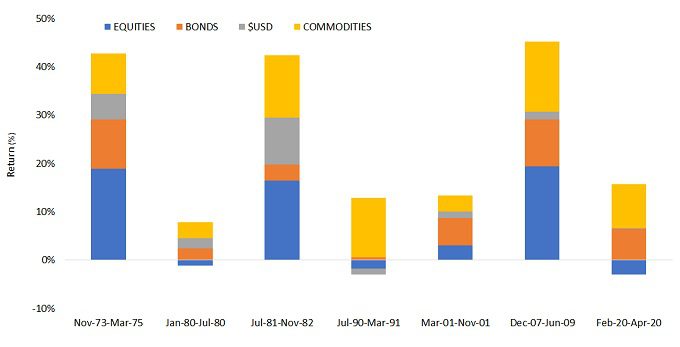
Trend-following returns have been positive in each of the historic recessions considered; however, the attribution of returns varied in each instance. While the general perception is that long bond positioning has generated the bulk of returns for a trend-following strategy, data highlights that commodities and stock indices provided some of the best opportunities during recessionary times, followed by bonds. The least attractive sector over time during these periods has been currencies, which in the last four recessions have essentially generated no positive return. This does not however discount the diversification benefits of currencies in a diversified trend strategy; there is no ability to predict when trend following will work and which sectors could drive returns.
Herein lies one of the key strengths of trend following – while traditional assets have relatively static long-only weightings, trend following provides much more optionality, having the ability to be long or short in one or more asset classes, where there are persistent trends. This ‘shape shifting’ nature allows a trend strategy to be positioned as a stock, bonds, commodity or currency portfolio as needed, based upon the prevailing trend(s) and macroeconomic regime, be it growth or recessionary.
With news and data flow providing an increasing tempo of recessionary war drums, the final observations of note relate to market conditions over the first half of 2022 and the general evolution of positioning for trend following between December 2021 and the end of June 2022.
Positioning at the end of 2021 highlighted generally ‘risk on’ views, with the highest-conviction positions long of stock indices and commodities. Fast forward six months, with recession calls increasing, model positioning as at the end of June highlights a very different portfolio, with much more defensive positioning – short of stock indices and commodities, and long the US dollar. Trend following does not seek to provide a forecast but adapts to market conditions, both in terms of directional view and the appropriate amount of risk to take.
This highlights one of the better-known aphorisms in finance (variably attributed to John Maynard Keynes and Paul Samuelson) – When events change, I change my mind. What do you do?”
As a strategy, trend following has provided a historically strong source of positive returns during various market regimes, including periods of inflation, stock market corrections and recessions. While trend following does not generate positive returns all the time, it continues to prove robust to market dislocations and broader market stress. The features that provide this resilience – the ability to be diversified across major asset classes, the optionality in modulating leverage to adapt to periods of higher volatility, and the ‘willingness’ to be long and short across a universe of securities – underpin the inherent antifragility of trend following, and potential to generate a unique source of alpha, often when it is most needed.
[1] Please note – past performance does not predict future returns.
Appendix ExpandAppendix:
For more on the NBER definition of recessions:
https://www.nber.org/research/data/us-business-cycle-expansions-and-contractions
Trend model parameters
For this paper, we have used a basic trend beta model that takes long and short positions across US equities, US bonds, the US dollar, and commodities. A 12-month lookback period is used to determine the underlying trend, the rebalance frequency is monthly, and the portfolio is scaled to target 12-14% ex-post volatility. This model is our proxy for long-term trend returns for the purposes of comparative analysis across various economic regimes. US markets are used in the modelling as they provide a good proxy for developed market asset class returns and exhibits a relatively high correlation to the SG Trend Index.
Investment universe:
Note: The hypothetical, back-tested performance shown in this model for illustrative purposes only and does not represent actual performance of any client account. No accounts were managed using the portfolio composition for the periods shown and no representation is made that the hypothetical returns would be similar to actual performance.