I’ll have one of everything, please
The case for a more diversified fixed income portfolio Copy
-
 Helen Anthony, CFA
Portfolio Manager
Fixed income assets have had a tumultuous start to the year. Portfolio Manager Helen Anthony discusses where we go from here and how investors should think about asset allocation when there are so many risks.
KEY TAKEAWAYS
- While the US Federal Reserve finally made their ‘transitory inflation’ term redundant, we believe it could be resurrected in the second half of 2022, given that core personal consumption expenditures (PCE) inflation is set to fall towards the end of the year and into 2023.
- Stagflation, and memories of the episode in the 1970s, are top of mind these days but arguably, we are not at that stage. Among other reasons, back then we had high inflation, low growth but also high unemployment.
- Within fixed income markets, by our measures, given the tough time across the fixed income spectrum at the start of this year, the majority of these asset classes now stand to offer reasonable value. In such an environment, we believe the best course of action is diversification.
What a start to the year we have had. It has been the worst on record for fixed income asset classes across investment grade, high yield and “safe haven” bonds (such as US Treasuries) in the last 20 years. But where do we go from here, and how should we think about asset allocation when there are so many risks impacting fixed income returns across the spectrum? To illustrate, since the start of the year, global government bonds are down 4.1%, global high yield is down 7.5% and emerging market debt stands at ‑10.1%1.
Bottlenecks: are they fading yet? Inflation: is it starting to fall? How will The Russia/Ukraine conflict progress? What happens to growth?
The picture coming into the year
2021 brought with it multiple events; the last quarter saw the peak in growth in the US. 2022 is forecast to reveal a downtrend (quarter‑on‑quarter), but the full year growth rate should be pretty strong with median expectations (in real terms) at 3.6%2.
As for inflation, last year the US Federal Reserve (Fed) finally made its ‘transitory’ term redundant for 2022. Inflation is expected to stay high in the first half of the year, but we believe this is where ‘transitory’ can come into play. Even with a prolonged period of higher inflation due to the fallout of the Russia/Ukraine conflict, core personal consumption expenditures (PCE) inflation is forecast to fall towards the end of the year. We caveat this with the fact that inflation projections have risen and core PCE is expected to be approximately 3% a year from now, which is around 0.7% higher than what was expected when we entered the year3.
So, we have a period of high inflation while growth is set to fall. Is this stagflation?
If transitory was 2021’s buzzword, then 2022’s buzzword (so far) is stagflation. What does this mean in the context of the outlook for growth, why does it matter for central banks and how should portfolios be set up to maximise this?
Stagflation can be defined in multiple ways. However, typical conditions for stagflation would be rising inflation, stagnating growth and rising unemployment. Policymakers generally struggle in these periods, given they have the choice of bringing down inflation (by raising rates, which also exacerbates the growth impact by slowing down credit growth) or tackling the low growth environment directly by cutting rates. Regardless of which path they follow, either inflation or growth will suffer.
Why isn’t this the ‘stagflationary’ period of the 70s?
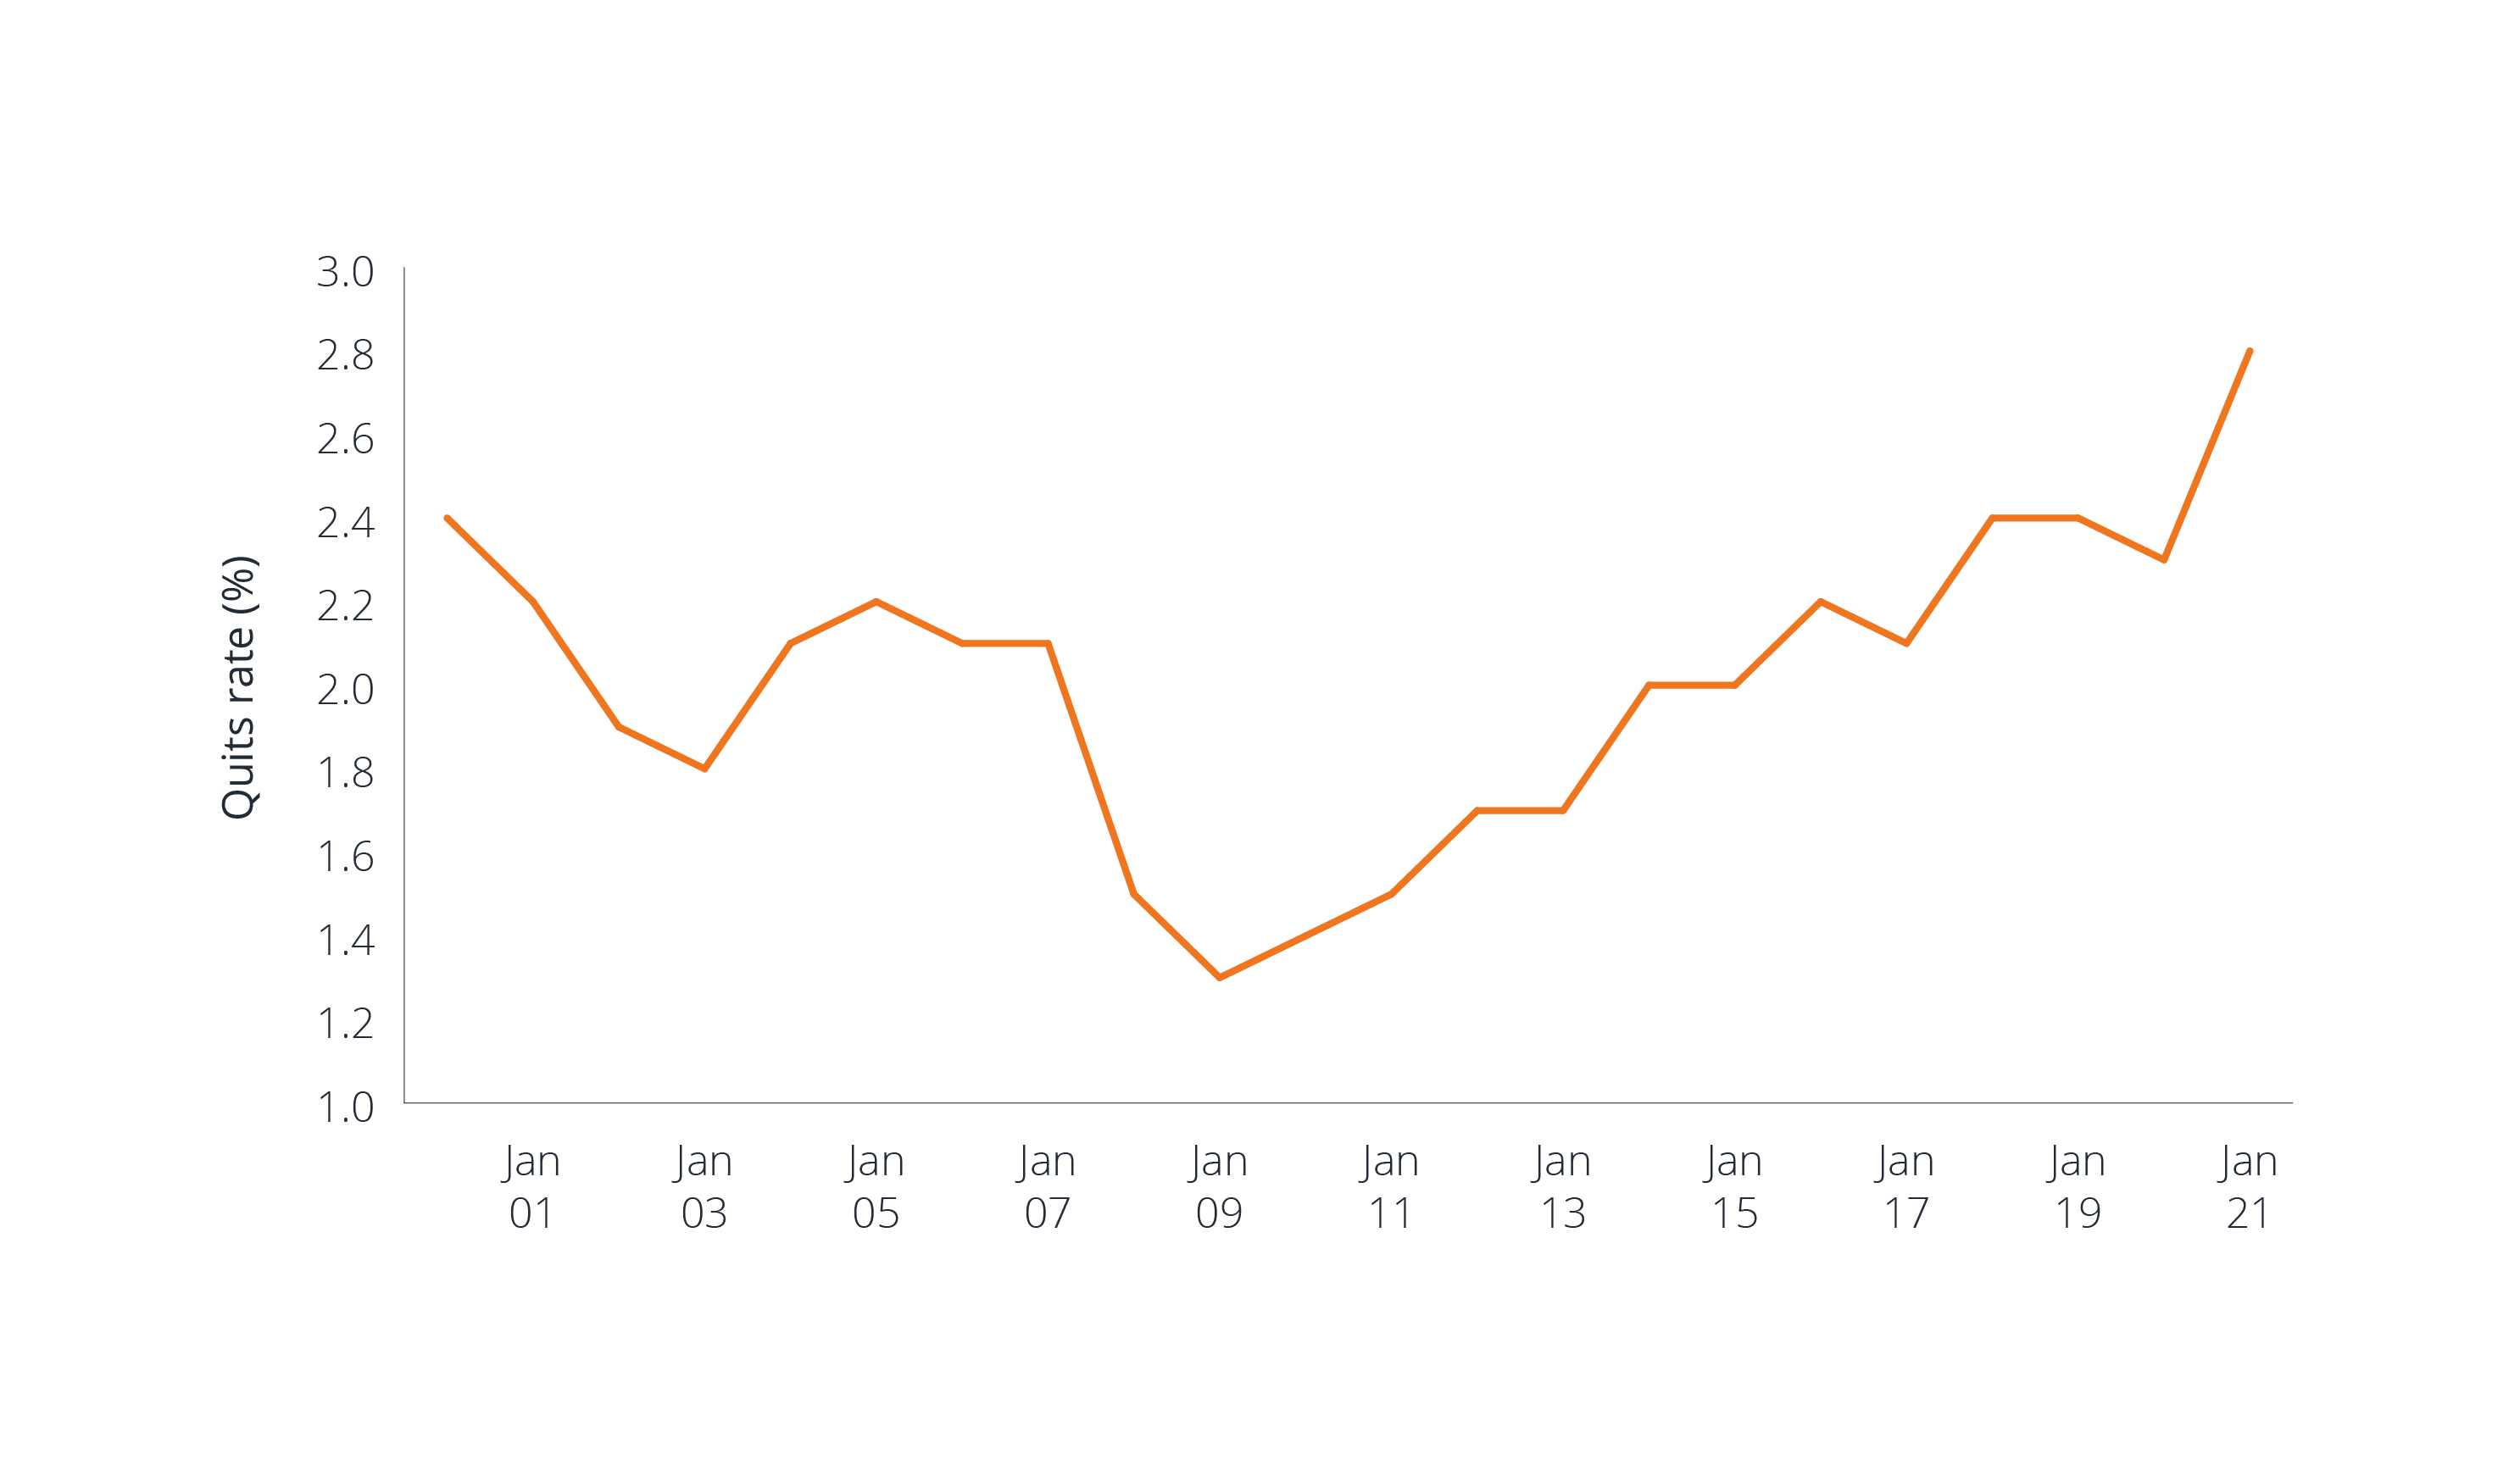
The environment that we saw in the 1970s was one of high inflation and low growth but also high unemployment. While today we have divergent growth and inflation due to supply shocks, the US labour market looks extremely solid and some of the more forward-looking indicators such as the Job Openings and Labor Turnover Survey (JOLTS)’s quit numbers, still suggest that this is set to continue (Figure 1). Let us not forget, we are coming out of one of the sharpest recessions in history (the cycle has been particularly short), but with the fiscal stimulus that we saw in 2020, the consumer is in a much healthier starting point than may have otherwise been the case.
Figure 1: JOLTs job quits at highs
 Source: US Bureau of Labor Statistics, Janus Henderson Investors, as at 10 March 2022.
Note: the ‘quits rate’ is the number of quits during the entire month as a percentage of total employment. The January 2022 figure is preliminary.
Even allowing for oil shocks, where economists estimate that every 10% rise in the price of oil takes roughly 0.1% off the US growth rate, when you look at the starting point for growth relative to recent history, real growth is predicted to be extremely strong. Since 2015, real gross domestic product (GDP) growth in the US has hovered in a range of 1.7-2.9% but is predicted to be 3.6% for 2022, despite falling to ‑3.4% in the pandemic. This means that while inflation is high, nominal growth is set to be even better and outpace inflation.
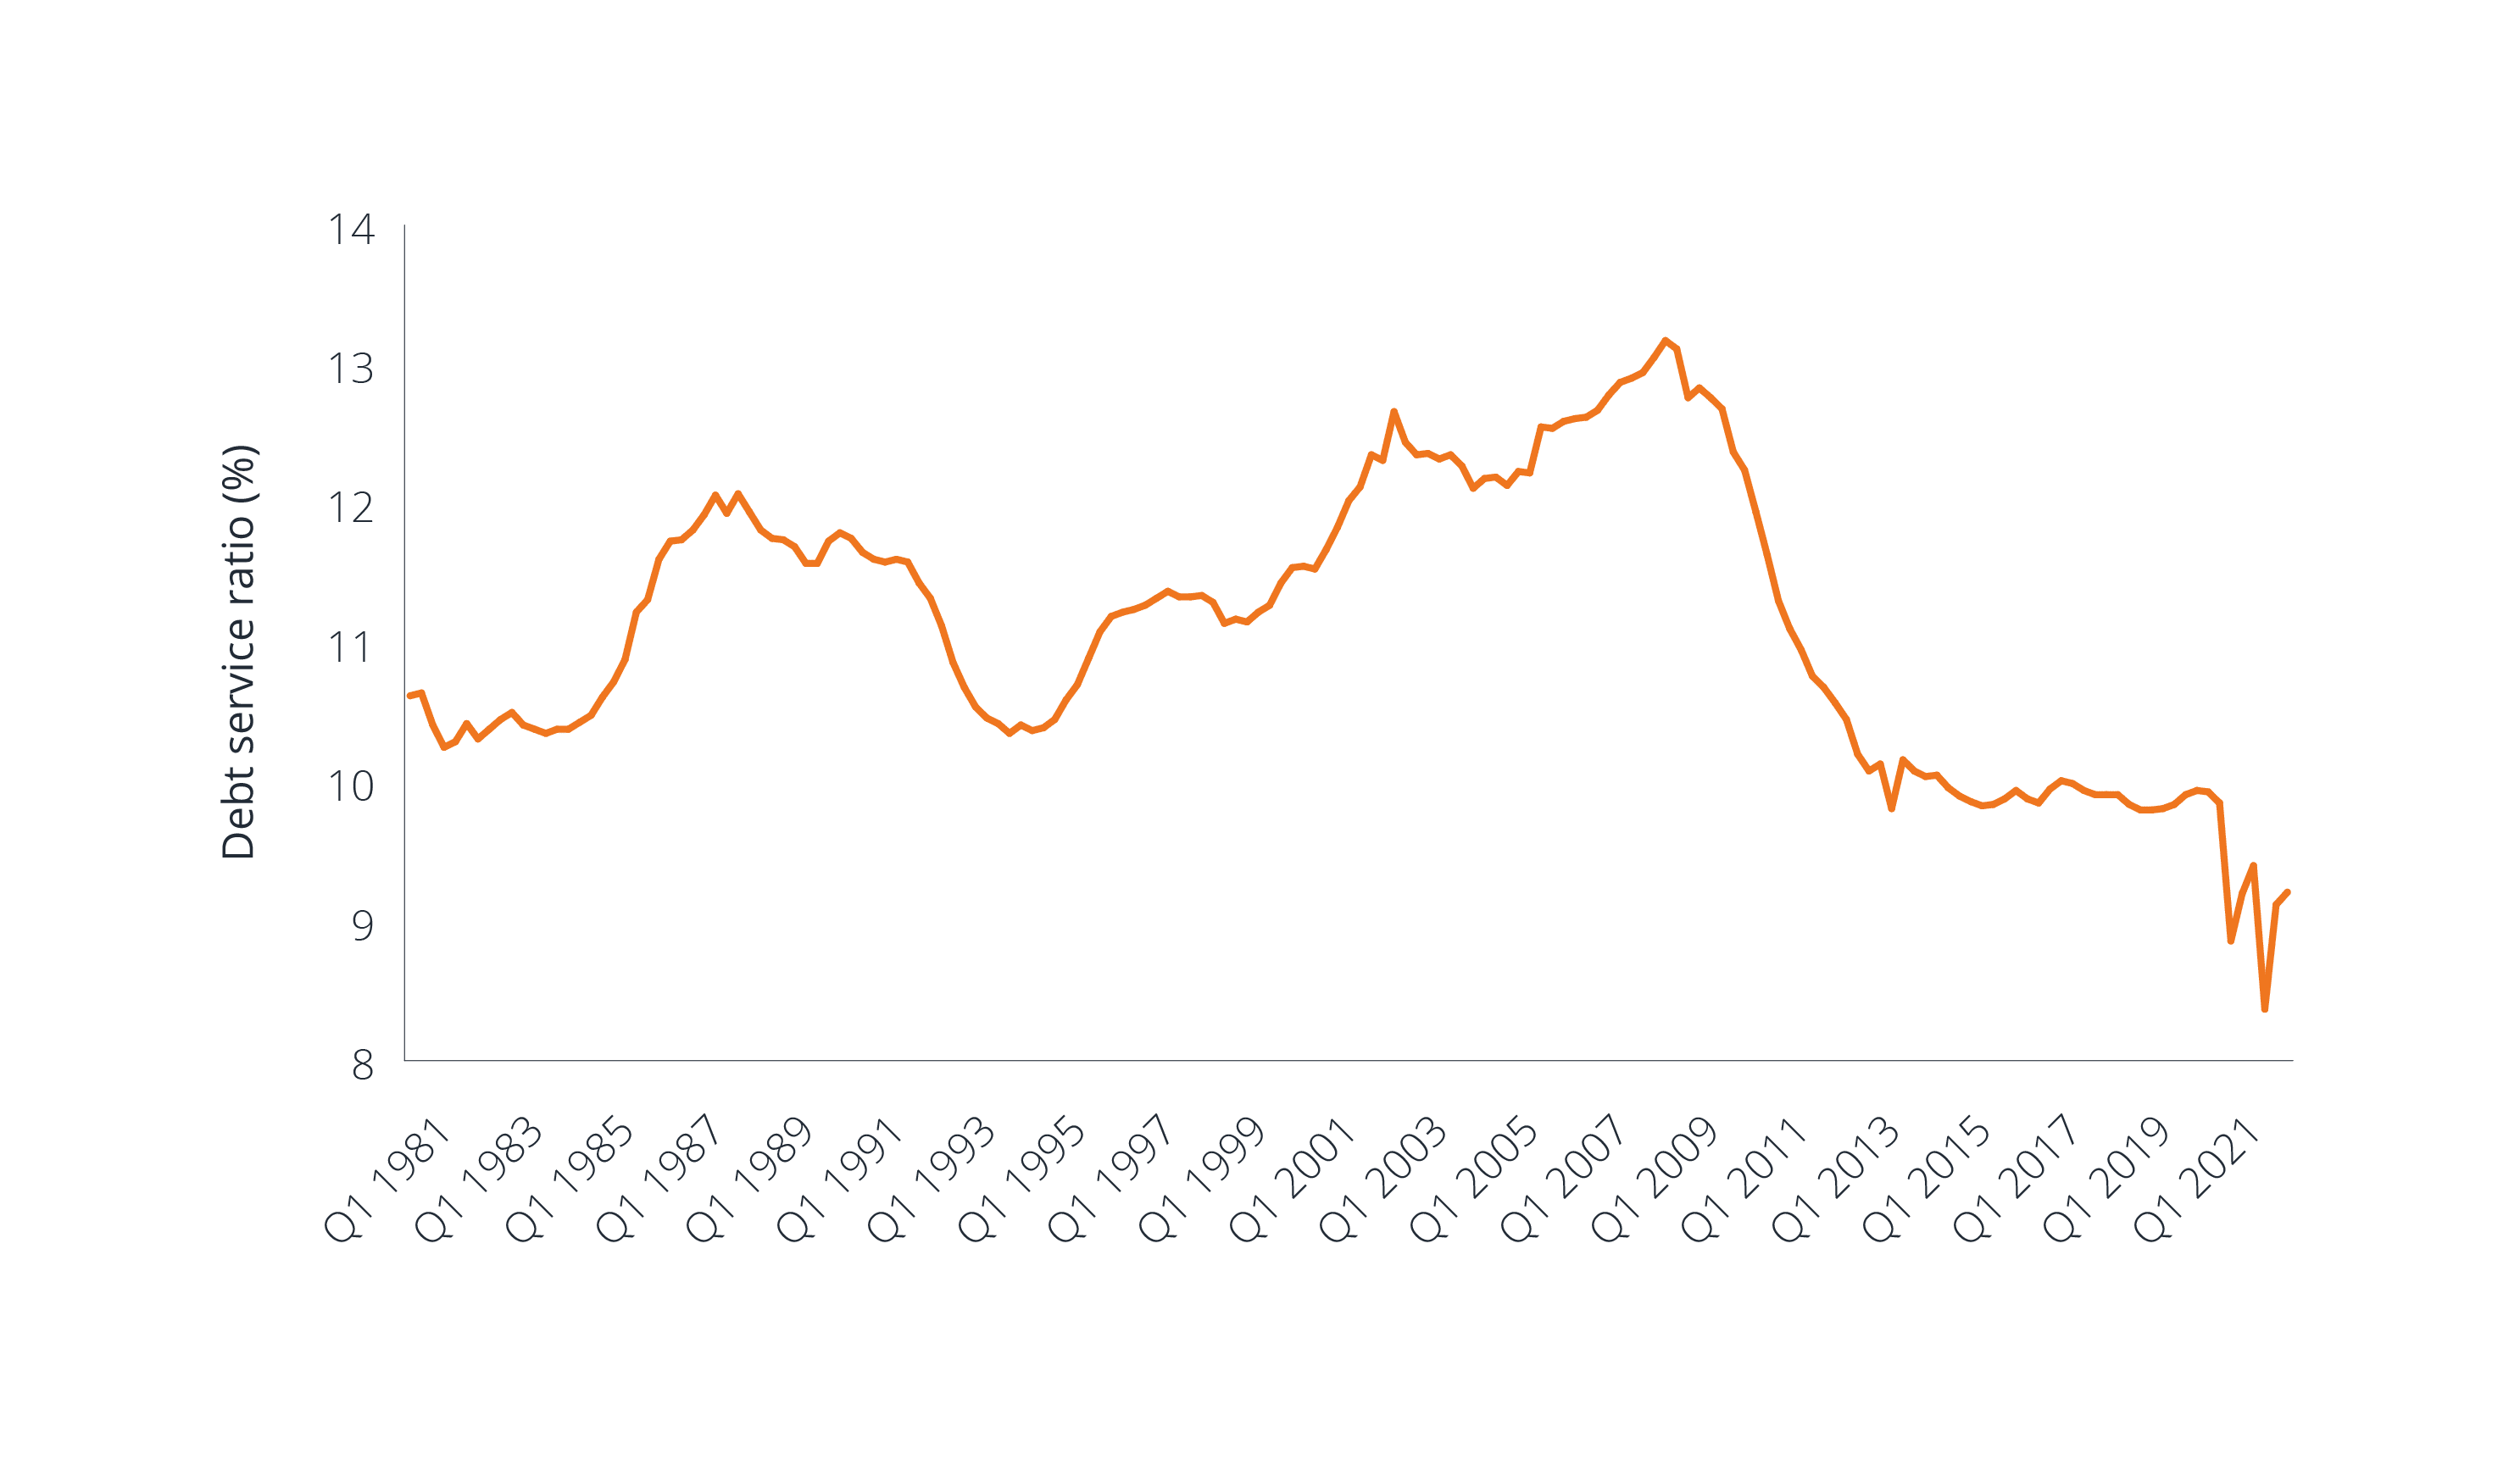
Further, as mentioned earlier, consumers are starting from a much better place. During the pandemic, they were forced to save more of their income given the lockdown measures that took hold, which drastically reduced the ability to spend. Thus, we believe that the consumer (in aggregate) should be able to handle the increase in energy costs in the short term. Figure 2 shows how the debt service ratio (ie, the ratio of household debt payments to disposal income) is very low relative to history.
Figure 2: Debt service ratio is at its lowest in over 40 years
 Source: Board of Governors of the Federal Reserve System (US), Janus Henderson Investors, as at 7 January 2022.
Note: household debt service payments as a percentage of disposable personal income, seasonally adjusted.
Finally, lower wage workers across the US and other developed markets have seen some of the largest increases in salary, which should go some way towards helping to negate the impact of rising prices. Thus, while we are not forecasting much higher growth, we expect some relative containment in terms of how far growth could fall. Growth expectations in the US, while declining in 2022, were still pretty good as a starting point coming into the year. Even a one percentage point reduction from the expected growth (in an aggressive scenario) should still leave us with positive real growth and an environment where the Fed can continue to raise interest rates.
It is worth noting that the US may stand alone from this perspective. Europe and the UK may suffer much more due to their reliance on oil and the fact they are net importers of the commodity. Nevertheless, the true fallout from the rise in oil prices is yet to be determined, since the situation is extremely fluid at present.
Given our central expectation is not a recession, particularly in the US, where now for investment opportunities?
Based on our internal models, fixed income assets – across the board – have experienced somewhat of an aggressive repricing over the last few months. High yield corporate bond spreads have widened significantly (even before the Russia/Ukraine situation). Investment grade spreads widened too, but the asset class also suffered negative total returns as a result of the aggressive moves higher in interest rates since the latter half of last year. However, unlike the last year and a half, government bonds have repriced to be more optimistic (ie, pricing in interest rate hikes) and to some extent are also pricing in a higher inflationary scenario.
It has been suggested that it is somewhat of a surprise that rates have not fallen more during the Russia/Ukraine conflict. It is worth noting that monetary policy arguably has been too loose leading up to this period, and inflation will take longer to fall back. But we have gone from market expectations for six and a half interest rate hikes to four this year, and back up to six hikes more recently. The Fed has limited reason to ignore the markets and be aggressively dovish given where growth, inflation and unemployment is – even allowing for some downgrades to expectations.
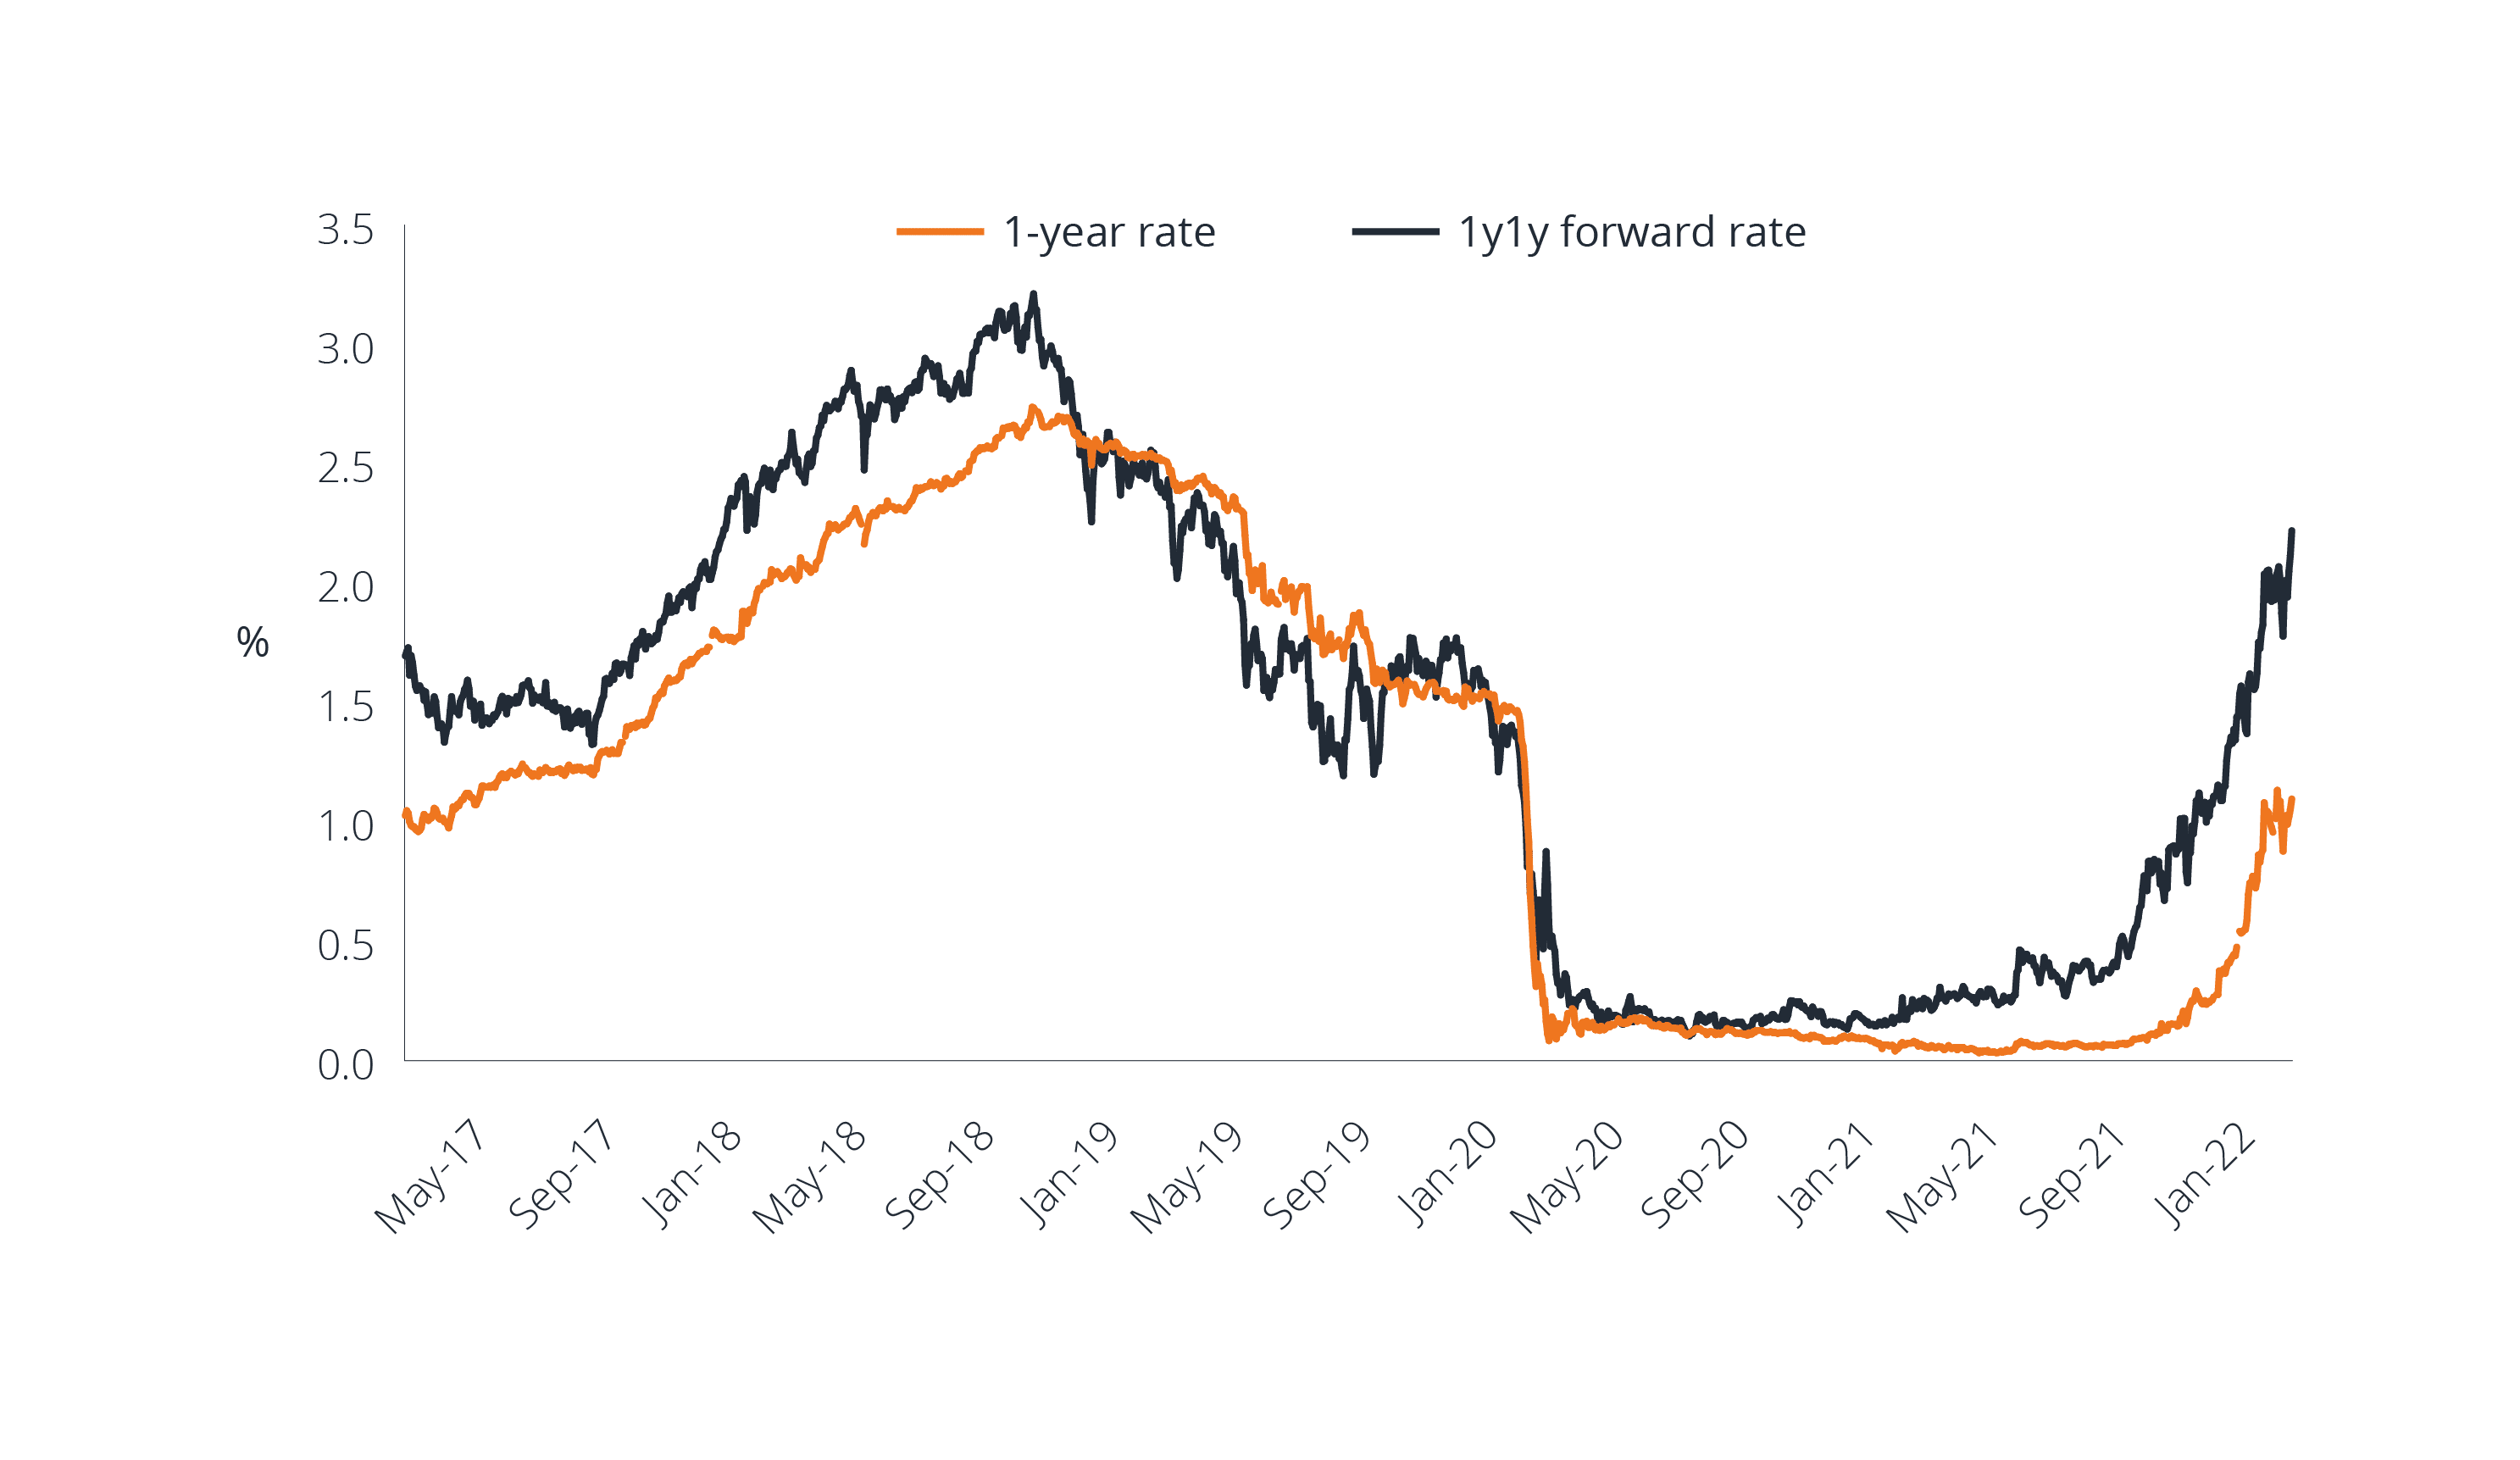
If we look at 1‑year government bond rates in the US (Figure 3), you would be forgiven for thinking rates have lots more room to move higher. That is where forward (yield) curves come into play, where they are currently pricing the 1-year rate in one year’s time at around 2%. Figure 3 shows that we have come a long way since mid‑2021. Hence, asset classes that offer “safe haven” could be described as having some value in a more risk‑off climate or, should inflation and growth prove to be not as strong as expected over the longer run.
Figure 3: 1-year rates have come a long way since mid-2021
Credit has gone through an aggressive repricing. It was the market that led the way post the COVID correction (where bond spreads tightened steadily as conditions improved) but where now, given that high yield bond spreads are currently trading at around 500 basis points (bps)?
Despite the widening in spreads, there has been limited – if any – increase in default rate expectations. Default rates in the US and Europe were near record lows in 2021 and it is widely expected that this is set to remain in 2022. One way to examine default rates is to extract the rate implied by current bond spreads. The table in Figure 4 is a simplistic scenario, doing just that.
Figure 4: Default rate implied by current euro high yield bond spreads
| Euro high yield spreads | 500 bps | Option-adjusted spread over equivalent government bond comprised of: | |
| Median excess spreads | 300 bps | ‘Credit spread’, the extra premium for being a high yield issuer | |
| Losses priced in | 200 bps | Extra premium priced in by the market to compensate for losses due to current risks (geopolitics, inflation, policy mistake) | |
| Assumed recovery rate | 50% | Assuming a 50% recovery scenario | |
| Implied default rate | 4% | Calculated by dividing the 200 bps by 50% (200/0.5) = 400 bps or 4% |
Note: Figures in the table are for illustrative purposes only. The option adjusted spread on the ICE BofA Euro High Yield index was 474bp on 15 March 2022. There is no guarantee that past trends will continue, or forecasts will be realised.
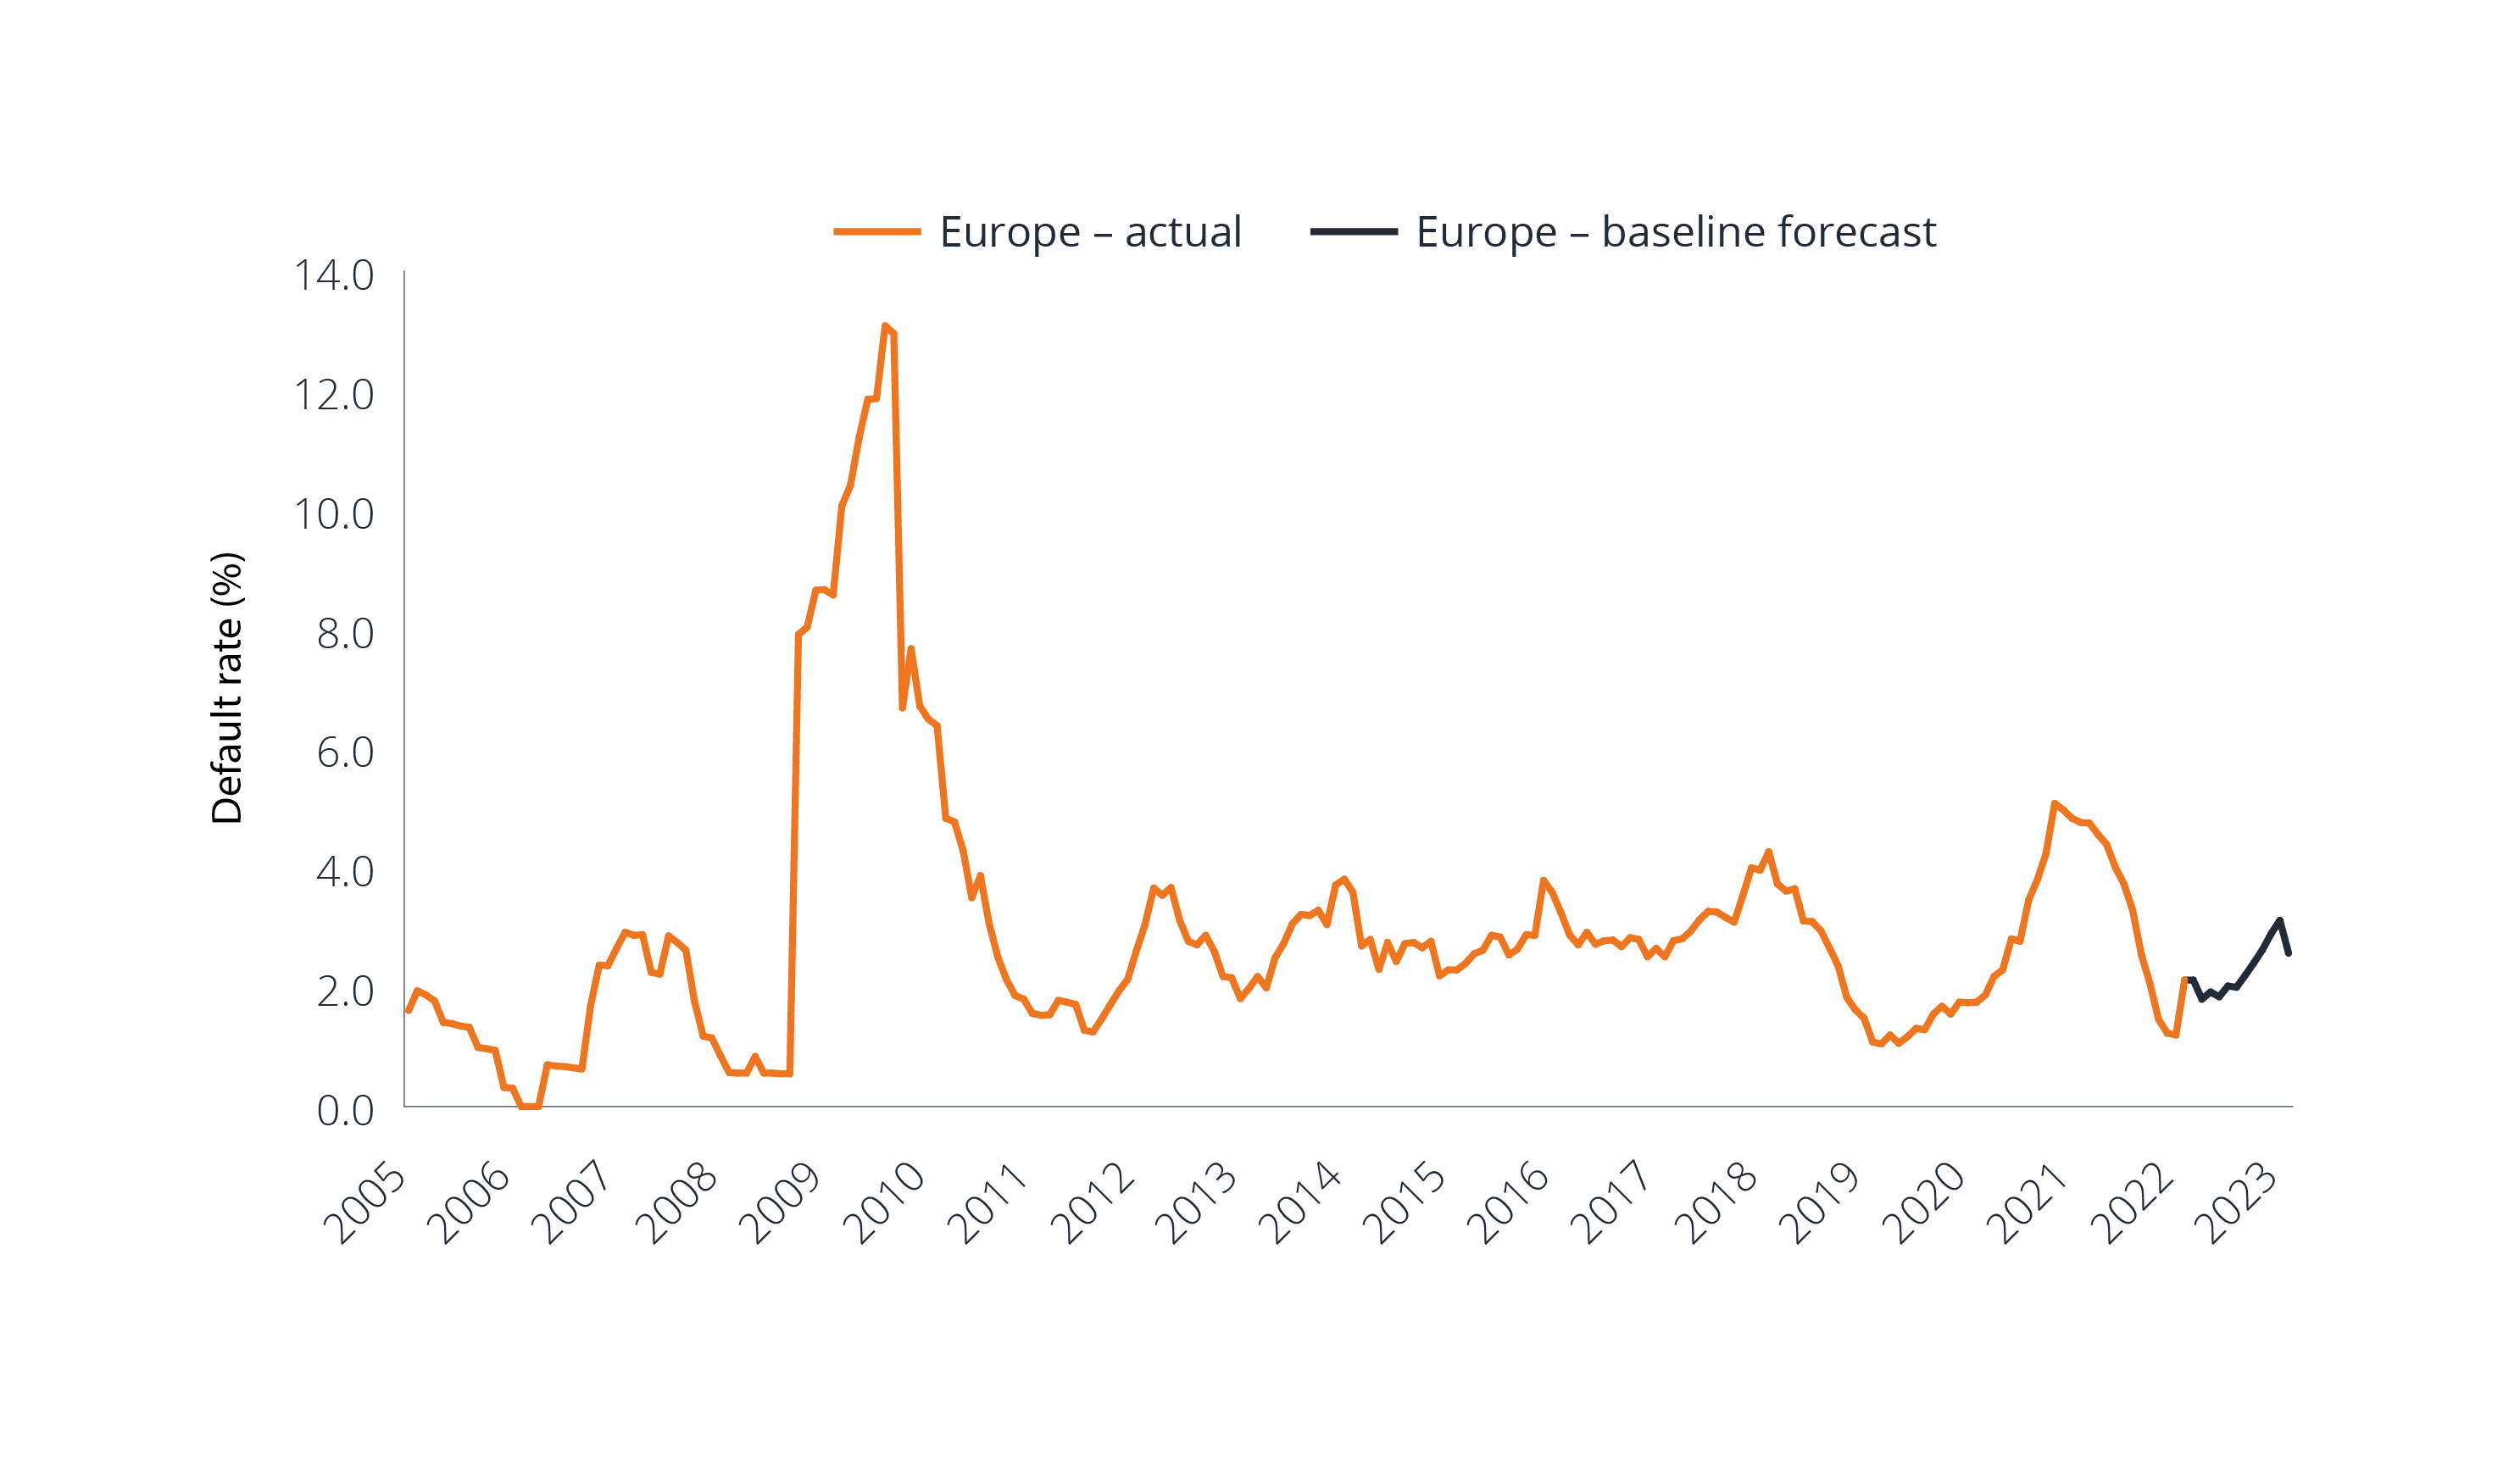
Using this simplistic view of credit spreads, a default rate of 4% is implied for the European high yield market. To put this into some context, there has only been one period over the last 15 years where defaults have been higher than this, which was 2009 (see Figure 5) – including most recently during the pandemic, where entire economies were shut down around the globe. Moreover, and helpfully, while spreads could continue to move wider, there is a coupon on offer within credit, which should be factored in when investing with a longer‑term horizon.
Figure 5: Default rates and expectations for European high yield markets
 Source: Moody’s, Janus Henderson Investors, as at 28 February 2022.
Note: Issuer weighted annual default rates.
A final observation
With credit already pricing a much weaker outlook (as evidenced by the wider spreads), and rates having repriced (higher yields) to reflect a higher inflationary scenario, where to now?
In our view, there is currently no single asset class that stands out as being particularly mispriced. Hence, a diversified portfolio of fixed income assets might be beneficial at this point in the economic cycle. Given that correlations between different assets are rarely one (ie, a perfectly positive relationship between two assets and their price moves), there is typically a diversification benefit in owning multiple asset classes, which can offer higher risk‑adjusted returns. The benefit of this approach to asset allocation is that it provides the ability to be more nimble, if and when, certain fixed income sectors look mispriced in the future. Furthermore, given the repricing that has been evident in rates markets, there is now more protection on offer should we approach an end of cycle scenario much more quickly than originally assumed.
1 ICE BofA indices, Bloomberg, as at 15 March 2022.
2 US real gross domestic product (GDP) growth, Bloomberg, as at 17 March 2022.
3 Bloomberg, as of 17 March 2022