
Subscribe
Sign up for timely perspectives delivered to your inbox.

Portfolio Manager Aneet Chachra updates strategist predictions for year-end and looks at the growing gap between the market and forecasts.
In December 2021, we wrote a note – The Average Outcome (Almost) Never Happens -demonstrating how historically unusual it is for the predicted 8% gain in the S&P 500® Index over one year to occur. At the end of March 2022, we published another article, One Down, Three to Go, showing that a negative first quarter has historically been associated with higher volatility over the rest of the year.
The second quarter of 2022 indeed turned out to be wild. Cumulatively, the S&P 500 is down -21% year to date, the fourth-largest first-half decline in the last 95 years. Bond performance was even more unusual – U.S. 10-year Treasuries returned -12% year to date, which we estimate is the biggest drop in history for the first half.
With half the year over, it seems appropriate to refresh stock market estimates and see what the last six months of performance can tell us about the next six.
Exhibit 1 updates the same panel of strategists we have been tracking since December to incorporate their latest data. Although the S&P 500 fell -16% in the second quarter, the average forecast for year-end fell by only -7%.
Strategists, on average, expect the S&P 500 to finish the year at 4,482, which would be 18% higher than its current price level. And while the dispersion of expected outcomes has widened modestly, every strategist sees the market rising over the rest of 2022.
Exhibit 1: S&P 500 Strategist Estimates for the End of 2022
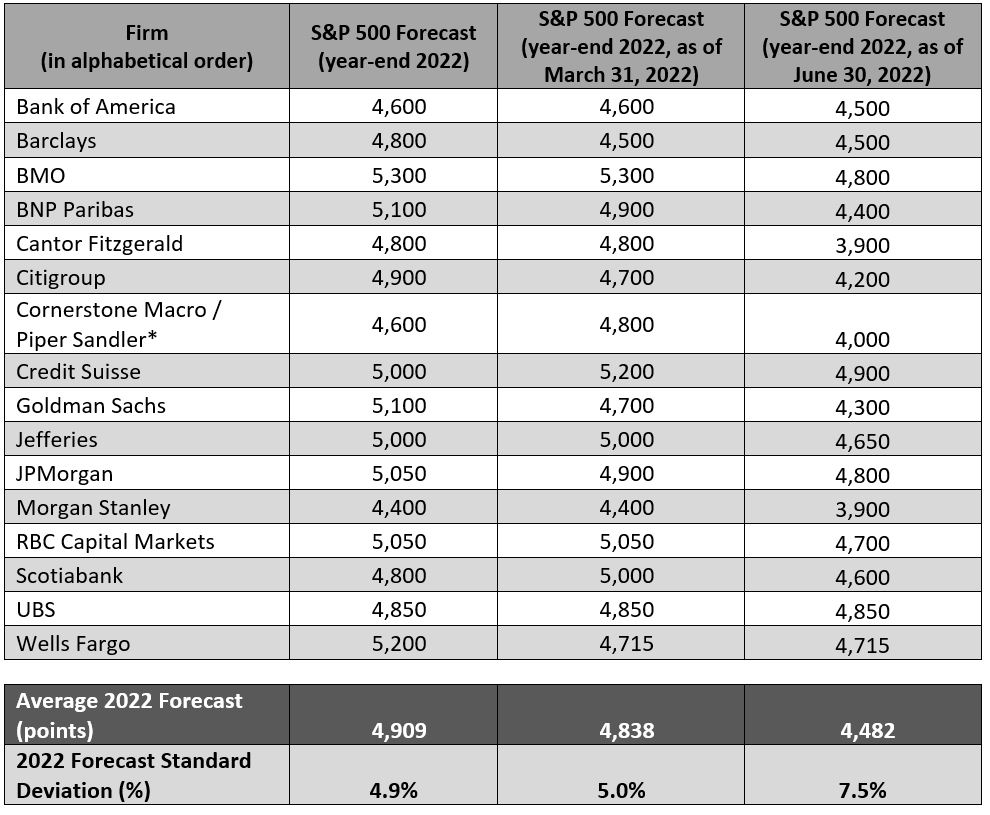 *Cornerstone Macro was acquired by Piper Sandler in February 2022.
Source: Bloomberg, Research Reports, as of 30 June 2022. Industry estimates are hypothetical in nature, do not reflect actual investments and are not guarantees of future results.
Although it’s impossible to know how stocks will perform over the next six months, we can look at historical data to get a “base rate” expectation of different market moves.
Looking at all rolling six-month periods between 1928 and 2022, the probability of a 18% (or greater) price increase in the S&P 500 over that time frame is around 10%. Thus, strategists are implicitly expecting a rare (about a one in ten) outcome by projecting that the index will rise to 4,482 by year-end.
However, if we limit the analysis to only include periods when a 20% or more price drop occurred over the preceding six months, the probability of a subsequent 18% (or greater) price gain is somewhat higher at around 26%. This is about a one in four outcome. Still, even looking at this data subset, the average strategist forecast appears quite optimistic.
We can also look at half-year splits for returns across all previous years, similar to the analysis we did in our prior note after the first quarter.
Since 1928 and on average, the S&P 500 has risen 3.9% in the first half (H1) followed by a further 4.1% increase over the second half (H2) of the year.1
We then split these events into two categories – positive H1 and negative H1. Positive H1s happened 65% of the time with an average price gain of 11%, while negative H1s made up the remaining 35% with an average price loss of -9%.
Subsequent price moves for these two categories are quite different. A positive H1 was followed by a positive H2 in about 75% of years. But a negative H1 was only followed by a positive H2 in about 55% of years.
Additionally, following a negative first half, both the average and median return over the second half was lower and volatility was higher. Exhibit 2 summarizes these results.
Exhibit 2: Second Half (H2) Returns Following First Half (H1) Outcomes
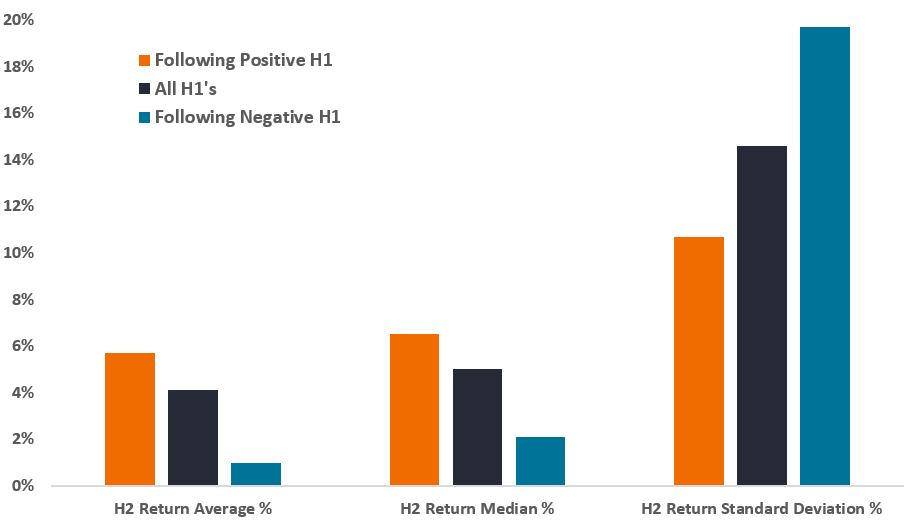
Source: Bloomberg, as of 30 June 2022. S&P 500 Index price series from January 1928 to June 2022, no transaction costs. Past performance does not predict future returns.
As in the prior note, we reiterate that the total sample size (94 years) is not large, and the dispersion of potential market outcomes is wide. But the overall result was similar – just like a negative Q1, a negative H1 is also associated with large swings over the remaining year.
Accordingly, at halftime, we continue to expect market volatility to remain elevated in H2 relative to long-run averages. Diversifying portfolios across uncorrelated strategies and assets remains key.
1Bloomberg, S&P 500 Index price series from January 1928 to June 2022.
10-Year Treasury Yield is the interest rate on U.S. Treasury bonds that will mature 10 years from the date of purchase.
Average is found by adding all numbers in a data set and dividing by the number of values in the set.
Median is the middle value when a data set is ordered from least to greatest.
Diversification neither assures a profit nor eliminates the risk of experiencing investment losses.
S&P 500® Index reflects U.S. large-cap equity performance and represents broad U.S. equity market performance.
Standard Deviation measures historical volatility. Higher standard deviation implies greater volatility.
Volatility measures risk using the dispersion of returns for a given investment.
Use of third party names, marks or logos is purely for illustrative purposes and does not imply any association between any third party and Janus Henderson Investors, nor any endorsement or recommendation by or of any third party. Unless stated otherwise, trademarks are the exclusive property of their respective owners.

Sign up for timely perspectives delivered to your inbox.