Subscribe
Sign up for timely perspectives delivered to your inbox.


Remarkable advances in biomedical research are leading to rapid growth and volatility in the biotechnology sector. In this paper, Portfolio Managers Andy Acker and Dan Lyons and Research Analyst Agustin Mohedas explain why an investment strategy rooted in deep analysis spanning public and private entities and using short sales to hedge against risk could help maximize return potential.
The biotechnology sector is experiencing a period of unprecedented innovation, thanks to dramatic improvements in biological tools, genetic engineering and new modalities for treating human disease. These advances are converging to create what’s being dubbed the “century of biotechnology,” during which the standards of care for major illnesses such as cancer, autoimmune disease and rare genetic disorders are being revolutionized.
But for many investors, exposure to the biotech sector is limited. In the MSCI World Investable Market Index, which consists of large-, mid- and small-cap stocks from 23 developed markets, biotechnology makes up only 1.8% of assets, compared with a total of more than 11% for high-growth peers software and semiconductors.4 Furthermore, the Index has no exposure to the thousands of private firms being funded by an expanding pool of venture capital.
The net result is that one of the fastest-growing sectors in the economy may account for only a small percentage of an investment portfolio, particularly one that takes a passive approach to equity investing. Even when investors add exposure to biotech, they may not benefit from owning the fastest-growing entities in the sector. At the same time, there is biotech’s significant volatility to consider: Drug development is a risky endeavor subject to regulatory and commercial setbacks, as well as capital market dynamics. These events can lead to binary outcomes that are difficult to forecast and can result in dramatic price swings.
As such, we believe harnessing the long-term return potential of biotech requires a multipronged approach, one that includes both public and private investing and combines in-depth research with scientific understanding to try to capitalize on market inefficiencies. In addition to long positions, short selling can be used to try to moderate volatility and/or hedge against binary events – all while staying focused on the innovation moving the biotech revolution forward.
Significant advances over the last decade in unraveling the biology of disease have accelerated the pace of new drug launches. From 2017 to 2021, novel drug approvals by the Food and Drug Administration (FDA) increased more than 100% from the five-year period the decade prior (Exhibit 1). In 2021, more than half (54%) of drugs approved were considered first-in-class, with mechanisms of action differentiated from those of existing therapies. Nearly three-quarters (74%) used one or more expedited development and review methods, available for drugs with the potential to deliver significant advances in medical care (Exhibit 2).
Exhibit 1 and 2: FDA Novel Drug Approvals and 2021 FDA Approvals – Use of Expedited Development and Review Pathways
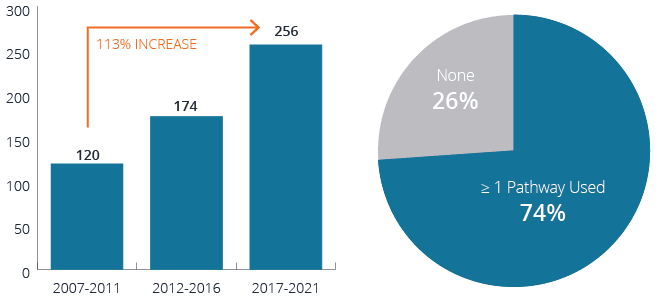
Source: FDA, as of 31 December 2021.
Source: FDA, Advancing Health Through Innovation: New Drug Therapy Approvals 2021, January 2022.
More milestones are on the horizon. With the advent of next-generation sequencing and novel tools such as proteomics (the large-scale study of proteins), scientists are now able to rapidly identify disease-causing genetic mutations and track changes in protein levels that could signal biological shifts. These “biomarkers” are helping researchers address illnesses previously thought untreatable. They have also ignited an explosion in new drug modalities, from protein degradation (which targets disease-causing proteins for destruction) to gene editing (by which defective genes can be corrected in-vivo). We’ve also seen the breakthrough of mRNA technology, with highly effective vaccines for COVID-19 developed in less than a year, about tenfold faster than traditional vaccines. These types of innovations are enhancing not only patient outcomes, but the commercial prospects of new medicines, potentially creating attractive opportunities for investors.
Indeed, research shows the performance of biotech stocks historically has correlated with drug sales growth. Aggregating the product revenues of 65 biotech companies over the last two decades, investment bank Cowen and Co. found that the Nasdaq Biotechnology Index has tended to move higher during periods when combined revenues for these companies were rising and sideways when their growth slowed (Exhibit 3).
Exhibit 3: Nasdaq Biotechnology Index vs. Aggregate Product Revenue, 2000-2026E
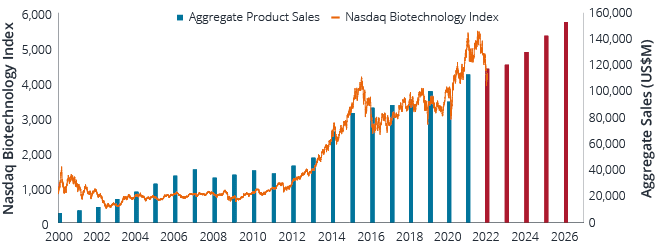
Source: Cowen and Company, as of 25 February 2022. Data from 31 December 1999 to 31 December 2026.
Note: Revenue is an aggregate of actual and estimated figures for 65 companies representative of the biotech sector. The Nasdaq Biotechnology Index is a stock market index made up of securities of Nasdaq-listed companies classified according to the Industry Classification Benchmark as either the biotechnology or the pharmaceutical industry. Red bars represent forecast sales. Sales are not guaranteed.
Exhibit 4: U.S. Venture Capital Pharma and Biotech Deal Activity
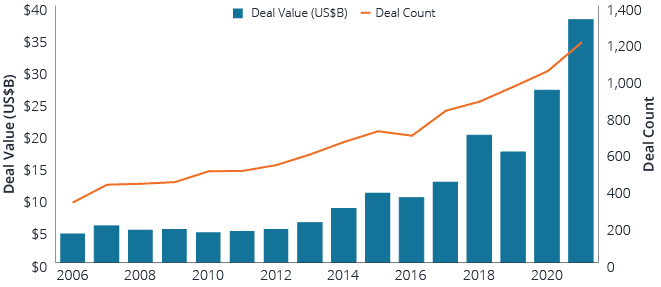
Source: Q4 2021 PitchBook-NVCA Venture Monitor, as of 31 December 2021.
Exhibit 5: Large Biopharma Ready for M&A
Deal-making capacity of top pharma companies (2022)
 Source: SVB Leerink, as of 1 December 2021. Data aggregated for a cohort of
Large biopharma is also spending heavily on innovation. In 2021, 15 of the industry’s leading firms dedicated a record $133 billion to R&D, up 44% from 2016.8 Even so, the share of new drugs originated by large biopharma has declined over the past decade, potentially reflecting the growth in venture funding for earlier-stage companies, which has driven technology and talent to emerging biopharma. At the same time, many of the industry’s best-selling blockbuster drugs (with annual sales of $1 billion or more) face patent expirations in the coming years – including medicines worth more than $17 billion in annual sales in 20229 – threatening to undercut revenues.10 With loss of exclusivity looming and in-house R&D yielding a smaller percentage of drug launches, large biopharma could pursue M&A and strategic partnerships to help refresh pipelines. Indeed, for 2022, biopharma has amassed roughly $1.7 trillion of potential firepower for acquisitions, including more than $500 billion in cash (Exhibit 5).
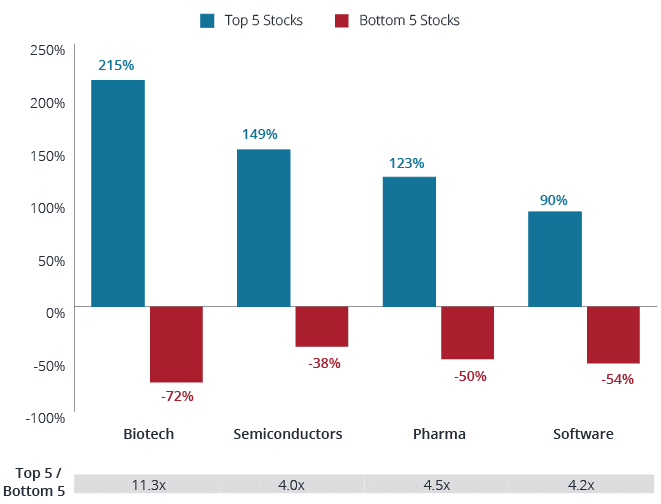
Exhibit 6: 10-YR Average Disparity of Returns for Top 5 and Bottom 5 of Each Sector
% Difference in Performance (31 Dec 2011 to 31 Dec 2021)
Source: Janus Henderson Analytics, as of 31 December 2021.
As much as biotechnology companies offer potential for growth, they also face considerable risks. Industry research shows that approximately 90% of drugs that begin human clinical trials never make it to market. When a drug fails to meet a key endpoint in a clinical trial or suffers a regulatory setback, a company’s stock can see substantial losses (as much as 50% or more), often in a single day. Similarly, our data show that about 90% of the time, Wall Street analysts either over- or underestimate the commercial prospects for a new medicine, which can lead to significant stock volatility.
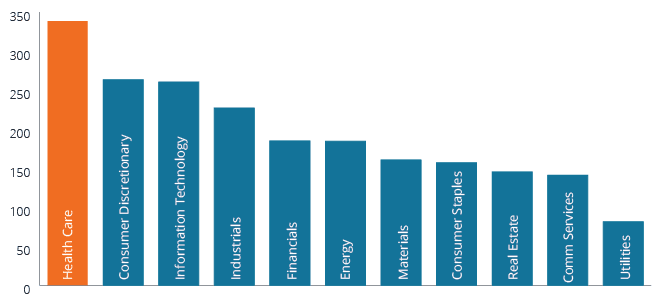
As such, it may not be surprising that over the past decade, health care has experienced the largest disparity in performance between winners and losers among the equity market’s major sectors, in large part due to swings in biotech stocks (Exhibit 6). In fact, the 11-fold spread between the top- and bottom-performing stocks in biotech was nearly threefold higher than the next widest sector (Exhibit 7).
Exhibit 7: 10-YR Average Return
Source: Janus Henderson Analytics, as of 31 December 2021
Note: Based on analysis of 10-year period for Wilshire 5000 Index from 2012 to 2021.
Exhibit 8: Biotech Drawdowns and Rebounds
Biotech can experience significant sell-offs, with the current drawdown the largest on record. But historically, rebounds have often been even larger.
Drawdowns |
12-Mo. Return from Bottom |
||||
|---|---|---|---|---|---|
Date |
# of Trading Days |
XBI Performance (%) |
XBI vs S&P 500 Index (%) |
XBI Performance (%) |
XBI vs S&P 500 Index (%) |
| 27 Feb 06 – 23 May 06 | 61 | -21.8 | -19.2 | 27.2 | 3.8 |
| 10 Dec 07 – 10 Mar 08 | 62 | -22.6 | -7.0 | -4.4 | 37.7 |
| 14 Aug 08 – 5 Mar 09 | 138 | -37.6 | 8.7 | 36.8 | -33.7 |
| 23 Mar 10 – 6 July 10 | 73 | -19.5 | -7.6 | 49.2 | 16.2 |
| 22 July 11 – 8 Aug 11 | 12 | -26.7 | -10 | 54.7 | 26.6 |
| 27 Feb 14 – 8 May 14 | 50 | -29.1 | -30.6 | 87.4 | 72.3 |
| 17 July 15 – 8 Feb 16 | 140 | -49.2 | -37.4 | 44.2 | 17.7 |
| 22 Sep 16 – 3 Nov 16 | 30 | -22.6 | -18.7 | 61 | 34.6 |
| 20 Jun 18 – 24 Dec 18 | 129 | -35.3 | -21.1 | 50.5 | 10.6 |
| 5 Apr 19 – 1 Oct 19 | 124 | -20.4 | -23.1 | 51.3 | 34.1 |
| 19 Feb 20 – 16 Mar 20 | 19 | -32.9 | -3.5 | 121.7 | 52.7 |
| 08 Feb 21 – 14 Mar 22 | 275 | -53.4 | -61.7 | NA | NA |
| Median | 68 | -27.9 | -19.0 | 50.5 | 26.6 |
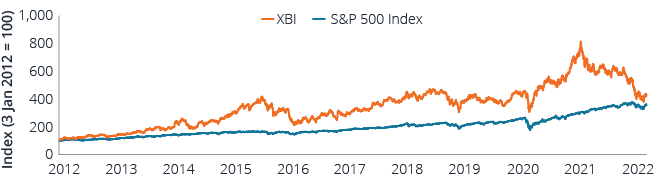
Source: Bloomberg, Janus Henderson Investors. Data for table from 27 February 2006 to 14 March 2022. Data for line chart from 3 January 2012 to 31 March 2022.
Note: The SPDR® S&P® Biotech ETF (XBI) is designed to correspond to the performance of a modified equal weighting of the S&P Biotechnology Select IndustryTM Index, with an inception date of 31 January 2006.
Biotech returns are also subject to policy hurdles, including government review of M&A and legislation that can hinder incentives to invest in and develop novel treatments. New drug applications can also suffer negative regulatory surprises. Last year, for example, the FDA denied approval for Nuplazid as a treatment for dementia-related psychosis. The outcome was unexpected since the issues flagged by regulators were not part of agreed-upon criteria for review. The stock of the drug’s developer, Acadia Pharmaceuticals, fell by almost half.14 (After meeting with the FDA, Acadia resubmitted the application in early 2022, narrowing the proposed indication to Alzheimer’s disease psychosis.)
These risks can lead to volatility well in excess of broader equity market moves. Since its inception in 2006, the SPDR® S&P® Biotech ETF (XBI), a widely used industry benchmark that encompasses small- and mid-cap companies as well as large-cap biotech, has experienced 12 drawdowns of 20% or more, with a median loss of 28%. During those periods, the benchmark underperformed the S&P 500® Index by a median of 19%. However, rebounds have tended to be even more sizable, with a median gain of 50% in the XBI over the 12-month period following trough levels15 (Exhibit 8).
A number of reasons have been cited for the rout, including rising interest rates, a renewed push for drug-pricing reform in the U.S., and the absence of a permanent commissioner at the FDA (which may have contributed to unwelcome regulatory surprises, such as Nuplazid). The drawdown also came after a frothy IPO market – fueled by enthusiasm around the industry’s historic response to COVID-19 – and ultra-loose monetary policy pushed up valuations in 2020.
We believe many of the sector’s headwinds are showing signs of abating. Proposals for drug-pricing reform have been scaled back and in their current form would only affect a small subset of drugs near the end of exclusivity periods. The passing of legislation could also remove an overhang of uncertainty for the sector. In addition, the FDA has kept up a rapid pace of approvals – 50 new drugs in 2021, on par with the elevated rate of recent years – even before a permanent commissioner was confirmed in early 2022.
These dynamics suggest biotech, backed by healthy funding and advanced science, has the potential to deliver significant growth over the coming years. But at the same time, we believe the sector’s downside risks and volatility argue for a multipronged investment approach. We feel a combination of long positions in public and private holdings, combined with short selling, could help optimize risk-adjusted returns.
Private investments offer the potential to gain entry at the early stages of a company’s valuation and capture sizable upside. Private investors can take a deep dive into company fundamentals, gaining access to data not normally available to public investors, such as FDA regulatory correspondence. But the price of admission is often clinical risk, especially for pipelines reliant on a single product or in the early innings of development. Conversely, public companies offer liquidity but tend to have less upside potential and are still prone to binary risks and mispricing by markets.
In our view, a mix that includes an allocation to both private and public long investments offers a good balance of growth and liquidity. For private investments, deals that attract a strong pedigree of investors who are enthusiastic about a company’s prospects are often a positive sign, suggesting future efforts to raise capital (including through an IPO) might be well received. Also critical for both public and private investments: keeping a steady eye on binary events and modeling possible downside scenarios. To that end, we believe limiting the position size of individual holdings can help protect against any one event causing a significant loss of capital.
With 90% of drugs in trials never making it to market, biotech offers fertile ground for short sales, which can moderate portfolio drawdowns and capitalize on market inefficiencies. Having insight into both public and private markets can be an advantage. In 2020, for example, public companies developing CRSPR gene-editing platforms saw their valuations soar as hype around the technology grew, even in the absence of clinical data. Meanwhile, private companies developing next-generation gene editing technology traded at a large discount, reflecting the valuation gap often seen between public and private entities. Inefficiencies of this kind create opportunities for “pair trades,” whereby an investor can short a highly valued public company against a private company at a dramatically lower valuation. In the CRSPR example, investors following this strategy would have been able to gain entry to the gene-editing revolution at a lower price point, while potentially hedging out market risks.
Other short strategies can involve identifying companies whose stock prices appear overly inflated or where the probability of success for a binary event, such as a clinical readout, seems overestimated by the market. Investors, for example, typically assign phase 3 clinical trials – the final round of clinical testing before a company files for regulatory approval – 50% odds of success, in line with the industry average. A short-selling strategy can take advantage of this view when analysis ascribes a much lower probability of success.
In the end, we believe companies focused on addressing unmet medical needs are most likely to drive long-term growth. An investment strategy rooted in understanding both the science and commercial opportunities of novel therapies can help identify the breakthrough medicines of the future. But given the complexities of developing and commercializing new drugs, biotech stocks regularly endure setbacks and volatility, increasing the importance of a diversified approach. Seeking to recognize and capitalize on downside risks can also help to balance a portfolio and build a better picture of value throughout the sector. In our view, investors who stay focused on these fundamentals could find themselves well positioned to benefit from the ongoing biomedical revolution.
2 IQVIA, Global Trends in R&D: Overview through 2021, February 2022. Emerging biopharma is defined as companies with an estimated expenditure on R&D of less than $200 million and less than $500 million in revenue annually.