After experiencing some of the longest cycles in history over the last three decades, are we now setting up for one of the shortest cycles that most investors have ever experienced? And what is the implication of this for our view of nominal and real interest rates? Global Bonds Portfolio Manager Helen Anthony examines the facts.
Key Takeaways
- The fastest and deepest recession on record was met with unprecedented easing policies that supported the end consumer, which is why this economic cycle has the potential to be much shorter relative to recent history.
- We believe we are either in, or beginning to enter, the ‘excess’ stage of the economic cycle – credit and wage growth indicators are looking strong and inflation expectations are still for an overshoot of target, at least in the US, in 2022.
- With a solid economic backdrop in core developed markets, we expect both real and nominal yields to move modestly higher over the next year.
2020 brought with it the fastest and deepest recession on record as shutdowns swept the globe. However, unprecedented amounts of monetary and fiscal policy supporting businesses and consumers has meant that post‑recessionary balance sheets look much healthier now than would otherwise have been expected at this stage of the cycle. Much of this is thanks to the ballooning government debt helping to support the end consumer. This is the major difference to the aftermath of the Global Financial Crisis and is the starting point as to why this cycle has the potential to be much quicker relative to recent history (Figure 1).
Figure 1: Historical business cycle lengths in the US
Source: NBER (National Bureau of Economic Research – US), Janus Henderson Investors, as at September 2021.
The four stages of the economic/business cycle
The economy and the markets tend to move in a cyclical fashion. Knowing which part of the cycle we are in and adapting to the current phase is a key component to managing risk. The four stages of an economic or business cycle are depicted in Figure 2.
Figure 2: Economic cycle phases and market reactions
| Business expansion Business contraction |
Late recession |
Recovery (growth) |
Excess |
Early recession (downturn) |
| Sentiment: | Capitulation | Hope | Euphoria | Anxiety |
| Rates: | Lower | Higher | Mixed | Lower |
| Curve: | Steep | Steep | Flattening | Steepening |
| Currency: | Mixed | Weak Dollar | Weak Dollar | Strong Dollar |
| Spreads: | Widening | Narrowing | Stable | Vacillating |
| Portfolio Strategy: | Exploit and provide liquidity | Risk-taking | Trim and trade | Sell riskier assets and maximise diversification |
| Risk appetite: | Medium | Highest | Medium | Lowest |
Source: Janus Henderson Investors.
Figure 2: Economic cycle phases and market reactions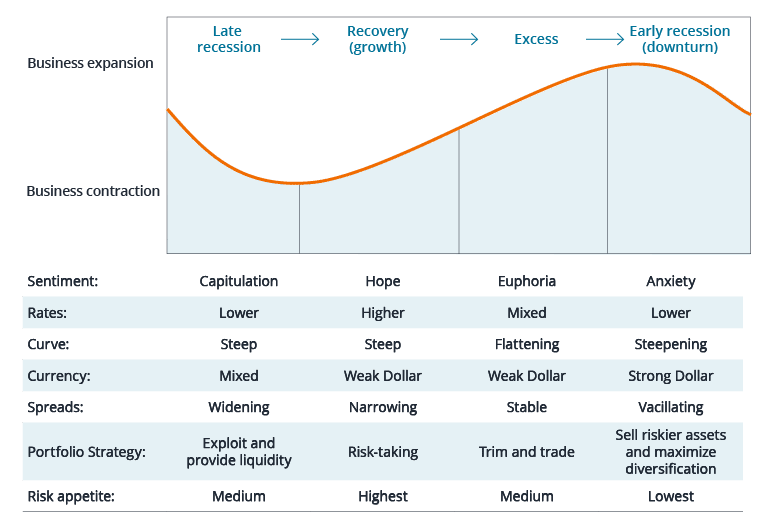
Source: Janus Henderson Investors.
So, how does this relate to the current environment?
In early 2020, we were in the ‘early recession’ part of the wave. The move to ‘late recession’ came in the second quarter and ‘recovery’ began in the third quarter of 2020, continuing into the first quarter of 2021. As Figure 2 shows, the next stage is the ‘excess’ phase, which arguably could be the stage we are in – or are entering – now.
Interpreting signals from the fixed income markets
Looking across at what is happening in different asset classes, credit (corporate bond) spreads are now at their tights (lowest levels compared to history) but relatively stable, given defaults rates are low and the search for income or carry is the main game in town.
Government yield curves have been generally flattening in the developed markets since March. March saw longer‑term nominal bond yields spike on higher inflation and a rapid recovery in growth – further helped by a rush to sell, given that the majority of investors were long (holding) bonds. This caused the rates (government bond) markets to move towards fair value, if not above. However, in July and August, investors were increasingly concerned about longer-term expectations on growth and inflation – coupled with a system that is awash with liquidity, helping to supress yields.
So, what is the outlook from here?
First, credit growth. Here, indicators are looking strong, which should be a good forward-looking signal for gross domestic product (GDP) growth. Bank lending standards have loosened – pleasingly, European bank lending has been strong, though in the US commercial and industrial (C&I) loan growth looks to have bottomed after being uncharacteristically strong during the crisis where banks were forced to lend. While the manufacturing indicators in Purchasing Managers’ Indices (PMIs) maybe rolling over and heading lower from their recovery peak, there is room for service PMI indicators to pick up the slack.
Second, wage growth. Employment patterns are increasingly strong with multiple surveys such as the National Federation of Independent Business (NFIB) in the US and jobs hard to fill surveys in the UK suggesting that there is a lack of labour supply. Hiring data are strong, which one would expect given the number of people coming back into the labour force as countries reopened, but alongside this, quits rates are holding up well and have surpassed pre‑COVID levels. The longer this mismatch in labour persists, with job openings indicators at record levels (particularly in the US) the more likely it is for wage growth to persist.
Finally, inflation expectations. This is the third key pillar when thinking about the cycle. Is inflation really as ‘transitory’ as the US Federal Reserve (Fed) would lead us to believe? If we use the median forecast on Bloomberg for core personal consumption expenditures (PCE) – the Fed’s preferred inflation measure – it is forecast to be above 2% by the end of 2022 (Figure 3). Our expectation is that at some point over the next year, the market should start to push back on this transitory theme. Yes, inflation is likely to come down but it is still at high levels and if the median forecast is correct, it is set to remain here.
This could partly be due to bottlenecks in supply chains. However, unless there is a belief that the COVID‑19 virus is endemic (which becomes hard to believe with a cocktail of mixed vaccination rates around the globe and the Delta virus spreading at different rates in different countries), bottlenecks in supply chains are unlikely to disappear.
The risk to this view is that although forecasters have been constantly increasing their inflationary projections to the upside over the last year, we could see the reverse on the way down and inflation potentially undershoot expectations. After all, participation rates in labour markets, especially the US, are still at subdued levels and could put downward pressure on wage growth as more people enter the labour force over time. Yet, it is hard to deny the pace of the recovery and indicators that have headed back to pre‑crisis levels or have reached levels where previously the Fed started their hiking cycle.
Figure 3: Core PCE, the Fed’s preferred inflation measure (actual and forecast)")
Source: Bloomberg, Janus Henderson Investors, as at 6 September 2021. Note: core PCE: excluding volatile items such as food and energy.
What does it all mean for interest rates?
There are plenty of signs that many developed economies are still in a good place, so, why are rates markets not pricing in higher levels?
July saw some interesting movements in the price of US Treasuries. China’s slowing growth coupled with noises around regulations and the underperformance of some property companies caused Asian investors to grab safe haven assets such as US Treasuries, and we saw pronounced movements lower in yields, more in the Asian trading hours. Other market participants cited the Delta variant being more prevalent in the US as the reason for falling yields. However, the summer months are typically strong through July and August due to the strong summer seasonal effect, which is essentially driven by a lack of supply in government bond markets (especially prominent in Europe). More recently we have seen the start of a repricing in government bonds off the back of a more hawkish Fed and the Bank of England.
The trend in real yields is important
Real yields (nominal bond yields less inflation) have been caught in somewhat a perfect storm pushing them to historic lows, reflecting a combination of a decline in nominal yields since the first quarter and robust inflation data helping to support inflation expectations. The trend in real yields is important, because they are viewed as a medium-term forecaster of defaults and credit stress. With real rates negative, many companies can essentially borrow at rates which are below their expected revenue growth.
While negative real yields are a global phenomenon in the core developed markets, with a solid economic backdrop, real yields and nominal yields, in our view, are expected to move modestly higher over the next year. In the US, quantitative easing (QE) purchases have also had a part to play where Fed purchases of Treasury Inflation-Protected Securities (TIPS) have outpaced net issuance, thereby reducing the supply available to the private sector. This is set to change with ‘tapering’, or the reduction of Fed asset purchases over 2022.
Going forward, caution is warranted
In the nominal space we are already pricing higher interest rates, but how much higher are they likely to go from here? First, let us take a look at what is currently priced. Looking at the markets’ expectations of central bank interest rates, the US has 0.56% already priced in (as at 23 September) for interest rate hikes at the front end of the yield curve in the next two years (ie, a little more than two rate hikes of 0.25% each), while the forecast for 10-year rates in one year’s time is 1.55%.1
Using a scenario-based approach and looking at different timings for the Fed lift-off in interest rates, our model suggests that the 10‑year rate has started to trade away from the bottom of our fair value range. This suggests caution is still warranted in owning assets with longer duration (more sensitivity to interest rate changes), where comparatively modest moves higher in risk-free yields can overwhelm coupon income, resulting in negative returns.
Final word on the cycle
With many economic indicators back towards their pre‑COVID crisis levels, there is a likelihood of a faster interest rate hiking cycle by central banks, such as the Fed, than is currently priced in by the markets but also relative to that of recent history. The potential for more aggressive policy action due to the nature of the recession (being different to any other we have experienced) comes with a necessary faster pace of asset allocation in portfolios, where ultimately it pays to have a flexible approach. Although we are not end of cycle yet, it is hard to deny that we are set up for a much shorter cycle than investors have been used to.
1Bloomberg, as of 23 September 2021.
Featured Funds
JGBIX
Global Bond Fund
JGBDX
Global Bond Fund
Glossary ExpandCore PCE inflation: this is a measure of prices for goods and services in the US ex. volatile items such as food and energy, also referred to as core PCE price index. The Fed uses the PCE price index as its main measure of inflation.
Quantitative easing (QE): an unconventional monetary policy used by central banks to stimulate the economy by boosting the amount of overall money in the banking system.
Spread/credit spread: The difference in the yield of a corporate bond over that of an equivalent government bond. Widening spreads generally indicate deteriorating creditworthiness of corporate borrowers, and narrowing indicate improving.
Tapering: a winding down of certain activities by a central bank such as the reduction in the rate of bond purchases under a QE programme.