Knowledge. Shared Blog
November 2020
Is There a Solvency Crisis Looming for Credit Markets?
 Jenna Barnard, CFA
Co-Head of Strategic Fixed Income | Portfolio Manager Nicholas Ware
Portfolio Manager
Jenna Barnard, Co-Head of Strategic Fixed Income, and Nick Ware, Portfolio Manager, counter the bear argument that credit is set to face a solvency crisis by explaining that liquidity is solvency.
Key Takeaways
- High-yield defaults are estimated to peak well below typical recessionary levels as the ample liquidity and stimulus packages put in place have bought time for companies to counter the problems brought on by COVID-19.
- Companies have had little trouble accessing capital markets, both bond and equity; together with self-help tactics this is allowing them to weather the crisis. Problems are predictably occurring in areas that were structurally pressured pre-crisis.
- While credit metrics have deteriorated, much of the cash raised is sitting on balance sheets. An expected episode of deleveraging and recovery in earnings could see the deterioration reversed in 2021-22.
This is the fourth article we have written since turning structurally bullish on credit during the COVID-19 crisis that started in March 2020. The themes we have discussed – exceptionally low default rates relative to the decline in gross domestic product (GDP) and the pandemic driving the U.S. investment grade (IG) market to a record low in yields – have gone from being nonconsensual views to reality. Here we aim to address the remaining “macro-tourist”1 bear argument that, having resolved liquidity concerns, credit markets are due to be hit by a solvency crisis (i.e., a new default wave from companies that cannot repay this debt). We disagree, arguing that, for public credit markets – which focus on larger corporates, not the small businesses on your local street – liquidity is solvency.
Many bearish commentators have propounded the view that the COVID-19 crisis would catalyze a major default cycle given the intersection of record amounts of corporate debt and the deepest recession in modern times. This builds on what we have felt to be a fallacious narrative about excessive BBB corporate debt from similar commentators in recent years.
The reality has not borne this out to date: high-yield defaults in Europe look set to peak at around 4% in late 2020 while the U.S. high-yield market (with greater commodity exposure) should peak around 6.5% before declining in 2021.2 This is a historic decoupling of default rates from economic data (historically they reach 10%-12% in recessions) and we have written in past articles about the unique nature of the policy response in this crisis. Every crisis has its own peculiarities, and this one differs from the Global Financial Crisis in 2008-09, in that there has been ample liquidity available for corporate borrowers from both the investment grade and the high-yield market. The stimulus has bought companies time to fix the problems brought on by COVID. Consumers, too, have been shielded from large income drops brought on by unemployment through furlough schemes and in some cases – notably sections of the U.S. – they are better off than before the crisis started.
Credit Metrics in a Historical Context
It is worth stepping back to look at corporate balance sheet metrics in aggregate in order to judge the impact of the COVID-19 crisis. At the aggregate level, corporate debt has risen as companies have borrowed more (see Exhibit 1).
Exhibit 1: U.S. Corporate Debt as a % of Gross Domestic Product (GDP)
[caption id=”attachment_328136″ align=”alignnone” width=”1023″]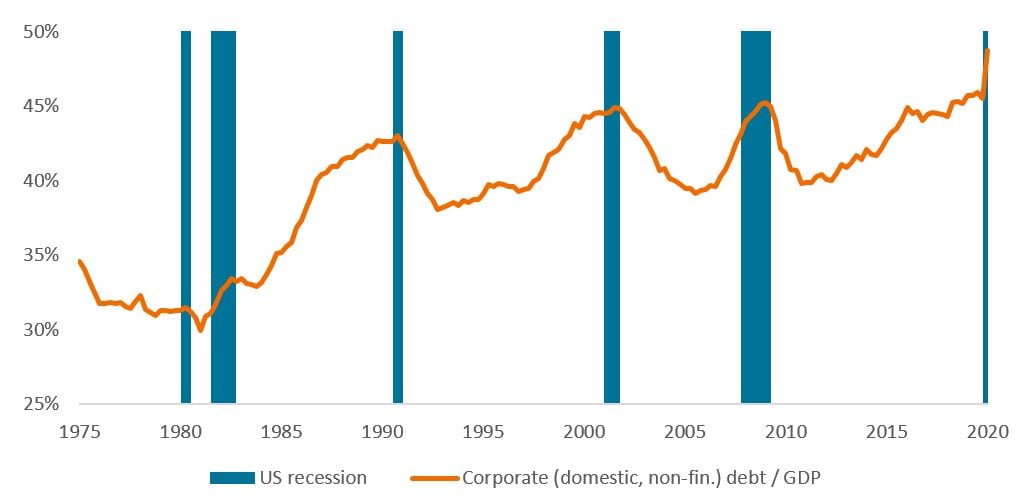 Source: Board of Governors of the Federal Reserve System. Q4 1951 to Q1 2020. Notes: domestic non-financial sectors.[/caption]
Not unexpectedly, corporate leverage ratios have increased materially, as depicted below in Exhibit 2. However, the impact has been notably larger for gross leverage (which is at record highs) than net leverage, which simply sits at previous cycle highs – not the unprecedented situation it is made out to be. Essentially, corporates raised a war chest of liquidity (which is thus far unspent) in case of further waves of the pandemic. Meanwhile, median interest coverage (the number of times a company’s available earnings can cover interest payments on its debt) weakened but is still healthy at 9.4x, reflecting record low interest costs, according to research by Morgan Stanley (as of 30 June 2020).
Exhibit 2: U.S. Investment Grade Gross and Net Leverage
[caption id=”attachment_328147″ align=”alignnone” width=”1049″]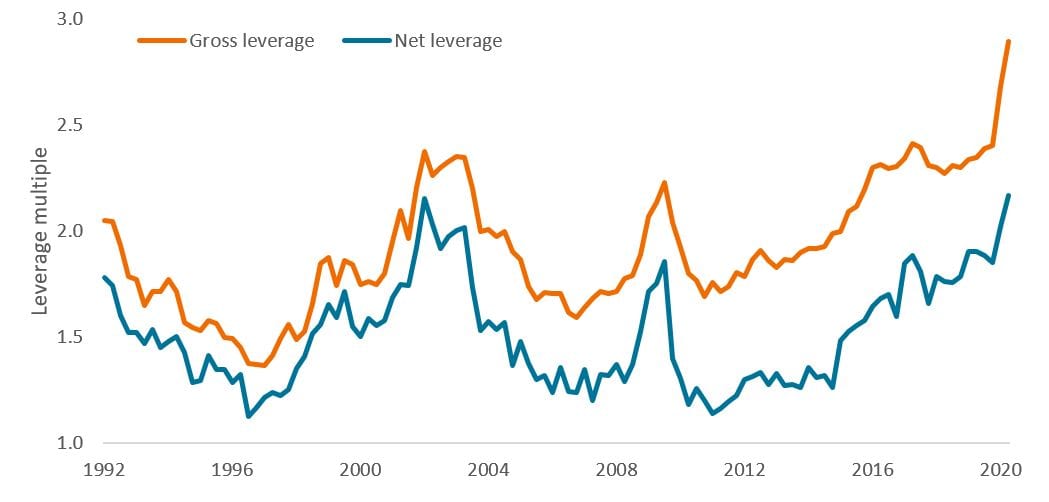 Source: Morgan Stanley Research, Bloomberg Finance LP, FTSE Fixed Income LLC, 31 March 1992 to 30 June 2020. Gross leverage is a measure of the level of debt of a company. It is measured as total debt divided by earnings before interest, tax, depreciation and amortization (EBITDA). Net leverage is net debt (interest-bearing liabilities minus cash and cash equivalents)/EBITDA.[/caption]
Exhibit 3: U.S. High-Yield Median Gross and Net Leverage
[caption id=”attachment_328158″ align=”alignnone” width=”1014″]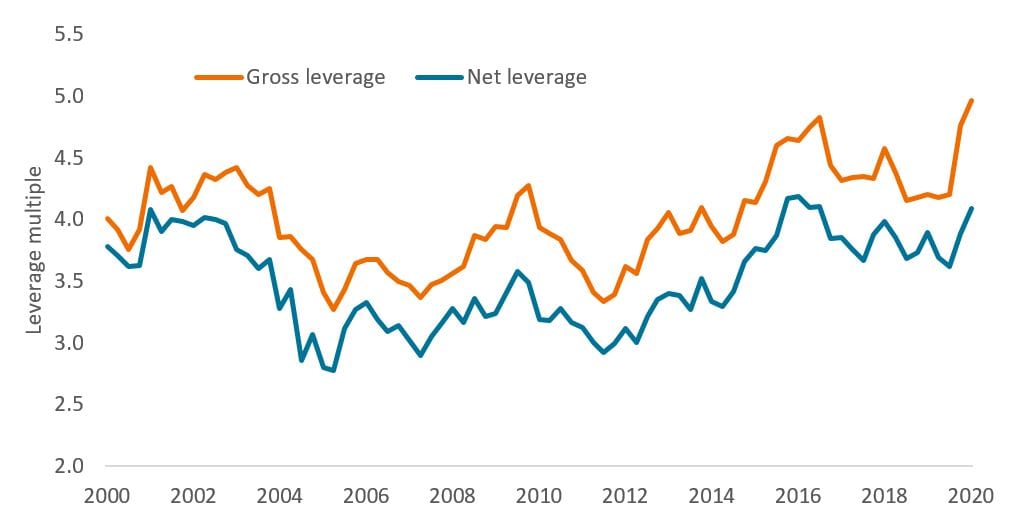 Source: Morgan Stanley Research, Bloomberg, S&P Capital IQ, 30 June 2000 to 30 June 2020.[/caption]
Exhibit 4: U.S. High-Yield Interest Coverage
[caption id=”attachment_328169″ align=”alignnone” width=”1024″]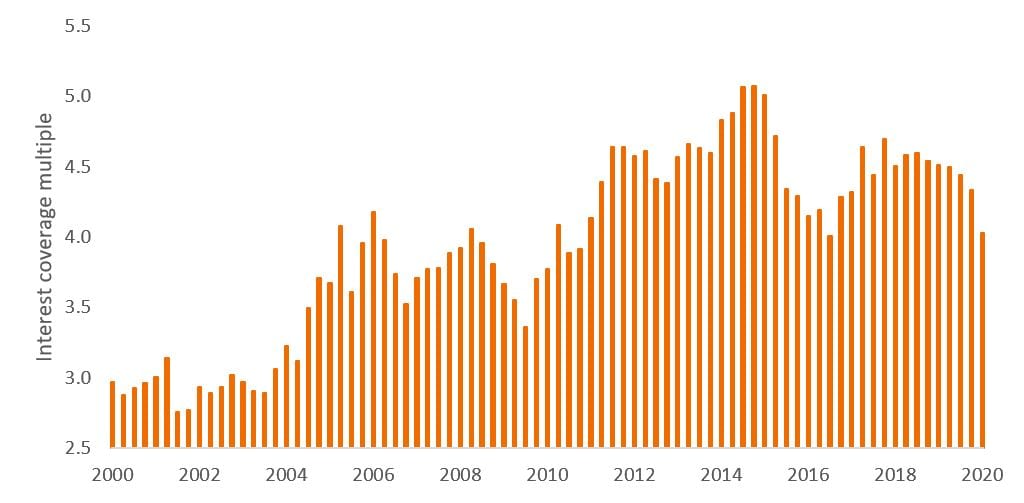 Source: Morgan Stanley Research, Bloomberg, S&P Capital IQ, 30 June 2000 to 30 June 2020.[/caption]
It is perhaps worth mentioning that, relative to the expected impact, corporates have managed the crisis better than expected. They have reduced expenses and capital expenditures to preserve their profitability and cash flow. As mentioned, companies also built up liquidity reserves to see through the crisis. S&P 500 companies have issued close to $1.2 trillion of bonds in 2020 versus $875 billion in 2019, and $96 billion of equity, too.3 Capital markets have been wide open to COVID-impacted sectors such as cruise companies and airlines to raise liquidity to see through the crisis, with U.S. IG issuance year to date as of 8 October standing at $1.57 trillion.4 High yield has also seen significant issuance, with cash being raised for precautionary purposes.
Exhibit 5: U.S. High-Yield Median Cash as a % of Debt
[caption id=”attachment_328185″ align=”alignnone” width=”1032″]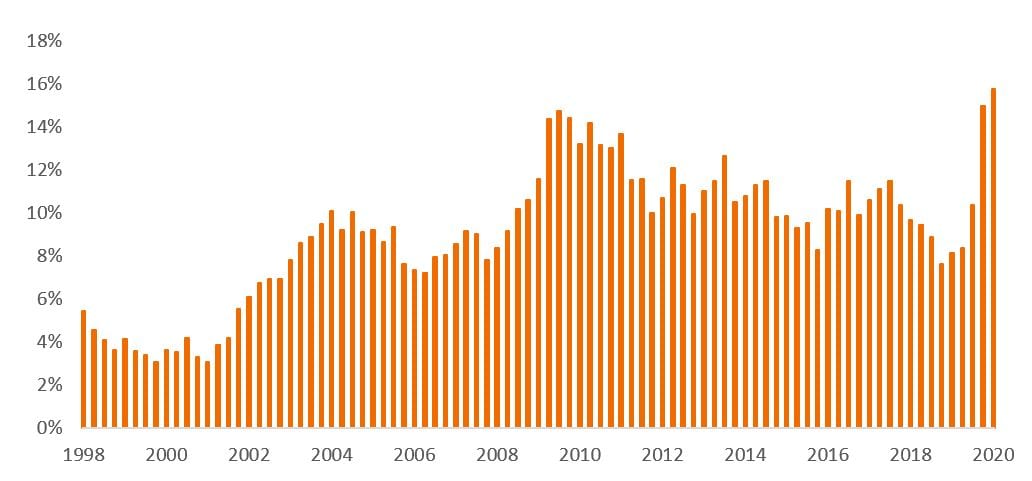 Source: Morgan Stanley Research, Bloomberg, S&P Capital IQ, 30 June 1998 to 30 June 2020.[/caption]
Will This Turn into a Solvency Crisis?
Increasing liquidity is clearly a necessary condition for survival, but deleveraging is the only sustainable route to survival. However, the ability for a company to remain a “zombie” for years should not be underestimated. Interestingly, although we did see an initial spike in defaults in Q2 2020, default rates quickly subsided again. Indeed, default rate forecasts have been declining since the initial overdone and top-down driven forecasts in March. This has culminated in JPMorgan’s recent forecast of only 6.5% in U.S. high-yield defaults for 2020 and a modest 3.5% for 2021 (Exhibit 6).
Exhibit 6: U.S. High-Yield Default Rate and Forecast
[caption id=”attachment_328196″ align=”alignnone” width=”1018″]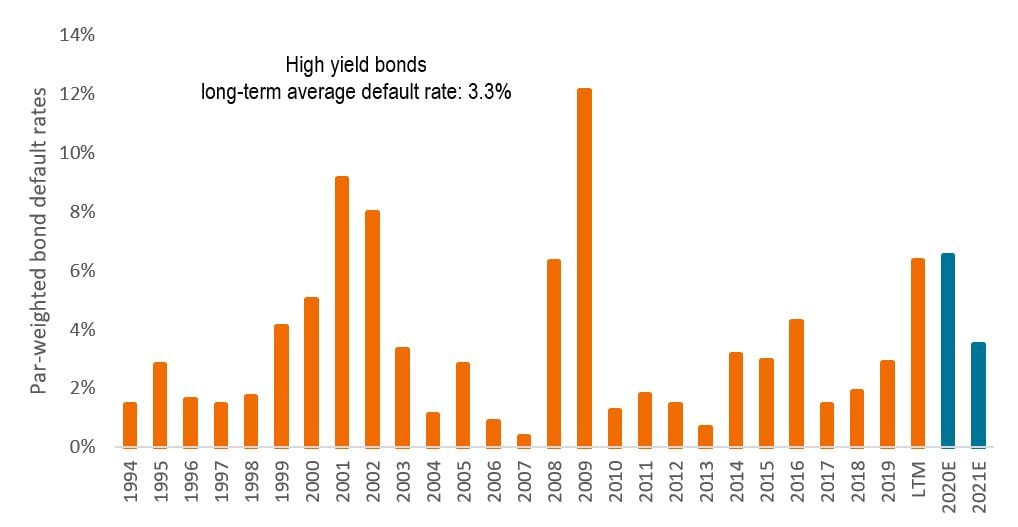 Source: JPMorgan U.S. High Yield and Leveraged Loan Strategy, 5 October 2020. LTM = last 12 months. Forecasts are estimates, may vary over time and are not guaranteed.[/caption]
The initial spike would not have surprised anyone in credit markets, coming as they did from companies that had long struggled with structural decline in their industry and could not deleverage their legacy balance sheets. For example, Frontier, a U.S. telecom company, defaulted with $16.7 billion of debt in March and then Intelsat, a satellite company, defaulted with $14.4 billion of debt in April.
Looking at the sectoral composition produced by JPMorgan, there are again no surprises. As portfolio managers, we look at industries through a simple lens: Is it an industry or company that can support leverage?
Exhibit 7: Industry Defaults Year to Date (Including Distressed Exchanges)
[caption id=”attachment_328207″ align=”alignnone” width=”640″]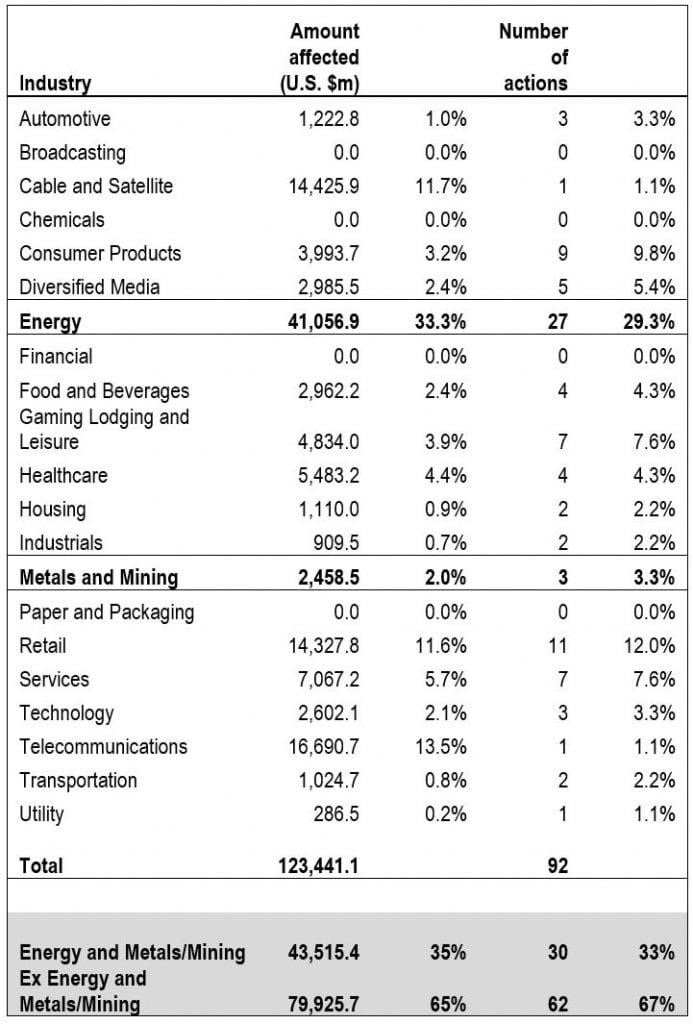 Source: JP Morgan U.S. High Yield and Leveraged Loan Strategy, 5 October 2020.[/caption]
The Coming Deleveraging Cycle
In polar opposition to the narrative of a solvency crisis, one might reasonably expect a period of healthy balance sheet deleveraging. To state the obvious, as earnings recover, leverage will mathematically decline, as we have seen in all previous cycles. Companies have entered the repair and recovery phase of the credit cycle, which historically tends to be the period when credit investors do well. In addition, the experience of the COVID-19 crisis could well leave a degree of corporate scarring in management psyches – a degree of resiliency being as valuable as maximizing return on equity through leverage. Assuming COVID-19 and vaccine news remains on track, we think the fundamental picture for 2021 for credit investors will be that a portion of the credit deterioration should be reversed in 2021-22.
1Macro tourist is an investor or commentator who leaves their comfort zone to make big pronouncements about how the economy works. A bearish view symbolizes a pessimistic or negative view of the market, a bullish view symbolizes a positive or optimistic view.
2JPMorgan, U.S. High Yield and Leveraged Loan Strategy, 5 October 2020.
3JPMorgan U.S. Equity Strategy and Global Quantitative Research, Bloomberg, 11 September 2020.
4Bloomberg, 8 October 2020.
Investment grade corporate bonds are bonds issued by companies perceived to have a relatively low risk of defaulting on their payments. The higher quality of these bonds is reflected in their higher credit ratings when compared with bonds thought to have a higher risk of default. A BBB rating denotes medium credit quality.
Knowledge. Shared
Blog
Back to all Blog Posts
Subscribe for relevant insights delivered straight to your inbox