Knowledge. Shared Blog
October 2020
Options Markets See a Tightening Race
-
 Ashwin Alankar, PhD
Head of Global Asset Allocation | Portfolio Manager
While recent polls may lead one to believe that the presidential race is all but called in favor of Joe Biden, options markets provide hints that the Democratic nominee’s gap over President Trump has narrowed even more than what we’ve witnessed in recent polling data.
Key Takeaways
- A revisit to our options-based model based on stock baskets that should favor Democrats or Republicans indicates that Joe Biden’s lead may be narrower than what is reflected in public polls.
- Assuming financial markets are efficient and reflect all publicly available information, the risks of a tail event for Democratic and Republican baskets should be roughly even.
- Yet in recent weeks the Republican basket is indicating a more favorable tail-risk profile relative to the Democratic basket, meaning that options markets view President Trump’s chances for reelection as not as dire was what’s considered in consensus data.
In September we presented an analysis based on signals from the options market that indicated investors using these derivatives had priced in a greater chance of victory by Democratic nominee Joe Biden than what was then being reflected in widely followed polling data. With the election just around the corner, we revisit the model to see how options now view the race relative to what the consensus polls tell us.
Our conclusion is that the options market views the race as having tightened in President Trump’s favor over the last couple of weeks and having done so at a pace quite faster than what we’ve seen in polling data. By using our proprietary tail-based Sharpe ratio1 to measure the tail risk of two baskets of stocks – one positioned to do well should Republicans prevail and another more aligned with the fate of Democrats – options markets currently signal that Mr. Trump’s chances for reelection are higher than what’s being reflected in the polls. This shift in Mr. Trump’s favor, however, may not negate the considerable lead polls indicate that Mr. Biden still maintains, but do indicate the options market sees the lead to be much less.
By utilizing data from research firm Strategas, we measure the attractiveness of a basket of “Democratic stocks,” identified as those stocks that historically have done well under a Democratic administration, and a basket of “Republican stocks” – defined similarly. The options market today sees the Republican basket as having a higher tail-Sharpe ratio than the Democratic basket, as illustrated below.
2020 Democrat vs. Republican Tail Sharpe Ratio
[caption id=”attachment_327155″ align=”alignnone” width=”1247″]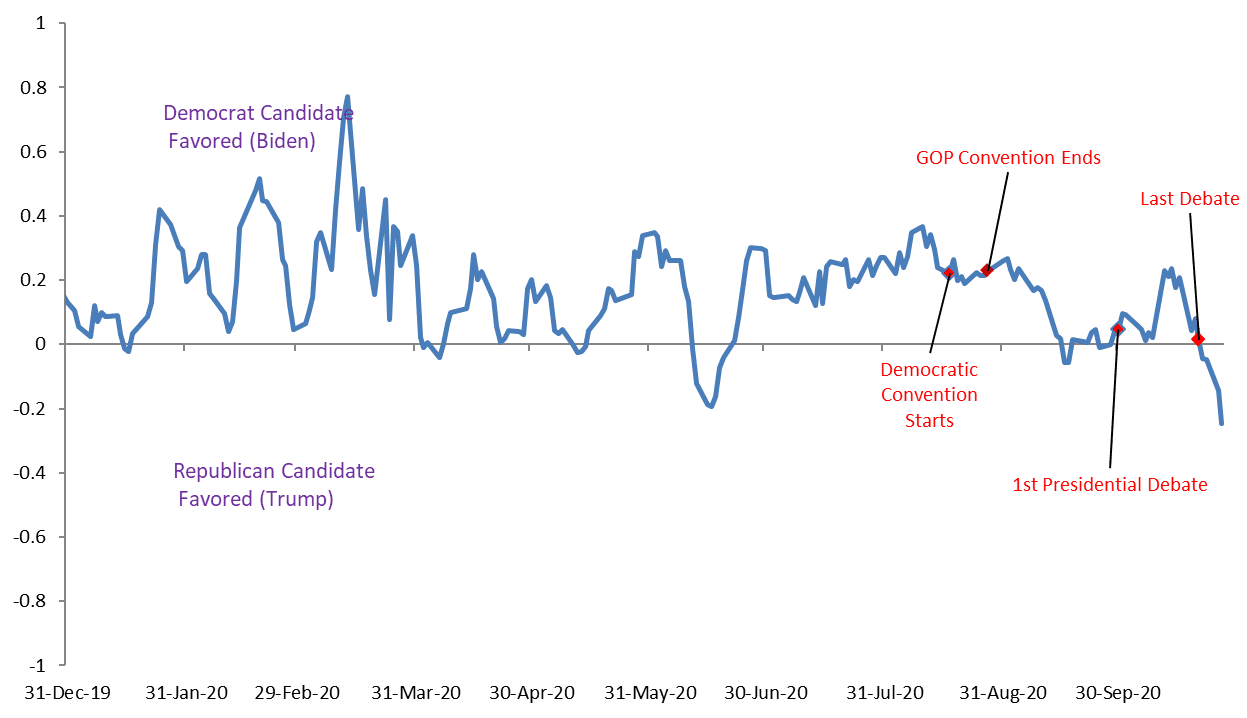 Source: Janus Henderson Investors; data as of 10/27/2020[/caption]
Assuming the equity cash market has priced in the public polls, this indicates that the options market is slightly favoring Mr. Trump relative to the conventional wisdom reflected in the polls. According to Real Clear Politics, Mr. Biden’s lead in the polls has fallen from roughly 10 percentage points about two weeks ago to about 7.5 percentage points today; the fact that the options market sees the Republican basket as more attractive implies that this market pegs Mr. Biden’s lead at much less than 7.5 percentage points.
While Mr. Biden’s lead is still considerable, we have seen over the last weeks the options market’s stance meaningfully move in Mr. Trump’s favor. With one week to go to the election, the probability of a tighter race and a potential contested election should not be ruled out.
The current options markets dynamics show similarity to 2016 with its bullishness for then Democratic nominee Hillary Clinton fading two weeks before the election date. The key difference, however, is Mrs. Clinton’s polling lead was much lower than what Mr. Biden enjoys today.
2016 Democrat vs. Republican Tail Sharpe Ratio
[caption id=”attachment_327194″ align=”alignnone” width=”1193″]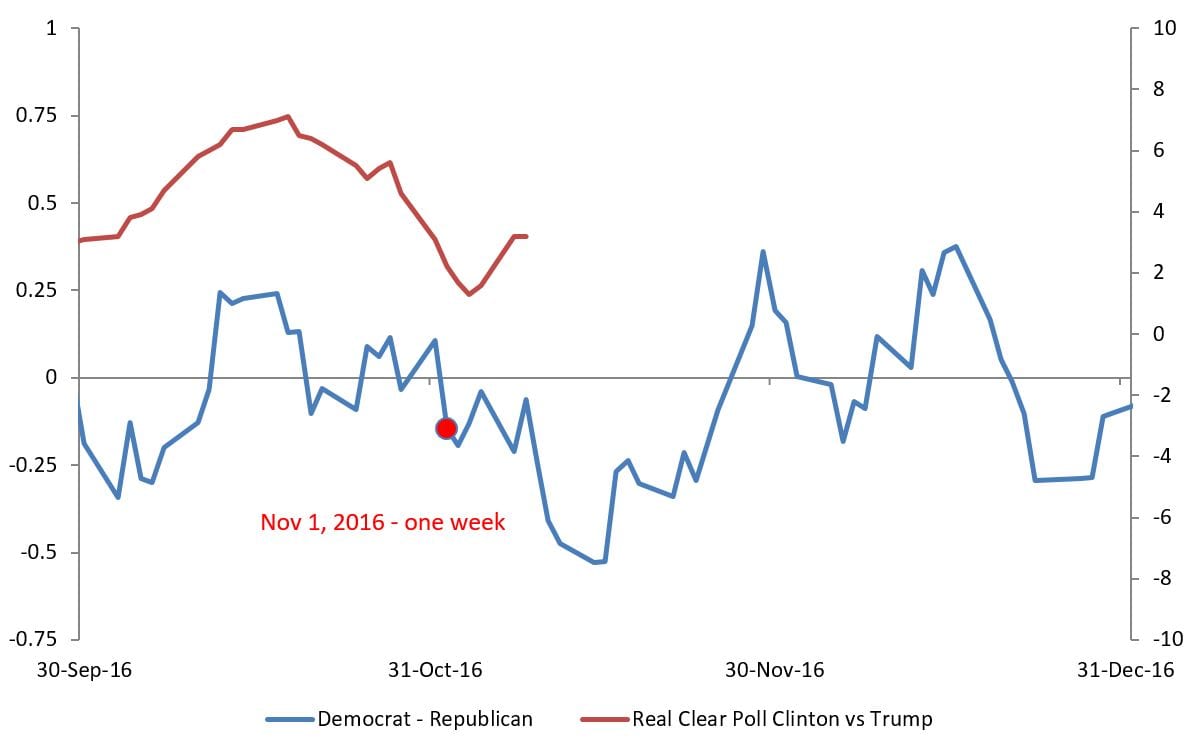 Source: Janus Henderson Investors; Note: Red dot indicates roughly one week before 2016 election.[/caption]
In the closing days of the campaign, should the options market show any significant changes in how it sees the race relative to what’s reflected in the major public polls, we’ll convey that in the most timely manner.
1Our team arrives at its outlook using options market prices to infer expected tail gains (ETG) and expected tail losses (ETL) for each basket of stocks. The ratio of these two (ETG/ETL) provides signals about the risk-adjusted attractiveness of each basket. We view this ratio as a “Tail-Based Sharpe Ratio.”
Live Webcast:
Making Sense of the 2020 U.S. Election
Register NowKnowledge. Shared
Blog
Back to all Blog Posts
Subscribe for relevant insights delivered straight to your inbox
I want to subscribe